. 2021 Nov 6;12(11):1054.
doi: 10.1038/s41419-021-04357-5.

DOK3 maintains intestinal homeostasis by suppressing JAK2/STAT3 signaling and S100a8/9 production in neutrophils

Affiliations

DOK3 maintains intestinal homeostasis by suppressing JAK2/STAT3 signaling and S100a8/9 production in neutrophils

Jia Tong Loh et al. Cell Death Dis. .

Abstract

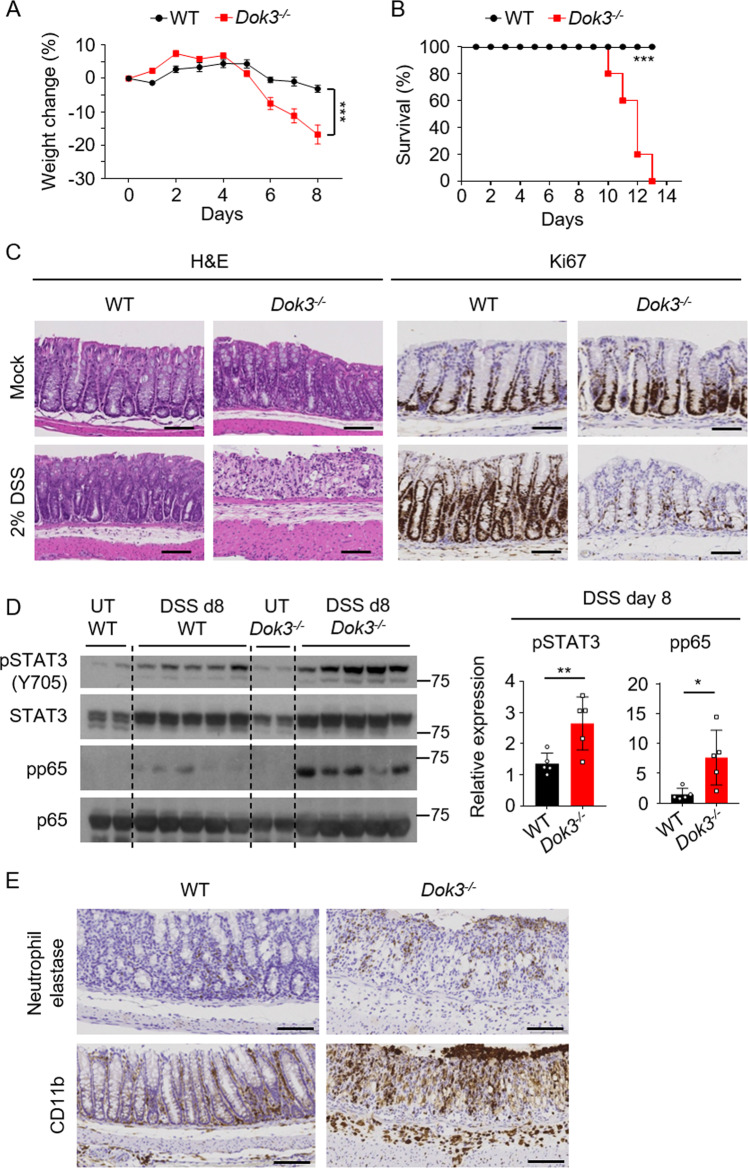
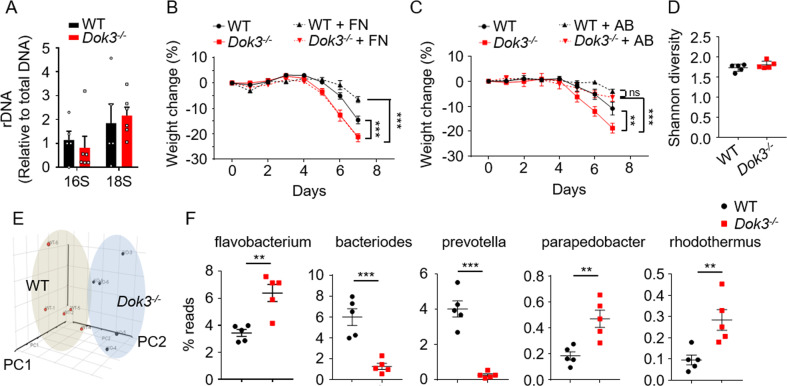
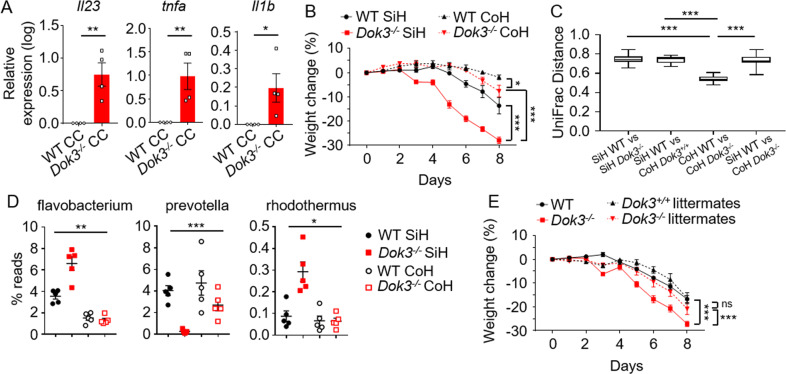
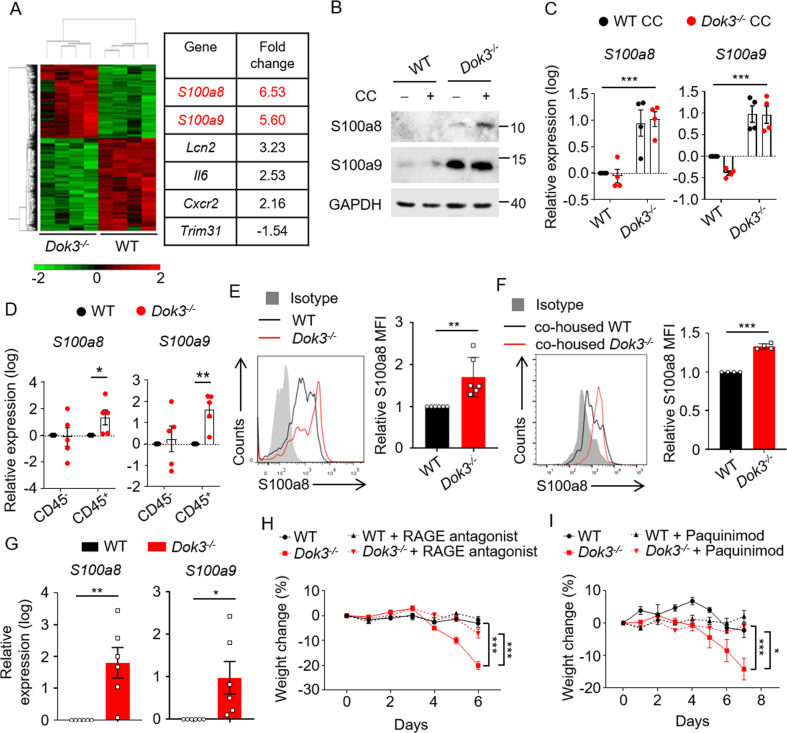
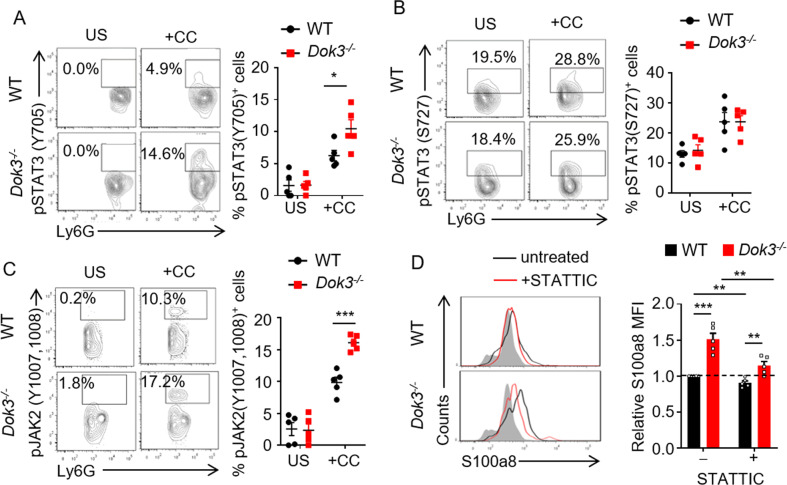
How pathogenesis of inflammatory bowel disease (IBD) depends on the complex interplay of host genetics, microbiome and the immune system is not fully understood. Here, we showed that Downstream of Kinase 3 (DOK3), an adapter protein involved in immune signaling, confers protection of mice from dextran sodium sulfate (DSS)-induced colitis. DOK3-deficiency promotes gut microbial dysbiosis and enhanced colitis susceptibility, which can be reversed by the transfer of normal microbiota from wild-type mice. Mechanistically, DOK3 exerts its protective effect by suppressing JAK2/STAT3 signaling in colonic neutrophils to limit their S100a8/9 production, thereby maintaining gut microbial ecology and colon homeostasis. Hence, our findings reveal that the immune system and microbiome function in a feed-forward manner, whereby DOK3 maintains colonic neutrophils in a quiescent state to establish a gut microbiome essential for intestinal homeostasis and protection from IBD.


Conflict of interest statement

The authors declare no competing interests.

Figures

Fig. 1
Fig. 1. Loss of DOK3 enhances susceptibility to DSS-induced colitis.
WT and Dok3−/− mice were given 2% DSS in their drinking water for 7 days. A Body weight and B survival were scored daily. A Data is shown as mean±S.E.M (n = 5). ***p < 0.0001, two-way repeated-measures ANOVA. B ***p = 0.0002, log-rank test. C Colon tissues were collected on day 8 and stained with H&E or Ki67. Scale bars, 100 µm. D Immunoblot analysis (left) and densitometry (right) of phosphorylated and total STAT3 and NF-κB p65 in the colons of untreated (UT) or DSS-treated mice (day 8). Each lane in the immunoblot represents one sample examined. Data is shown as mean ± SD (n = 5). *p = 0.02, **p = 0.01, unpaired two-tailed Student’s t-test. E Colon tissues were collected on day 8 and stained with neutrophil elastase or CD11b. Scale bars, 100 µm.
Fig. 2
Fig. 2. DOK3 deficiency results in a dysbiotic colonic bacterial microbiome.
A RT-qPCR analysis of 16S and 18S rDNA in fecal DNA obtained from WT and Dok3−/− mice. Data is shown as mean ± SEM (n = 5–6). B WT and Dok3−/− mice were given fluconazole (FN) in their drinking water for 2 weeks prior to the induction of DSS colitis. Body weights were measured daily. Data is shown as mean ± SEM (n = 5). ***p < 0.0001, two-way repeated-measures ANOVA. C WT and Dok3−/− mice were given antibiotics (AB) cocktail (vancomycin, ampicillin, neomycin, and metronidazole) in their drinking water for 4 weeks prior to the induction of DSS colitis. Body weights were measured daily. Data is shown as mean ± SEM (n = 5). **p = 0.01, ***p = 0.0005, two-way repeated-measures ANOVA. DF High throughput sequencing of 16S rRNA in fecal bacterial DNA. D Shannon diversity of WT and Dok3−/− mice fecal microbiota. Data is shown as mean ± SD (n = 5). E Principal-component analysis of the microbiota composition in WT and Dok3−/− mice. Each symbol represents an individual mouse. F Relative abundance of major bacterial genera in WT and Dok3−/− mice fecal microbiota. Data is shown as mean ± SEM (n = 5). **p = 0.002, 0.004, 0.008, ***p = 0.0005, <0.0001 (from left to right), unpaired two-tailed Student’s t-test.
Fig. 3
Fig. 3. Microbiome in Dok3−/− mice regulates colitis susceptibility.
A RT-qPCR analysis of Il23, tnfa, and il1b expression relative to b-actin expression in WT lamina propria cells following 3 h stimulation with cecal contents (CC) from WT or Dok3−/− mice. Data is shown as mean ± SEM (n = 4). *p = 0.04, **p = 0.005, 0.01 (from left to right), unpaired two-tailed Student’s t-test. B Singly-housed (SiH) or co-housed (CoH) WT and Dok3−/− mice were given 2% DSS in their drinking water for 7 days and their body weights measured daily. Data is shown as mean ± SEM (n = 5). *p = 0.03, ***p < 0.0001, two-way repeated-measures ANOVA. C Unweighted UniFrac distance between SiH and CoH WT and Dok3−/− mice (n = 5). ***p < 0.0001, Kruskal–Wallis test with Dunn’s post-hoc test. D Relative abundance of major bacterial genera in singly-housed (SiH) or co-housed (CoH) WT and Dok3−/− mice fecal microbiota. Data is shown as mean ± SEM (n = 5). *p = 0.02, **p = 0.006, ***p = 0.0001, two-way ANOVA. E Dok3+/+ and Dok3−/− littermates or non-littermates were given 2% DSS in their drinking water for 7 days and their body weights measured daily. Data is shown as mean ± SEM (n = 5). ***p < 0.0001, 0.0008 (from left to right), two-way repeated-measures ANOVA.
Fig. 4
Fig. 4. DOK3 regulates S100a8/9 production by neutrophils.
A Expression heatmap based on microarray analysis of genes differentially expressed between colonic cells from WT and Dok3−/− mice given 2% DSS in drinking water for 6 days. B Immunoblot analysis of S100a8, S100a9, and GAPDH in untreated (−) or cecal content (CC)-treated (+) lamina propria cells from WT and Dok3−/− mice. Data is representative of three independent experiments. C RT-qPCR analysis of S100a8 and S100a9 expression relative to b-actin expression in lamina propria cells of WT and Dok3−/− mice following 3 h stimulation with cecal contents from WT and Dok3−/− mice. Data is shown as mean±S.E.M (n = 4, four independent experiments). ***p < 0.0001, two-way ANOVA. D RT-qPCR analysis of S100a8 and S100a9 expression relative to b-actin expression in CD45 and CD45+ cell fractions isolated from the lamina propria of WT and Dok3−/− mice following 3 h stimulation with cecal contents from WT mice. Data is shown as mean ± SEM (n = 5, five independent experiments). *p = 0.04, **p = 0.002, unpaired two-tailed Student’s t-test. E Flow cytometric analysis of S100a8 expression in WT and Dok3−/− neutrophils following 3 h stimulation with cecal contents from WT mice. Histograms were pre-gated on singlet, CD45+, Ly6G+ cells. Filled histogram represent isotype control. Bar graph depicting MFI of S100a8 fluorescence in Dok3−/− neutrophils relative to WT neutrophils. Data is shown as mean ± SD (n = 6, five independent experiments). **p = 0.004, unpaired two-tailed Student’s t-test. F Flow cytometric analysis of S100a8 expression in co-housed WT and Dok3−/− neutrophils following 3 h stimulation with cecal contents from WT mice. Histograms were pre-gated on singlet, CD45+, Ly6G+ cells. Filled histogram represent isotype control. Bar graph depicting MFI of S100a8 fluorescence in Dok3−/− neutrophils relative to WT neutrophils. Data is shown as mean ± SD (n = 4, three independent experiments). **p < 0.0001, unpaired two-tailed Student’s t-test. G RT-qPCR analysis of S100a8 and S100a9 expression relative to b-actin expression in bone marrow-purified neutrophils from WT and Dok3−/− mice following 3 h stimulation with cecal contents from WT mice. Data is shown as mean±S.E.M (n = 6, six independent experiments). *p = 0.02, **p = 0.003, unpaired two-tailed Student’s t-test. H WT and Dok3−/− mice were injected intraperitoneally with RAGE antagonist (1 mg/kg) daily, and given 2% DSS in their drinking water for 7 days. Body weights were measured daily. Data is shown as mean ± SEM (n = 4). ***p < 0.0001, two-way repeated-measures ANOVA. I WT and Dok3−/− mice were injected intraperitoneally with Paquinimod (5 mg/kg) daily, and given 2% DSS in their drinking water for 8 days. Body weights were measured daily. Data is shown as mean ± SEM (n = 4). *p = 0.03, ***p < 0.0001, two-way repeated-measures ANOVA.
Fig. 5
Fig. 5. DOK3 suppresses JAK2-STAT3 signaling in neutrophils.
AC Lamina propria cells from WT and Dok3−/− mice were unstimulated (US) or stimulated for 10 min with cecal contents (+CC) from wild-type mice. Flow cytometric analysis of A pSTAT3 (Y705), B pSTAT3 (S727) and C pJAK2 (Y1007, 1008) in colonic neutrophils (n = 5, four independent experiments). Contour plots were pre-gated on singlet, CD45+, Ly6G+ cells. Data is shown as mean ± SEM. A *p = 0.03, unpaired two-tailed Student’s t-test. C ***p = 0.0002, unpaired two-tailed Student’s t-test. D Cells from lamina propria of WT and Dok3−/− mice were stimulated for 3 h with cecal contents from wild-type mice in the absence (black histogram) or presence (red histogram) of STATTIC. Flow cytometric analysis of S100a8 expression in WT and Dok3−/− colonic neutrophils. Histograms were pre-gated on singlet, CD45+, Ly6G+ cells. Filled histogram represents isotype control. Bar graph depicts MFI of S100a8 fluorescence in WT (black bars) and Dok3−/− (red bars) neutrophils treated or not with STATTIC relative to that of untreated WT neutrophils. Data is shown as mean ± SEM (n = 5, four independent experiments). **p = 0.008, 0.007, 0.005 (from left to right), ***p = 0.0002, unpaired two-tailed Student’s t-test.

Similar articles

Cited by

References

    1. Jostins L, Ripke S, Weersma RK, Duerr RH, McGovern DP, Hui KY, et al. Host-microbe interactions have shaped the genetic architecture of inflammatory bowel disease. Nature. 2012;491:119–24. - PMC - PubMed
    1. Liu JZ, van Sommeren S, Huang H, Ng SC, Alberts R, Takahashi A, et al. Association analyses identify 38 susceptibility loci for inflammatory bowel disease and highlight shared genetic risk across populations. Nat Genet. 2015;47:979–86. - PMC - PubMed
    1. Imhann F, Vich Vila A, Bonder MJ, Fu J, Gevers D, Visschedijk MC, et al. Interplay of host genetics and gut microbiota underlying the onset and clinical presentation of inflammatory bowel disease. Gut. 2018;67:108–19. - PMC - PubMed
    1. Reichardt N, Duncan SH, Young P, Belenguer A, McWilliam Leitch C, Scott KP, et al. Phylogenetic distribution of three pathways for propionate production within the human gut microbiota. ISME J. 2014;8:1323–35. - PMC - PubMed
    1. Smith PM, Howitt MR, Panikov N, Michaud M, Gallini CA, Bohlooly YM, et al. The microbial metabolites, short-chain fatty acids, regulate colonic Treg cell homeostasis. Science. 2013;341:569–73. - PMC - PubMed

Publication types

MeSH terms