. 2022 Apr 22;31(8):1242-1262.
doi: 10.1093/hmg/ddab315.

The Jun-dependent axon regeneration gene program: Jun promotes regeneration over plasticity

Affiliations

The Jun-dependent axon regeneration gene program: Jun promotes regeneration over plasticity

Matthew R J Mason et al. Hum Mol Genet. .

Erratum in

Abstract

The regeneration-associated gene (RAG) expression program is activated in injured peripheral neurons after axotomy and enables long-distance axon re-growth. Over 1000 genes are regulated, and many transcription factors are upregulated or activated as part of this response. However, a detailed picture of how RAG expression is regulated is lacking. In particular, the transcriptional targets and specific functions of the various transcription factors are unclear. Jun was the first-regeneration-associated transcription factor identified and the first shown to be functionally important. Here we fully define the role of Jun in the RAG expression program in regenerating facial motor neurons. At 1, 4 and 14 days after axotomy, Jun upregulates 11, 23 and 44% of the RAG program, respectively. Jun functions relevant to regeneration include cytoskeleton production, metabolic functions and cell activation, and the downregulation of neurotransmission machinery. In silico analysis of promoter regions of Jun targets identifies stronger over-representation of AP1-like sites than CRE-like sites, although CRE sites were also over-represented in regions flanking AP1 sites. Strikingly, in motor neurons lacking Jun, an alternative SRF-dependent gene expression program is initiated after axotomy. The promoters of these newly expressed genes exhibit over-representation of CRE sites in regions near to SRF target sites. This alternative gene expression program includes plasticity-associated transcription factors and leads to an aberrant early increase in synapse density on motor neurons. Jun thus has the important function in the early phase after axotomy of pushing the injured neuron away from a plasticity response and towards a regenerative phenotype.


Figures

Figure 1
Figure 1
Jun deletion causes profound differences in gene expression after axotomy. (a) Cresyl violet-stained facial nucleus (outlined in green) shown before (left) and after laser dissection. Scale bar 500 μm. (b) Principle component analysis of WT and KO gene expression profiles 1–14 days after facial nerve injury and in uninjured animals, performed with the 500 most variable genes. Each point represents one animal. While uninjured WT and KO animals cluster together, at day 1 after injury the two genotypes begin to move apart and are clearly separable at day 4 and day 14, while within each time point/genotype animals cluster near each other, apart from one uninjured wild-type animal. The trajectory of KO animals (blue arrow) shows a reduced distance of travel in principle component 1 compared to the WT trajectory (green arrow), reflecting the reduced regulation of Jun target genes. (c) Heatmap of gene expression profiles with hierarchical clustering. Genotype and time point are indicated by color on the x-axis as shown in the key. In general, animals at the same time point and genotype cluster together. (d) Numbers of genes regulated by axotomy and differentially regulated with Jun deletion in facial motor neurons. In the left panel the overlap of the two boxes represents genes upregulated in a Jun-dependent manner (the JunUP class). The AltDOWN class (newly or more strongly downregulated genes in the KO) is also indicated. In the right-panel, the overlapping areas represent Jun-dependent downregulated genes (the JunDOWN class) while the purple area indicates genes that are de novo upregulated or more strongly upregulated by axotomy in KO animals (the AltUP class). (e) Percentages of regeneration-associated genes that show complete dependence on Jun after axotomy at each time point (so not significantly regulated in KO animals after axotomy, compared to uninjured animals), partial dependence (still upregulated after axotomy in KO mice but significantly less than in WT mice) and complete dependence on Jun over the whole time-course (no residual upregulation seen at any time point).
Figure 2
Figure 2
Heatmaps depicting differential gene expression for selected genes in WT and KO facial motor nuclei after axotomy, showing that Jun regulates a subset of RAGs, including several transcription factors and suppresses an alternative gene expression program. (a) Genes which show Jun-dependent upregulation after axotomy (the JunUP regulatory class), at both 1 day and 4 days (and in some cases also at 14 days) with no significant upregulation in KO animals. (b) Genes in JunUP where upregulation is partially Jun-dependent at 1 day or 4 days. In many cases, at 14 days upregulation continues in WT animals but returns to baseline in the KO. (c) Well-known regeneration-associated genes (RAGs) show a range of effects of Jun deletion. Gap43, Sprr1a and several tubulins (Tuba1c, Tubb2b) are lower from 4 days onwards. Other RAGs (Atf3, Basp1) are not significantly affected by Jun expression. (d) Transcription factors in JunUP with no regulation in KO animals. (e) Transcription factors in JunUP, which do still show significant regulation in KO animals. (f) Genes which show de novo or increased upregulation after axotomy in KO motor neurons (the AltUP regulatory class). The 20 most differentially expressed genes are shown. This appears to be a gene expression program that is induced by axotomy but normally suppressed by Jun. Some genes, such as Fgf21 and Gdf15, show strong and sustained upregulation. (g) Transcription factors in AltUP. Early upregulation of plasticity-associated TFs Fos, Egr1 and Egr2 is seen. For all genes shown, no significant expression difference between genotypes in intact animals was detected. Asterisks indicate a significant difference in expression between WT and KO animals (FDR <0.01, fold-change >1.5). See Supplementary Material, Figure S2 for qPCR validation of expression profiles.
Figure 3
Figure 3
GO analysis of the JunUP, AltUP and JunDOWN regulatory classes shows that most functions of Jun-dependent genes after axotomy are relevant to regeneration. Shown is an overview of broad categories of over-represented GO classes. Circle fill color indicates FDR of the most significant GO class per category. Size represents percentage of genes in the regulatory class, as shown in the key (only categories with at least 5% of genes are shown). Categories are color-coded to distinguish regeneration-relevant functions, other functions, Jun-downregulated neurotransmission-related classes and the Jun-suppressed plasticity response. Initially (at day 1), the range of over-represented functions is small, but these become broader with time as many more processes are affected at day 4 and day 14. Known functions of Jun such as cell-death and control of cell cycle are represented but are outnumbered by classes related to regeneration, such as cytoskeleton organization, cell adhesion and intracellular signaling. Together with cell activation and metabolic functions, these suggest an overall activation of cellular metabolism and cytoskeleton production as major pro-regenerative functions of Jun. Meanwhile, Jun also downregulates genes related to neurotransmission (in the JunDOWN class), and AltUP genes contain synaptic plasticity classes as well as metabolic functions. See Figs S3 and S4 for expression profiles of genes by functional category.
Figure 4
Figure 4
JunUP and AltUP genes are regulated specifically in neurons. (a-c) ISH and (d) immunohistochemistry (IHC). Time points after axotomy are indicated by the labels. (a) ISH for two apoptosis-linked Jun targets, Msh6 and Casp6. (b) ISH for three known regeneration-associated genes, Sprr1a, Npy and Flrt3, with strong Jun dependence. (c) ISH for three genes in the AltUP category, Egr1, Reg3b and Gdf15. (d) IHC for two genes in the AltUP category at day 1, namely Fos and Egr2. All targets are regulated as expected and upregulation is confined to the facial motor neurons. Scale bar 50 μm. See Supplementary Material, Figure S5 for further examples. (e) Quantification of gene and protein expression differences in histological stainings between WT and KO animals. Graphs show the ratio of WT to KO staining intensities in cytoplasm (ISH) and nuclei (IHC for Fos and Egr2) and confirm the differential expression profiles after axotomy in facial motor neurons between WT and KO animals.
Figure 5
Figure 5
Promoter analysis reveals predominant over-representation of AP1 sites in Jun-dependent genes. (a) Over-representation (OR) ratio (of sites in regulated promoters to sites in an unregulated promoter set) of AP1 sites in JunUP promoters at each time point was calculated for varying promoter lengths and requirements for cross-species conservation, using the AP1 position weight matrix in Supplementary Material, Figure S6. The requirement for conservation of binding site scores across additional species dramatically improves the OR ratios, and is essential to detect OR ratios above 2.5 (indicated by a dotted line) in most cases. Short promoter sequences give higher ratios, likely because of clustering of AP1 sites near transcription start sites. Here, all over-representation is significant at P < 0.005 (binomial test; FDR <0.01). Conservation in rat, guinea pig, rabbit, human and marmoset was included. (b) As an alternative measure to the ratio of sites, we calculated the number of additional sites (‘AS’) compared to that expected from the control promoter set. Optimizing the AS score identifies more binding sites than optimizing for ratio. AS increases with promoter length (shown on the x-axis), unlike OR ratio. AS also benefits from the requirement for conservation. Here, a minimum ratio threshold of 2.5 was imposed. (c) Over-representation of CRE sites in JunUP promoters, optimized for AS score. ATF2 and ATF3 binding sites (both CRE-like) were only over-represented at day 1, and less robustly so than AP1 sites. Results for CREBP1 sites were similar to ATF3 (not shown). (d) Promoter analysis of binding sites for Jun dimers with various partners. AS score is plotted against expression level, for day 1 (circle) and day 4 (triangle) for position weight matrices representing JUN dimerized with the factor indicated. JUN:JUND and JUN:BATF3 matrices were not available, so JUND and BATF3 homodimers are shown instead with dotted lines. The data are consistent with regulation by Jun dimers with ATF3, AP1 family members including JUNB and FOSL2, but strong signals are seen for the two related factors BATF and BATF3.
Figure 6
Figure 6
Further analysis of JunUP promoters and AltUP promoters, leading to proposed modes of regulation by Jun. (a-c) Using 1 kb promoters, requirement for conservation in three additional species besides mouse, and optimizing for the additional sites (AS) score, we analyzed the JunUP promoters for all binding sites in our database. Often, multiple position weight matrices (PWMs) corresponding to different TFs detect sites at the same locations, so PWMs detecting hits at the same locations were grouped together. The PWM with highest AS score is indicated first. In brackets is the highest-expressed TF in the same location group with at least 75% of the highest score. AP1 sites (red bars) show highest over-representation scores at day 1 and day 4, and second highest at day 14. CRE sites were 10th highest at day 1. (b) Analysis of AltUP promoters shows SRF sites as the only type over-represented at day 1, while at later time points CEBP sites dominate. (c) We analyzed the flanking regions of AP1 sites found in (a) to identify possible co-operating factors. Here, we found CRE sites (blue bars) over-represented in these flanking regions. (d) Flanking region analysis of SRF sites found in (b) identifies CRE sites (blue bar) are over-represented in these regions. (e) Four proposed modes of transcriptional regulation by Jun suggested by the analysis in (a-e). Jun increases transcription predominantly via AP1 sites, and at AP1 and CRE sites in proximity, but only weakly from CRE sites alone. Meanwhile, Jun blocks SRF activity via CRE sites in close proximity to SRF binding sites.
Figure 7
Figure 7
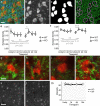
The aberrant plasticity gene expression response, usually suppressed by Jun, manifests as an increase in synaptic density. (a) Immunohistochemistry for motor neuron cell bodies (Nissl stain; red), synaptophysin to visualize synapses (green) and MAP2 to label dendrites (blue). (b) Single channel image of the Nissl stain. (c) Mask generated by the U-NET neural network trained to recognize facial motor neurons. (d) Rim of motor neurons identified in (c) overlaid (in magenta) on a thresholded image of the synaptophysin staining. Synapse density was calculated as fraction of green pixels in the neuronal rim area. Scale bar: 20 μm. (e) Synapse density changes on motor neuron cell bodies after axotomy in WT and KO mice. In WT animals, synaptic stripping can be observed beginning at day 1. Synapse density remains lower over the time course. (The decline over the whole time course is significant, P = 0.04.) ln KO animals, on the other hand, synapse density is lower than in WT animals but increases significantly in the first day (P = 0.01), consistent with the observed expression of a plasticity related set of genes in these animals (Fos, Egr1, Egr2). The changes in density over the first day are significantly different between genotypes (P = 0.002). (f) Synapse density changes on motor neuron dendrites after axotomy in WT and KO mice. Again, synapse density declines slightly on perineuronal dendrites (n.s.). In KO animals, as on the cell bodies, a marked increase is seen in the first day (P = 7 × 10−5). The changes in density over the first day are significantly different between genotypes (P = 0.008). Data in (e) and (f) are shown as mean ± 95% confidence intervals. (g-j). Synaptophysin staining (green) and Nissl stain (red) shows synapse density changes in WT and KO mice over the first day. Rim synapse densities of the neurons shown are close to the mean values depicted in panel (e). A decrease in density is visible in WT mice from uninjured (g) to day 1 after axotomy (h), while the low initial density in uninjured KO animals (i) and sharp increase 1 day after axotomy (j) are visible. Scale bar 10 μm. (k, l). Immunohistochemistry for SRF in WT (k) and KO (l) facial nuclei 1 day after axotomy. SRF staining intensity was similar between genotypes. Scale bar: 50 μm. (m) Quantification of nuclear SRF labeling at all time points. No difference between genotypes and no significant regulation of SRF protein after axotomy was seen. Data are shown as mean ± SEM. Thus, the expression of SRF target genes in KO mice is not due to higher SRF expression in these animals.
Figure 8
Figure 8
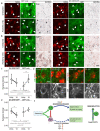
Synaptic density increase is driven by SRF target genes. (a-d) Dominant negative SRF blocks AltUP gene expression and restores normal synapse density responses. AAV6 vectors expressing both dominant negative SRF (dnSRF) and farnesylated GFP (fGFP), or control vectors expressing fGFP only, were delivered to the facial nucleus in KO mice. See Supplementary Material, Figure S7 for AAV serotype testing. (a, b). Immunohistochemistry for Fos (a) and ISH for Gdf15 (b) in KO animals in neurons expressing fGFP and dnSRF, or fGFP only. The left sets of six panels show Fos and Gdf15 induction in motor neurons expressing fGFP only, while this is blocked in neurons expressing dnSRF (right sets of six panels). Arrows indicate motor neurons visible in Nissl staining that are GFP positive and thus transduced. Scale bar 25 μm. See Supplementary Material, Figure S8 for more examples. (c) DnSRF restores normal synapse density responses. Synapse density was quantified in GFP positive motor neurons and GFP-positive dendrites 1 day after facial nerve injury and in uninjured animals. Baseline synapse density on motor neurons expressing GFP and thus dnSRF is restored to WT levels and decreases slightly (n.s.) as in WT animals, while motor neurons expressing only fGFP show an increase in synapse density, similar to that seen in Figure 7e. Data are shown as mean ± 95% confidence intervals. (d) Synaptophysin (green) and Nissl stain to identify motor neurons (red) (top row). Each motor neuron is GFP-positive and thus transduced (bottom row). The synapse density changes quantified in (c) can be seen. Each motor neuron shown has a rim synapse density close to the mean value shown in (c) for the condition indicated. Scale bar 10 μm. (e) On dendrites, while the increase in synapse density on dendrites of fGFP-only expressing neurons is not significant, dnSRF induces a significant decrease, indicating that synaptic stripping is restored. Data are shown as mean ± 95% confidence intervals. (f) Schematic depiction of the effect of Jun on neuronal phenotype early after axotomy. In WT animals, axotomy leads to Jun upregulation and activity, leading to RAG upregulation. Synaptic stripping occurs as part of the regeneration program. Axotomy also leads to SRF activation, but SRF activity is normally blocked by Jun (see also Fig. 6e). In the absence of Jun, SRF activity leads to an aberrant plasticity response involving Fos, Egr1 and Egr2 and increased synapse density. Thus, Jun pushes the cell away from a plasticity response towards a regeneration response.

Similar articles

Cited by

References

    1. Neumann, S. and Woolf, C.J. (1999) Regeneration of dorsal column fibers into and beyond the lesion site following adult spinal cord injury. Neuron, 23, 83–91. - PubMed
    1. Fernandes, K.J., Fan, D.P., Tsui, B.J., Cassar, S.L. and Tetzlaff, W. (1999) Influence of the axotomy to cell body distance in rat rubrospinal and spinal motoneurons: differential regulation of GAP-43, tubulins, and neurofilament-M. J. Comp. Neurol., 414, 495–510. - PubMed
    1. Fawcett, J.W. (2020) The struggle to make CNS axons regenerate: why has it been so difficult? Neurochem. Res., 45, 144–158. - PMC - PubMed
    1. Sun, F. and He, Z. (2010) Neuronal intrinsic barriers for axon regeneration in the adult CNS. Curr. Opin. Neurobiol., 20, 510–518. - PMC - PubMed
    1. Finelli, M.J., Wong, J.K. and Zou, H. (2013) Epigenetic regulation of sensory axon regeneration after spinal cord injury. J. Neurosci., 33, 19664–19676. - PMC - PubMed

Publication types

MeSH terms

Substances