. 2021 Oct 18;12(1):6065.
doi: 10.1038/s41467-021-26177-z.

PDZD-8 and TEX-2 regulate endosomal PI(4,5)P2 homeostasis via lipid transport to promote embryogenesis in C. elegans

Affiliations

PDZD-8 and TEX-2 regulate endosomal PI(4,5)P2 homeostasis via lipid transport to promote embryogenesis in C. elegans

Darshini Jeyasimman et al. Nat Commun. .

Abstract

Different types of cellular membranes have unique lipid compositions that are important for their functional identity. PI(4,5)P2 is enriched in the plasma membrane where it contributes to local activation of key cellular events, including actomyosin contraction and cytokinesis. However, how cells prevent PI(4,5)P2 from accumulating in intracellular membrane compartments, despite constant intermixing and exchange of lipid membranes, is poorly understood. Using the C. elegans early embryo as our model system, we show that the evolutionarily conserved lipid transfer proteins, PDZD-8 and TEX-2, act together with the PI(4,5)P2 phosphatases, OCRL-1 and UNC-26/synaptojanin, to prevent the build-up of PI(4,5)P2 on endosomal membranes. In the absence of these four proteins, large amounts of PI(4,5)P2 accumulate on endosomes, leading to embryonic lethality due to ectopic recruitment of proteins involved in actomyosin contractility. PDZD-8 localizes to the endoplasmic reticulum and regulates endosomal PI(4,5)P2 levels via its lipid harboring SMP domain. Accumulation of PI(4,5)P2 on endosomes is accompanied by impairment of their degradative capacity. Thus, cells use multiple redundant systems to maintain endosomal PI(4,5)P2 homeostasis.


Conflict of interest statement

The authors declare no competing interests.

Figures

Fig. 1
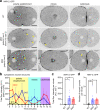
Fig. 1. Ectopic accumulation of PI(4,5)P2 in the absence of SMP proteins in C. elegans early embryos.
a Schematics of C. elegans SMP proteins, C53B4.4/PDZD-8, F55C12.5/TEX-2, R11G1.6/TMEM-24, and ESYT-2. Blue circles indicate hydrophobic stretches that anchor these proteins to the endoplasmic reticulum. Domains for each protein are annotated as indicated. b Representative live spinning disc confocal (SDC) images of equatorial planes of early embryos from wild-type control (WT) and mutant lacking all the four SMP proteins [quadruple knockout: QKO (pdzd-8; tex-2; tmem-24; esyt-2)], expressing PI(4,5)P2 biosensor (mCherry::PHPLCδ1). Images of each row are from time-lapse movies of the same embryos at different phases as indicated. Note the presence of ectopic PI(4,5)P2-positive puncta, indicated by yellow arrowheads, in a QKO embryo compared to a WT embryo. Scale bars, 10 μm. c Time-course analysis of the total fluorescence intensity of PI(4,5)P2-positive puncta, as assessed by mCherry::PHPLCδ1, during polarity establishment (0–6 min), mitosis (6–10 min), and cytokinesis (10–13 min) phases for WT and QKO early embryos as shown in (b) [mean ± SEM, n = 13 embryos (WT), n = 15 embryos (QKO)]. d Quantification of the total fluorescence intensity of PI(4,5)P2-positive puncta, as assessed by mCherry::PHPLCδ1, per minute during early embryogenesis (0–13 min). Comparisons between WT and QKO early embryos are shown [mean ± SEM, n = 13 embryos (WT), n = 15 embryos (QKO); two-tailed unpaired Student’s t-test, *p = 0.0274]. e Quantification of the total fluorescence intensity of PI(4,5)P2-positive puncta per minute, as assessed by mCherry::PHPLCδ1, in each phase of the early embryogenesis as indicated for WT and QKO embryos [mean ± SEM, n = 13 embryos (WT), n = 15 embryos (QKO); two-tailed unpaired Student’s t-test, **p = 0.005523 (p.e.), ns not significant]. p.e., m, and c denote polarity establishment, mitosis, and cytokinesis, respectively.
Fig. 2
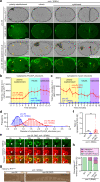
Fig. 2. Aberrant recruitment of proteins involved in actomyosin contraction to PI(4,5)P2-positive endosomal membranes in the absence of SMP proteins.
a Left: A representative live spinning disc confocal (SDC) image of an equatorial plane of an early embryo from a mutant lacking all the four SMP proteins [quadruple knock-out: QKO (pdzd-8; tex-2; tmem-24; esyt-2)], co-expressing PI(4,5)P2 biosensor (mCherry::PHPLCδ1) and NMY-2-tagged with GFP (NMY-2::GFP). The image is from the polarity establishment phase. Right: Magnified insets, showing PI(4,5)P2-positive puncta, as determined by the presence of mCherry::PHPLCδ1, that are outlined by indicated white dotted boxes. Scale bar, 10 μm. b Time-lapse SDC images of a representative PI(4,5)P2-positive puncta from an early embryo from QKO, co-expressing mCherry::PHPLCδ1 and NMY-2::GFP, over the period of 2 min. White arrowheads indicate the positions of the PI(4,5)P2-positive puncta. Note the extensive overlap of NMY-2::GFP signals with the PI(4,5)P2-positive puncta. Scale bars, 5 μm. c Time-lapse images of representative NMY-2::GFP puncta from an early embryo from QKO over the period of 50 s. Top panel: images from SDC microscopy. Bottom panel: images from SDC structure illumination microscopy (SDC-SIM). Note the lumen inside the NMY-2::GFP puncta in SDC-SIM images. Scale bars, 5 μm. d, e Left: Live SDC-SIM images of early embryos from QKO, expressing NMY-2::GFP together with either d wrmScarlet-tagged ANI-1 (wrmScarlet::ANI-1) or e lifeACT-tagged with RFP (lifeACT::RFP), showing representative NMY-2::GFP puncta that are co-localized with the marker proteins as indicated. Right: Line scan profiles of NMY-2::GFP (green) and either d wrmScarlet::ANI-1 or e lifeACT::RFP (red) fluorescence signals along the white dotted lines as indicated. Scale bars, 1 μm. f, g Left: Live SDC-SIM images of early embryos from QKO, expressing wrmScarlet::ANI-1 together with either f GFP-tagged RAB-7 (GFP::RAB-7) or g GFP-tagged RAB-11.1 (GFP::RAB-11.1), showing representative wrmScarlet::ANI-1 puncta that are co-localized with the marker proteins as indicated. Right: Line scan profiles of wrmScarlet::ANI-1 (red) and either f GFP::RAB-7 or g GFP::RAB-11.1 (green) fluorescence signals along the white dotted lines as indicated. Scale bars, 1 μm.
Fig. 3
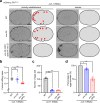
Fig. 3. Redundant functions of PDZD-8 and TEX-2.
a Representative live spinning disc confocal (SDC) images of equatorial planes of early embryos from wild-type control (WT), mutant lacking all the four SMP proteins [quadruple knock-out: QKO (pdzd-8; tex-2; tmem-24; esyt-2)] and mutant lacking PDZD-8 and TEX-2 [double knock-out: DKO (pdzd-8; tex-2)], expressing NMY-2-tagged with GFP (NMY-2::GFP). Images of each row are from time-lapse movies of the same embryos at different phases as indicated. Note the presence of ectopic NMY-2::GFP puncta, indicated by yellow arrowheads, in QKO and DKO embryos compared to a WT embryo. Scale bars, 10 μm. b Time-course analysis of the total fluorescence intensity of NMY-2::GFP puncta during polarity establishment (0–6 min), mitosis (6–10 min), and cytokinesis (10–13 min) phases for WT, QKO, and DKO early embryos as shown in (a) [mean ± SEM, n = 11 embryos (WT), n = 13 embryos (QKO), n = 10 embryos (DKO)]. c Quantification of the total fluorescence intensity of NMY-2::GFP puncta per minute during early embryogenesis (0–13 min). Comparisons between WT, QKO, and DKO early embryos are shown [mean ± SEM, n = 11 embryos (WT), n = 13 embryos (QKO), n = 10 embryos (DKO); Dunnett’s multiple comparisons test, *p = 0.0171 (QKO), *p = 0.0417 (DKO)]. d Quantification of the number of NMY-2::GFP puncta per minute during early embryogenesis (0–13 min). Comparisons between WT, QKO, and DKO early embryos are shown [mean ± SEM, n = 11 embryos (WT), n = 13 embryos (QKO), n = 10 embryos (DKO); Dunnett’s multiple comparisons test, *p = 0.0123 (QKO), *p = 0.0113 (DKO)].
Fig. 4
Fig. 4. Simultaneous depletion PDZD-8, TEX-2, and PI(4,5)P2 phosphatases results in massive accumulation of endosomal PI(4,5)P2 and cytokinetic defects.
a Representative live spinning disc confocal (SDC) images of equatorial planes of early embryos from OCRL-1 RNAi-treated unc-26 mutants and OCRL-1 RNAi-treated unc-26; double knock-out [DKO (pdzd-8; tex-2)] mutants, co-expressing PI(4,5)P2 biosensor (mCherry::PHPLCδ1) and NMY-2-tagged with GFP (NMY-2::GFP). Images of each row are from time-lapse movies of the same embryos at different phases as indicated. Yellow arrowheads in the polarity establishment phase indicate PI(4,5)P2-positive vesicles that are co-localized with NMY-2::GFP. Yellow dotted lines in mitosis and cytokinesis phases indicate clustering of PI(4,5)P2-positive vesicles. The red arrowhead shows a cleavage furrow that eventually retracts. Scale bars, 10 μm. b, c Time-course analysis of the total fluorescence intensity of b mCherry::PHPLCδ1 and c NMY-2::GFP during polarity establishment (0–6 min), mitosis (6–10 min), and cytokinesis (10–13 min) phases for OCRL-1 RNAi-treated unc-26 mutants and OCRL-1 RNAi-treated unc-26; DKO mutants early embryos as shown in (a) [mean ± SEM, n = 14 embryos (unc-26; ocrl-1 RNAi), n = 14 embryos (unc-26; DKO; ocrl-1 RNAi)]. d Histogram showing the size distribution of cytoplasmic PI(4,5)P2 structures from early embryos as indicated. Gaussian distribution curve is superimposed on the histogram [n = 138 structures (unc-26; ocrl-1 RNAi), n = 190 structures (unc-26; DKO; ocrl-1 RNAi)]. e Time-lapse SDC images of a representative PI(4,5)P2-positive vesicle from an early embryo from OCRL-1 RNAi-treated unc-26; DKO mutants, co-expressing mCherry::PHPLCδ1 and NMY-2::GFP, over the period of 30 sec. White arrowheads indicate the positions of a PI(4,5)P2-enriched vesicle that transiently recruits NMY-2::GFP (5, 10, and 15 s). Scale bar, 1 μm. f Quantification of the ratio of PI(4,5)P2 levels in the cytoplasm (including PI(4,5)P2-positive vesicles) to PI(4,5)P2 levels in the plasma membrane (PM) at the stage prior to cytokinesis, as assessed by mCherry::PHPLCδ1, in early embryos from OCRL-1 RNAi-treated wild-type control (WT) animals, OCRL-1 RNAi-treated unc-26 mutants, and OCRL-1 RNAi-treated unc-26; DKO mutants [mean ± SEM, n = 11 embryos (WT; ocrl-1 RNAi), n = 20 embryos (unc-26; ocrl-1 RNAi), n = 28 embryos (unc-26; DKO; ocrl-1 RNAi); Dunnett’s multiple comparisons test, **p = 0.0021, ns denotes not significant]. g Time-lapse montages of equatorial planes of early embryos from indicated mutants. Note the failure of cytokinesis in early embryos from OCRL-1 RNAi-treated unc-26; DKO mutants. Scale bars, 10 μm. h Quantification of the first embryonic cell divisions in early embryos from indicated conditions [n = 11 embryos (WT; ocrl-1 RNAi), n = 30 embryos (unc-26; ocrl-1 RNAi), n = 28 embryos (unc-26; DKO; ocrl-1 RNAi)].
Fig. 5
Fig. 5. Simultaneous depletion of PDZD-8, TEX-2, and PI(4,5)P2 phosphatases results in reduced cortical ruffling and embryonic lethality.
a Representative live spinning disc confocal (SDC) images of equatorial planes of early embryos from OCRL-1 RNAi-treated wild-type control (WT) animals, OCRL-1 RNAi-treated unc-26 mutants and OCRL-1 RNAi-treated unc-26; double knock-out [DKO (pdzd-8; tex-2)] mutants, expressing PI(4,5)P2 biosensor (mCherry::PHPLCδ1). Images of each row are from time-lapse movies of the same embryos at different phases as indicated. Cartoons depicting the outline of the embryos. Red arrowheads indicate cortical ruffling. Note the loss of cortical ruffling in OCRL-1 RNAi-treated unc-26; DKO mutants, during the polarity establishment phase. Scale bars, 10 μm. b Quantification of cortical ruffling. The cortical ruffling index was calculated by taking the ratio of the perimeter of the plasma membrane of embryos from polarity establishment phase and mitosis phase, as assessed in (a) (see Methods) [mean ± SEM, n = 11 embryos (WT; ocrl-1 RNAi), n = 17 embryos (unc-26; ocrl-1 RNAi), n = 26 embryos (unc-26; DKO; ocrl-1 RNAi); Dunnett’s multiple comparisons test, **p < 0.0001 (unc-26; DKO; ocrl-1 RNAi), ns denotes not significant]. c Quantification of the number of eggs laid by OCRL-1 RNAi-treated WT animals, OCRL-1 RNAi-treated unc-26 mutants and OCRL-1 RNAi-treated unc-26; DKO mutants [mean ± SEM, n = 10 animals for all conditions; Dunnett’s multiple comparisons test, **p < 0.0001 (unc-26; ocrl-1 RNAi), **p < 0.0001 (unc-26; DKO; ocrl-1 RNAi)]. d Quantification of the percentage of eggs successfully hatched in indicated conditions as in (c) [mean ± SEM, n = 10 animals for all conditions; Dunnett’s multiple comparisons test, *p = 0.0182 (unc-26; ocrl-1 RNAi), **p < 0.0001 (unc-26; DKO; ocrl-1 RNAi)].
Fig. 6
Fig. 6. PDZD-8 localizes to ER-late endosome contacts.
a Left: A representative live spinning disc confocal (SDC) image of an equatorial plane of an early embryo from wild-type animals, co-expressing endoplasmic reticulum (ER) marker (GFP::C34B2.10) and late endosome (LE) marker, endogenous RAB-7-tagged with mCherry (mCherry::RAB-7). The image is from the polarity establishment phase. Right: Magnified insets, showing Rab-7 positive LEs wrapped around by the ER, that are outlined by indicated white dotted boxes. Scale bar, 10 μm. b Left: A representative live SDC image of an equatorial plane of an early embryo from wild-type animals, co-expressing endogenous PDZD-8-tagged with mNeonGreen (PDZD-8::mNeonGreen) and LE marker (mCherry::RAB-7). The image is from the polarity establishment phase. Right: Magnified insets, showing distinct PDZD-8::mNeonGreen puncta present on Rab-7 positive LEs, that are outlined by indicated white dotted boxes. White arrowheads indicate PDZD-8::mNeonGreen puncta that are present on LEs. Scale bar, 10 μm. c Time-lapse SDC images of a representative Rab-7 positive LE from an early embryo, co-expressing PDZD-8::mNeonGreen and mCherry::RAB-7 (both at endogenous expression levels), over the period of 55 s. White arrowheads indicate PDZD-8::mNeonGreen puncta that is transiently associated with a LE. Scale bar, 10 μm.
Fig. 7
Fig. 7. The SMP domain of PDZD-8 transports various PIPs, including PI(4,5)P2, between membranes in vitro and plays a critical role for endosomal PI(4,5)P2 homeostasis in vivo.
a Schematic of the PI(4,5)P2 transfer assay in vitro. Donor liposomes [4% phosphoinositides (PIPs), 2% Rhodamine-PE, 94% DOPC] and acceptor liposomes [100% DOPC] (0.6 mM total lipids) were incubated with purified NBD-PHFAPP proteins (0.5 μM) and purified SMPPDZD-8 proteins. Dequenching of NBD fluorescence signals that corresponds to the transfer of PI(4,5)P2 from donor to acceptor liposomes were monitored using a fluorometer (see Methods). b PI(4,5)P2 transfer from donor to acceptor liposomes by purified SMPPDZD-8 proteins (8 μM). The dashed line corresponds to the condition that mimics full PI(4,5)P2 equilibration between donor and acceptor liposomes. c The protein concentration dependence of the initial PI(4,5)P2 transport rates of SMPPDZD-8. The trend line shows a linear fit of the data points [mean ± SEM, n = 6 independent experiments for each condition]. d Quantification of PIP transport rates of SMPPDZD-8 (8 μM) [mean ± SEM, n = 3 independent experiments for each condition; Dunnett’s multiple comparisons test, **p = 0.0056 (PI(4,5)P2 vs. PI(3,4,5)P3); ns denotes not significant]. e Left: Representative live spinning disc confocal (SDC) images of equatorial planes of early embryos from tex-2; tmem-24; esyt-2 mutants carrying indicated alleles of pdzd-8, expressing NMY-2-tagged with GFP (NMY-2::GFP). Images are from polarity establishment phase. Scale bars, 10 μm. Right: Quantification of the total fluorescence intensity of NMY-2::GFP puncta per minute during polarity establishment of the early embryogenesis [mean ± SEM, n = 10 embryos (pdzd-8 WT), n = 10 embryos (pdzd-8 KO), n = 11 embryos (pdzd-8 ΔSMP), n = 11 embryos (pdzd-8 [L98W, I252W]); Dunnett’s multiple comparisons test, **p = 0.0075 (pdzd-8 KO), **p = 0.0027 (pdzd-8 ΔSMP), *p = 0.0474 (pdzd-8 [L98W, I252W])]. f Left: Representative live SDC images of equatorial planes of early embryos from OCRL-1 RNAi-treated unc-26 mutants, OCRL-1 RNAi-treated unc-26; quadruple knock-out [QKO (pdzd-8; tex-2; tmem-24; esyt-2)] mutants and OCRl-1 RNAi-treated unc-26; pdzd-8 (ΔSMP); tex-2 (ΔSMP); tmem-24; esyt-2 mutants expressing PI(4,5)P2 biosensor (mCherry::PHPLCδ1). Images of each row are from time-lapse movies of the same embryos at different phases as indicated. Yellow dotted lines in mitosis and cytokinesis phases indicate clustering of PI(4,5)P2-positive vesicles. Scale bars, 10 μm. Right: Quantification of the ratio of PI(4,5)P2 levels in cytoplasm (including PI(4,5)P2-positive vesicles) to PI(4,5)P2 levels in the plasma membrane (PM) at the stage prior to cytokinesis, as assessed by mCherry::PHPLCδ1, in early embryos from indicated conditions [mean ± SEM, n = 10 embryos (unc-26; ocrl-1 RNAi), n = 9 embryos (unc-26; QKO; ocrl-1 RNAi), n = 10 embryos (unc-26; pdzd-8 (ΔSMP); tex-2 (ΔSMP); tmem-24; esyt-2; ocrl-1 RNAi); Dunnett’s multiple comparisons test, **p = 0.0026 (unc-26; QKO; ocrl-1 RNAi), **p = 0.0017 (unc-26; pdzd-8 (ΔSMP); tex-2 (ΔSMP); tmem-24; esyt-2; ocrl-1 RNAi)].
Fig. 8
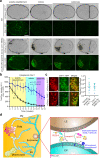
Fig. 8. Simultaneous depletion of PDZD-8, TEX-2, and PI(4,5)P2 phosphatases disrupts the degradative capacity of endosomes.
a Representative live spinning disc confocal (SDC) images of equatorial planes of early embryos from wild-type control (WT) and OCRL-1 RNAi-treated unc-26; double knock-out [DKO (pdzd-8; tex-2)] mutants, co-expressing PI(4,5)P2 biosensor (mCherry::PHPLCδ1) and CAV-1-tagged with GFP (CAV-1::GFP). Images of each row are from time-lapse movies of the same embryos at different phases as indicated. Yellow dotted lines in mitosis and cytokinesis phases indicate clustering of PI(4,5)P2-positive vesicles and CAV-1::GFP. Scale bars, 10 μm. b Time-course analysis of the total fluorescence intensity of cytoplasmic CAV-1::GFP during polarity establishment (0–6 min), mitosis (6–10 min), and cytokinesis (10–13 min) phases for WT and OCRL-1 RNAi-treated unc-26; DKO mutant early embryos as shown in (a) [mean ± SEM, n = 10 embryos (WT), n = 9 embryos (unc-26; DKO; ocrl-1 RNAi)]. c Left: Live SDC images of representative PI(4,5)P2-positive vesicles and RAB-7-positive late endosomes (LEs) from OCRL-1 RNAi-treated unc-26; DKO mutants, co-expressing CAV-1::GFP and either PI(4,5)P2 biosensor (mCherry::PHPLCδ1) or LE marker (mCherry::RAB-7). Scale bars, 1 μm. Right: Quantification of the association of CAV-1::GFP with either PI(4,5)P2-positive vesicles or RAB-7-positive LEs in OCRL-1 RNAi-treated unc-26; DKO mutants as indicated [mean ± SD, n = 15 embryos (PI(4,5)P2), n = 13 embryos (LE); Manders’ coefficient]. d Hypothetical model of how PDZD-8 and TEX-2 may maintain the distribution of PI(4,5)P2 in cellular membranes. PI(4,5)P2 is normally enriched in the plasma membrane (PM). PDZD-8 and TEX-2 localize to the endoplasmic reticulum (ER), and PDZD-8 also localizes to ER-LE contacts. PDZD-8 may regulate endosomal PI(4,5)P2 levels by transporting PI(4,5)P2 from late endosomes to the ER via its SMP domain at ER-late endosome contacts, although we do not have direct evidence supporting this vectorial transport in the current study. It is also plausible that PDZD-8 may primarily act as a tethering factor for ER-LE contacts. ER-anchored PI(4,5)P2 phosphatases, such as INPP5K, may participate in dephosphorylating PI(4,5)P2 and prevent PI(4,5)P2 from accumulating on ER membranes. TEX-2 acts redundantly with PDZD-8 to regulate endosomal PI(4,5)P2 levels, whose function also depends on the SMP domain. TEX-2 may transiently populate ER-LE contacts. PI(4,5)P2 phosphatases, including OCRL-1 and UNC-26/synaptojanin, work together with PDZD-8 and TEX-2 to prevent the build-up of PI(4,5)P2 in the endosomal systems.

Similar articles

Cited by

References

    1. van Meer G, Voelker DR, Feigenson GW. Membrane lipids: where they are and how they behave. Nat. Rev. Mol. Cell Biol. 2008;9:112–124. doi: 10.1038/nrm2330. - DOI - PMC - PubMed
    1. Di Paolo G, De Camilli P. Phosphoinositides in cell regulation and membrane dynamics. Nature. 2006;443:651–657. doi: 10.1038/nature05185. - DOI - PubMed
    1. Balla T. Phosphoinositides: tiny lipids with giant impact on cell regulation. Physiol. Rev. 2013;93:1019–1137. doi: 10.1152/physrev.00028.2012. - DOI - PMC - PubMed
    1. Tan X, Thapa N, Choi S, Anderson RA. Emerging roles of PtdIns(4,5)P2–beyond the plasma membrane. J. Cell Sci. 2015;128:4047–4056. doi: 10.1242/jcs.175208. - DOI - PMC - PubMed
    1. Liu J, Fairn GD, Ceccarelli DF, Sicheri F, Wilde A. Cleavage furrow organization requires PIP(2)-mediated recruitment of anillin. Curr. Biol. 2012;22:64–69. doi: 10.1016/j.cub.2011.11.040. - DOI - PubMed

Publication types

MeSH terms