. 2022 May;530(7):945-962.
doi: 10.1002/cne.25261. Epub 2021 Oct 25.

Development of astrocyte morphology and function in mouse visual thalamus

Affiliations

Development of astrocyte morphology and function in mouse visual thalamus

Rachana D Somaiya et al. J Comp Neurol. 2022 May.

Abstract

The rodent visual thalamus has served as a powerful model to elucidate the cellular and molecular mechanisms that underlie sensory circuit formation and function. Despite significant advances in our understanding of the role of axon-target interactions and neural activity in orchestrating circuit formation in visual thalamus, the role of non-neuronal cells, such as astrocytes, is less clear. In fact, we know little about the transcriptional identity and development of astrocytes in mouse visual thalamus. To address this gap in knowledge, we studied the expression of canonical astrocyte molecules in visual thalamus using immunostaining, in situ hybridization, and reporter lines. While our data suggests some level of heterogeneity of astrocytes in different nuclei of the visual thalamus, the majority of thalamic astrocytes appeared to be labeled in Aldh1l1-EGFP mice. This led us to use this transgenic line to characterize the neonatal and postnatal development of these cells in visual thalamus. Our data show that not only have the entire cohort of astrocytes migrated into visual thalamus by eye-opening but they also have acquired their adult-like morphology, even while retinogeniculate synapses are still maturing. Furthermore, ultrastructural, immunohistochemical, and functional approaches revealed that by eye-opening, thalamic astrocytes ensheathe retinogeniculate synapses and are capable of efficient uptake of glutamate. Taken together, our results reveal that the morphological, anatomical, and functional development of astrocytes in visual thalamus occurs prior to eye-opening and the emergence of experience-dependent visual activity.

Keywords: astrocytes; dorsal lateral geniculate nucleus; retinogeniculate synapse; thalamus; ventral lateral geniculate nucleus.


Conflict of interest statement

Conflicts of interest disclosure: The authors have no conflicts of interest to declare.

Figures

Fig. 1.
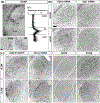
Fig. 1.. Expression of different astrocyte associated molecules in visual thalamus
(a) Immunostaining for GFAP in adult WT dLGN, IGL, and vLGN. Boxes provide higher magnification examples of GFAP immunoreactivity in dLGN and IGL. (a’) Line scan analysis for the expression of GFAP immunoreactivity in dLGN, IGL, and vLGN. Arbitrary fluorescence units (a.u.) are presented against distance from the dorsal part to the ventral region of the visual thalamus. Solid black line represents mean and shaded gray area represents SEM. (b-c) Immunostaining, ISH, and a genetic reporter line depict the expression of astrocyte genes and proteins in adult dLGN and vLGN. Scale bar in (a)=100μm, in high-mag (a)=20μm, and in (b-c)=100μm
Fig. 2.
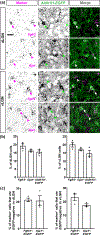
Fig. 2.. Fgfr3, Gja1, and Aldh1l1 are expressed by large subsets of astrocytes in visual thalamus
(a) ISH for Fgfr3 or Gja1 in the dLGN and vLGN of >P25 Aldh1l1-EGFP transgenic mice revealed most Fgfr3+ or Gja1+ cells overlap with Aldh1l1-EGFP+ cells (arrows). Only a few Fgfr3+ or Gja1+ cells did not coexpress EGFP (arrowheads). (b) Quantification of the percentage of DAPI+ cells that are Fgfr3+ or Gja1+ or Aldh1l1-EGFP+ in >P25 dLGN and vLGN. (c) Quantification of the percentage of Fgfr3+ or Gja1+ cells that do not express EGFP in >P25 dLGN and vLGN. Each data point in (b-c) represents one biological replicate and data is shown as mean ± SEM. Scale bar in (a)=20μm
Fig. 3.
Fig. 3.. Fgfr3 and Gja1 are not expressed by microglia or neurons in visual thalamus
(a) ISH for Fgfr3 or Gja1 in the dLGN and vLGN of >P25 Cx3cr1-GFP transgenic mice revealed no expression of Fgfr3 or Gja1 by GFP+ microglia. (b) ISH for Fgfr3 or Gja1 in the dLGN and vLGN of >P25 C57/BL6 revealed no expression of Fgfr3 or Gja1 by Syt1+ neurons. Scale bar in (a-b)=20μm
Fig. 4.
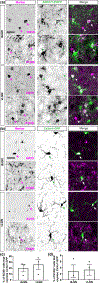
Fig. 4.. Expression of SOX9 and S100ß by astrocytes and microglia in visual thalamus
(a) IHC for SOX9 or S100ß in the dLGN and vLGN of >P25 Aldh1l1-EGFP transgenic mice revealed two observations: SOX9 or S100ß expression in Aldh1l1-EGFP+ astrocytes (arrows), and SOX9 or S100ß protein in cells not labelled in Aldh1l1-EGFP mice (arrowheads). (b) IHC for SOX9 or S100ß in the dLGN and vLGN of >P25 Cx3cr1-GFP transgenic mice revealed expression of SOX9 or S100ß by GFP+ microglial cells (arrows). (c) Quantification of the percentage of SOX9+/GFP+ or S100ß+/GFP+ cells in >P25 Cx3cr1-GFP dLGN and vLGN. Each data point in (c) represents one biological replicate and data is shown as mean ± SEM. Scale bar for (a-b)=20μm.
Fig. 5.
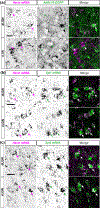
Fig. 5.. Expression of Hevin by neurons in both dLGN and vLGN
(a) ISH for Hevin in the dLGN and vLGN of >P25 Aldh1l1-EGFP transgenic mice revealed sparse expression of Hevin by EGFP+ astrocytes (arrows). Most Hevin+ cells did not coexpress EGFP in these mice (arrowheads). (b-c) ISH for Hevin in the dLGN and vLGN of >P25 WT mice revealed significant expression of Hevin in Syt1+ (b) or Syt2+ (c) neurons (arrows). Scale bar for (a-c)=20μm.
Fig. 6.
Fig. 6.. Fgfr3, Gja1, and WFA are reliable markers for astrocytes in the developing visual thalamus
(a) Quantification of the percentage of DAPI+ cells that are Fgfr3+ or Gja1+ or Aldh1l1-EGFP+ in P3 dLGN and vLGN. Each data point represents one biological replicate and data is shown as mean ± SEM. (b-c) ISH of Fgfr3 or Gja1 in the dLGN (b) and vLGN (c) of P3 Aldh1l1-EGFP transgenic mice revealed Fgfr3+ or Gja1+ cells overlap with Aldh1l1-EGFP+ cells (arrows). (d) ISH of Gja1 with IHC of IBA1 in the P4 C57/BL6 dLGN and vLGN revealed no expression of Gja1 by microglia. (e) ISH of Gja1 in the dLGN and vLGN of P4 C57/BL6 revealed no expression of Gja1 by Syt1+ neurons. (f) Low magnification example of WFA staining in the dLGN of P3 Aldh1l1-EGFP mice. (g-h) Immunostaining for WFA in the dLGN and vLGN of P3 (g) and P26 (h) Aldh1l1-EGFP mice. Scale bar in (b-e)=20μm, (f)=50μm, and (g-h)=20μm
Fig. 7.
Fig. 7.. Distribution of Aldh1l1-EGFP+ astrocytes in the developing visual thalamus
(a) Distribution of EGFP+ cells in the dLGN and vLGN of neonatal and postnatal Aldh1l1-EGFP mice (b-c) Age-related changes in EGFP+ astrocyte number per section of the dLGN (b) and vLGN (c) of Aldh1l1-EGFP mice. (d-e) Age-related changes in size of the dLGN (b) and vLGN (c) of Aldh1l1-EGFP mice. (f-g) Age-related changes in the density of EGFP+ astrocytes in the dLGN (b) and vLGN (c) of Aldh1l1-EGFP mice. Each data point in (b-g) represents one biological replicate and data is shown as mean ± SEM. Asterisks (*) represent significance (****p<0.0001,***p<0.001, **p<0.01,*p<0.05, ns=not significant) by one-way ANOVA. Scale bar for (a)=100μm.
Fig. 8.
Fig. 8.. Morphological development of astrocytes in visual thalamus
(a) High magnification images showing the morphology of EGFP+ astrocytes in the dLGN of Aldh1l1-EGFP mice at different ages. (b) Quantification of the percentage of dLGN area covered by EGFP fluorescence. Each data point represents one biological replicate and data is shown as mean ± SEM. Asterisks (*) represent significance (****p<0.0001,***p<0.001, **p<0.01,*p<0.05, ns=not significant) by one-way ANOVA (c) Morphology of tdT+ astrocytes in the dLGN and vLGN of mGfap-Cre::ROSA-Stop-tdT mice. Scale bar in (a)=10μm, in (c) (i-vi)=100μm, and in high magnification images in (c)=20μm
Fig. 9.
Fig. 9.. Astrocytic processes enwrap RG synapses in dLGN by eye-opening
(a-b) Immunostaining for VGLUT2 in the dLGN of P14 (eye-opening) (a) and P26 (b) Aldh1l1-EGFP mice. Arrows show examples of close proximity of VGLUT2+ retinal terminals to EGFP+ astrocytic processes. Insets depict the high magnification of these locations. (c-f) SBFSEM revealed complete encapsulation of simple (c-d) and complex (e-f) RG synapses by astrocytic processes in the dLGN of P14 (c, e) and P42 (d, f) mice. At the bottom of each are color legends to identify different cellular components of each synapse. Scale bar in (a-b)=10μm and (c-f)=0.5μm.
Fig. 10.
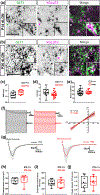
Fig. 10.. Astrocytic GLT1 is functionally capable of clearing glutamate spillover in dLGN by eye-opening
(a-b) Immunostaining for GLT1 in the dLGN of P14 (a) and P26 (b) mice. Arrows show examples of close proximity of VGLUT2+ retinal terminals to GLT1. Insets depict the high magnification of these locations. (c) Resting membrane potential of GFP+ astrocytes in the dLGN of Aldh1l1-EGFP mice (n=16 cells for P14; n=13 cells for >P60). (d) Membrane capacitance of GFP+ astrocytes in the dLGN of Aldh1l1-EGFP mice (n=17 cells for P14; n=19 cells for >P60). (e) Input resistance of GFP+ astrocytes in the dLGN of Aldh1l1-EGFP mice (n=27 cells for P14; n=12 cells for >P60). (f) Representative voltage clamp traces (left and center), and I-V plot (right) of GFP+ astrocytes on applying step currents of different polarity and magnitude showing passive changes in current. (g) Glutamate uptake currents of GFP+ astrocytes in the dLGN of Aldh1l1-EGFP mice. Dark traces represent the mean current and associated gray areas present the standard deviation of the mean currents (n=8 cells from P14; n=5 cells for >P60). (h) Glutamate uptake peak current in GFP+ astrocytes in the dLGN of Aldh1l1-EGFP mice after applying glutamate puffs. (n=9 cells for P14; n=6 cells for >P60). (i) Glutamate uptake current’s decay time in GFP+ astrocytes in the dLGN of Aldh1l1-EGFP mice (n=9 cells for P14; n=6 cells for >P60). (j) Total charge transfer during puffed glutamate uptake in GFP+ astrocytes in the dLGN of Aldh1l1-EGFP mice (n=9 cells for P14; n=6 cells for >P60). Scale bar in (a-b)=20μm. Data in (c-e), and (h-j) are represented as box and whisker plots. The central lines in the box represent medians; the two ends of the rectangles represent first and third quartiles. The upper and lower whiskers extend to the highest and lowest values in the data set, respectively. Individual data points are represented by dots.

Similar articles

Cited by

References

    1. Adami C, Sorci G, Blasi E, Agneletti AL, Bistoni F, & Donato R (2001). S100B expression in and effects on microglia. Glia, 33(2), 131–142. 10.1002/1098-1136(200102)33:2&lt;131::AID-GLIA1012&gt;3.0.CO;2-D - DOI - PubMed
    1. Agius E, Soukkarieh C, Danesin C, Kan P, Takebayashi H, Soula C, & Cochard P (2004). Converse control of oligodendrocyte and astrocyte lineage development by Sonic hedgehog in the chick spinal cord. Developmental Biology, 270(2), 308–321. 10.1016/j.ydbio.2004.02.015 - DOI - PubMed
    1. Barnabé-Heider F, Göritz C, Sabelström H, Takebayashi H, Pfrieger FW, Meletis K, & Frisén J (2010). Origin of new glial cells in intact and injured adult spinal cord. Cell Stem Cell, 7(4), 470–482. 10.1016/j.stem.2010.07.014 - DOI - PubMed
    1. Bayraktar OA, Bartels T, Holmqvist S, Kleshchevnikov V, Martirosyan A, Polioudakis D, Ben Haim L, Young AMH, Batiuk MY, Prakash K, Brown A, Roberts K, Paredes MF, Kawaguchi R, Stockley JH, Sabeur K, Chang SM, Huang E, Hutchinson P, … Rowitch DH (2020). Astrocyte layers in the mammalian cerebral cortex revealed by a single-cell in situ transcriptomic map. Nature Neuroscience, 23(4), 500–509. 10.1038/s41593-020-0602-1 - DOI - PMC - PubMed
    1. Bayraktar OA, Fuentealba LC, Alvarez-Buylla A, & Rowitch DH (2015). Astrocyte development and heterogeneity. Cold Spring Harbor Perspectives in Biology, 7(1), 1–16. 10.1101/cshperspect.a020362 - DOI - PMC - PubMed

Publication types