. 2021 Oct;598(7880):359-363.
doi: 10.1038/s41586-021-03911-7. Epub 2021 Sep 29.

Structure-based classification of tauopathies

Affiliations

Structure-based classification of tauopathies

Yang Shi et al. Nature. 2021 Oct.

Abstract

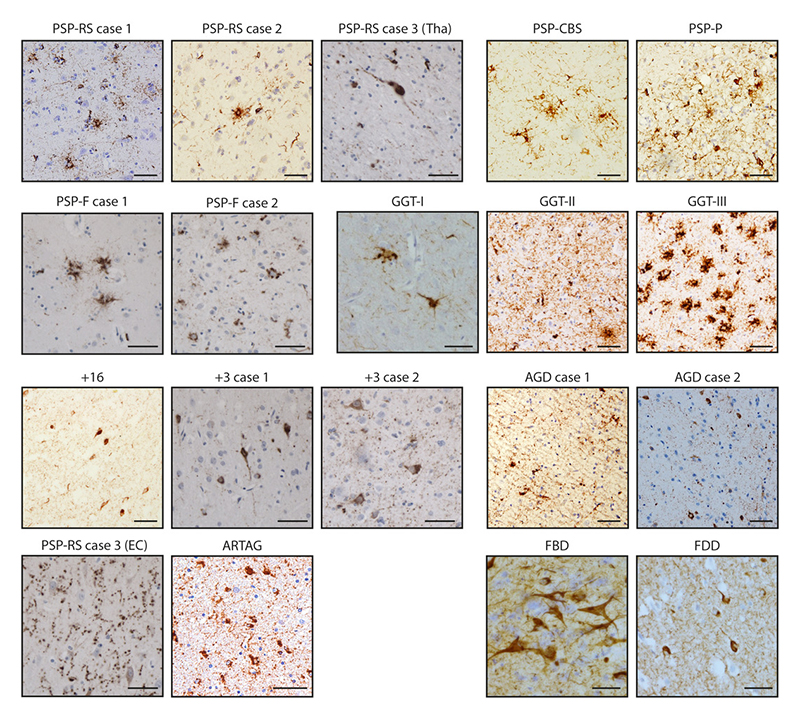
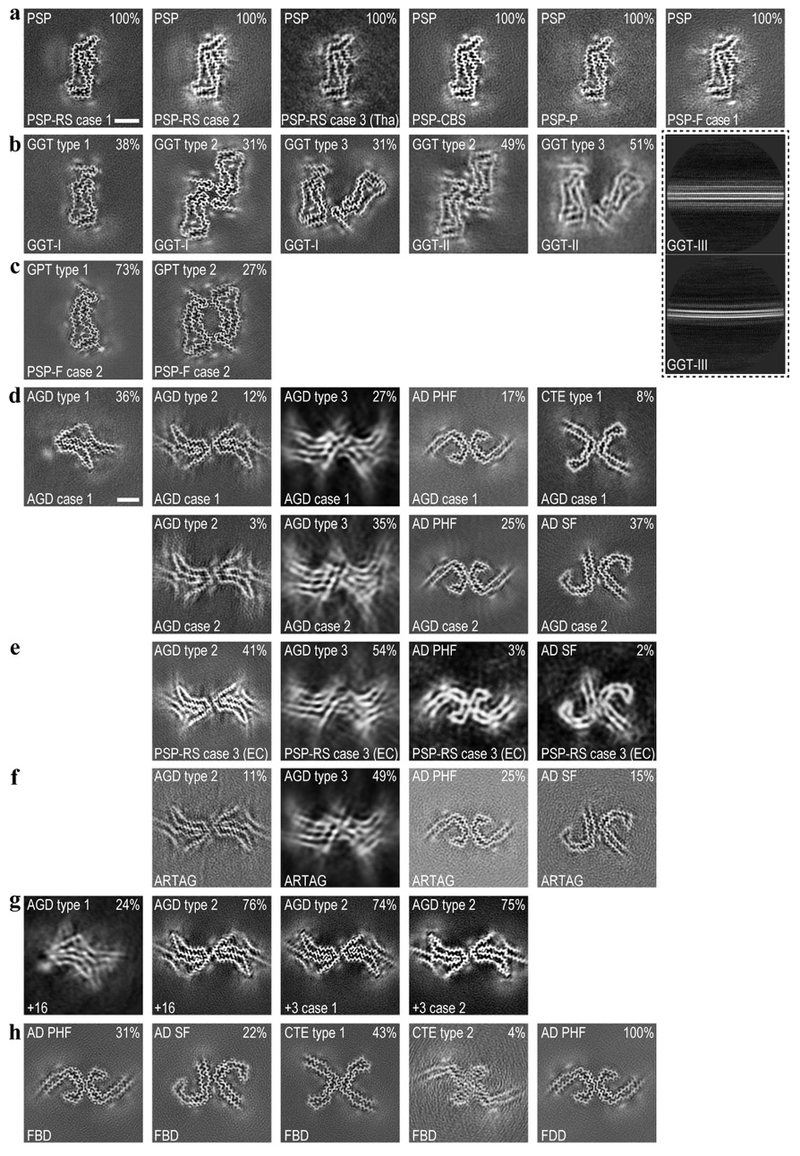
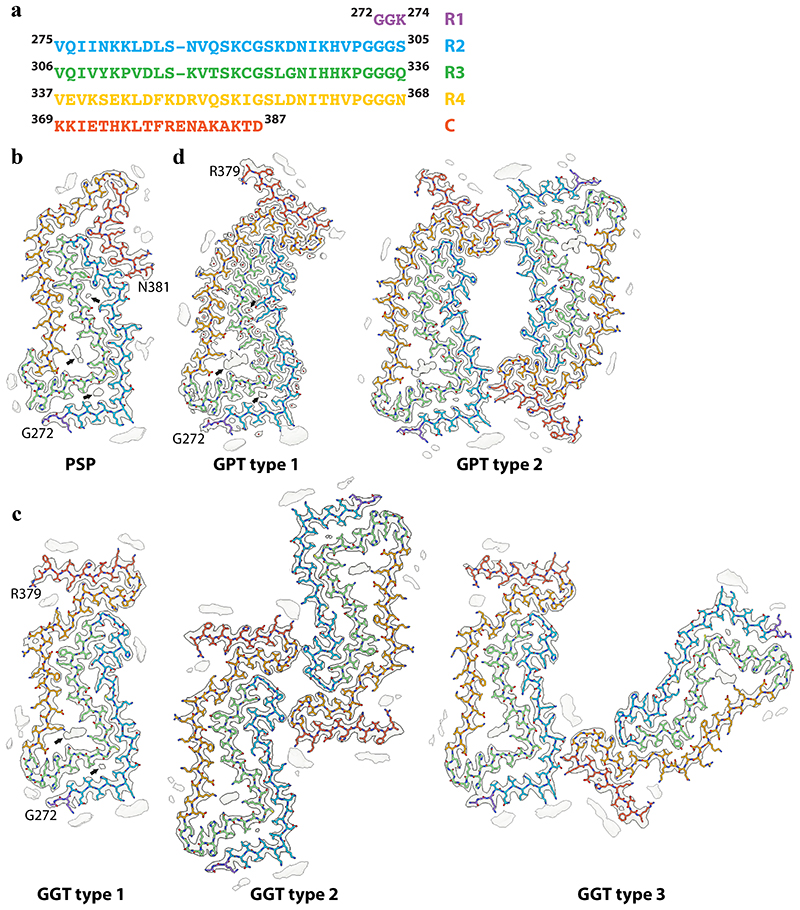
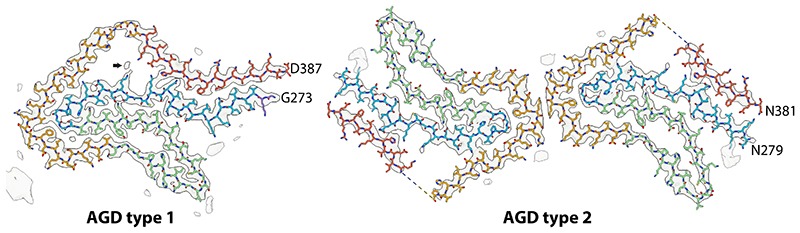
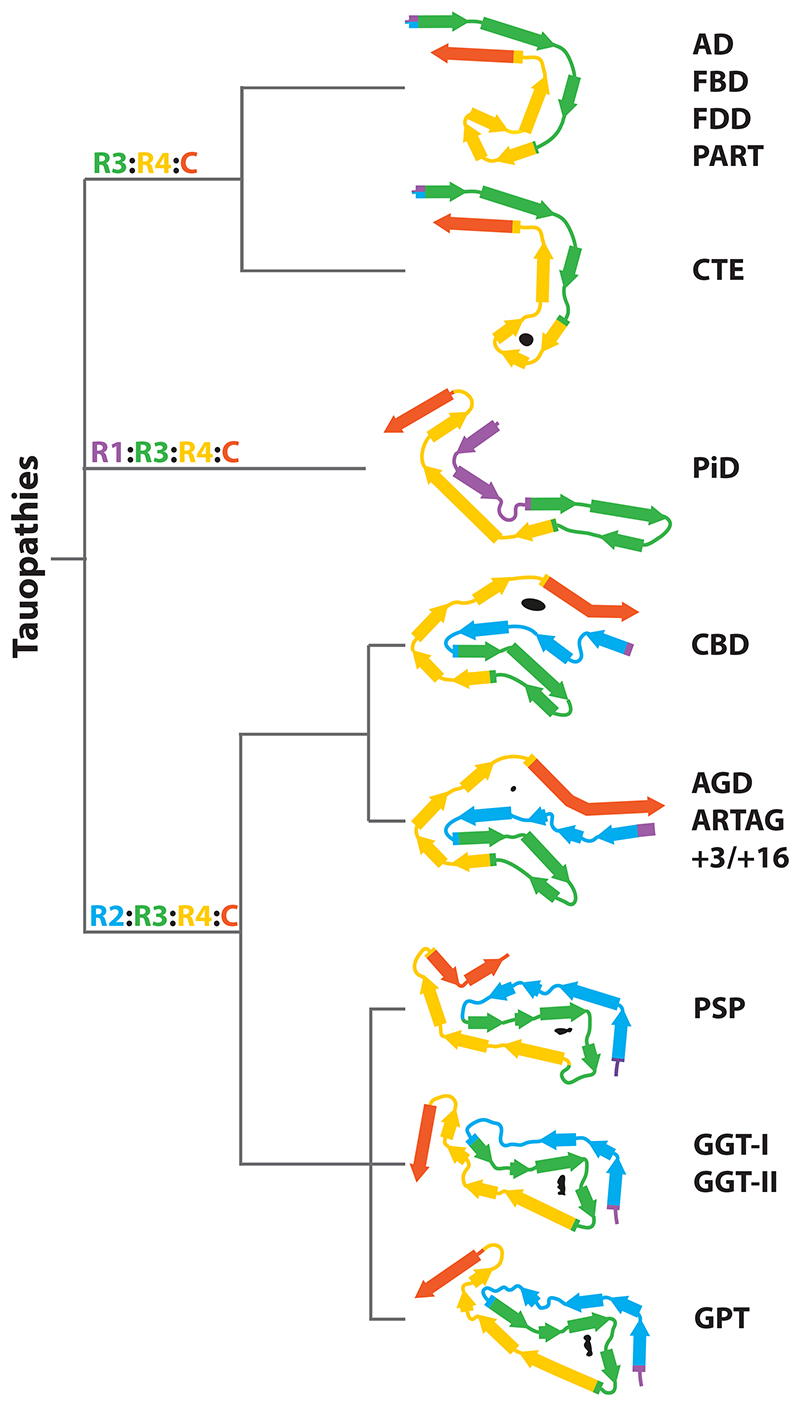
The ordered assembly of tau protein into filaments characterizes several neurodegenerative diseases, which are called tauopathies. It was previously reported that, by cryo-electron microscopy, the structures of tau filaments from Alzheimer's disease1,2, Pick's disease3, chronic traumatic encephalopathy4 and corticobasal degeneration5 are distinct. Here we show that the structures of tau filaments from progressive supranuclear palsy (PSP) define a new three-layered fold. Moreover, the structures of tau filaments from globular glial tauopathy are similar to those from PSP. The tau filament fold of argyrophilic grain disease (AGD) differs, instead resembling the four-layered fold of corticobasal degeneration. The AGD fold is also observed in ageing-related tau astrogliopathy. Tau protofilament structures from inherited cases of mutations at positions +3 or +16 in intron 10 of MAPT (the microtubule-associated protein tau gene) are also identical to those from AGD, suggesting that relative overproduction of four-repeat tau can give rise to the AGD fold. Finally, the structures of tau filaments from cases of familial British dementia and familial Danish dementia are the same as those from cases of Alzheimer's disease and primary age-related tauopathy. These findings suggest a hierarchical classification of tauopathies on the basis of their filament folds, which complements clinical diagnosis and neuropathology and also allows the identification of new entities-as we show for a case diagnosed as PSP, but with filament structures that are intermediate between those of globular glial tauopathy and PSP.


Conflict of interest statement

Competing interests. The authors declare no competing interests.

Figures

Extended Data Figure 1
Extended Data Figure 1. Tau immunohistochemistry
Representative tau staining of the brain regions used for cryo-EM structure determination (see Methods), using antibody AT8 (pS202/pT205 tau). Scale bars are 50 μm, except for GGT Type I, FBD and FDD, where they are 25 μm. For PSP-RS case 3, both the thalamus (Tha) and the entorhinal cortex (EC) are shown. Similar results were obtained using a minimum of six additional stained sections for each case.
Extended Data Figure 2
Extended Data Figure 2. Cryo-EM reconstructions
(a), Cryo-EM maps for tau filaments from six cases of PSP. For each map, a sum of the reconstructed density for several XY-slices is shown, corresponding to approximately 4.7 Å. The disease cases are referenced at the bottom of each image, the filament types at the top left and the percentages of a given filament type among the tau filaments in the data set at the top right. Scale bar 5 nm. The same scale applies to all panels, except (d-g) (b-h), As in (a), but a case of GGT-I and a case of GGT-II (b); a case diagnosed as PSP-F, but that contains filaments with the PGT fold (c); two cases of AGD (d); scale bar 5nm, the same scale applies to panels (d-g); entorhinal cortex of case PSP-RS3 (e); a case of ARTAG (f); three cases with mutations +16 or +3 in intron 10 of MAPT (g); a case of FBD and a case of FDD (h). Panels (d-f) contain blank squares to indicate the absence of AGD type I filaments in some cases. The inset with dashed lines shows 2D class average images of tau filaments from a case of GGT-III without apparent twist.
Extended Data Figure 3
Extended Data Figure 3. Cryo-EM resolution estimates
Fourier Shell Correlation (FSC) curves for cryo-EM maps and atomic structures of PSP filaments (from PSP-RS case 1); GGT filament types 1-3 (from GGT-I); GPT filament types 1a, 1b and 2 (from PSP-F case 2); and AGD filament types 1 and 2 (from AGD case 1 and the +16 case, repectively). FSC curves are shown for two independently refined cryo-EM half-maps (black); for the final refined atomic model against the final cryo-EM map (red); for the atomic model refined in the first half-map against that half-map (blue); and for the refined atomic model in the first half-map against the other half-map (yellow).
Extended Data Figure 4
Extended Data Figure 4. Schematics of tau filament folds
Schematics of the tau folds for PSP (a), GGT (b), GPT (c) and AGD (d). Negatively charged residues are shown in red, positively charged residues in blue, polar residues in green, apolar residues in white, sulfur-containing residues in yellow, prolines in purple and glycines in pink. Thick connecting lines with arrow heads are used to indicate β-strands; additional densities are shown in grey.
Extended Data Figure 5
Extended Data Figure 5. Tau pathology in Limbic-predominant Neuronal inclusion body 4R Tauopathy (LNT, PSP-F case 2)
a) Low power view of hippocampus stained with antibody AT8 (pS202/pT205 tau). b) Low power view of frontal cortex stained with AT8. c) Higher power view of hippocampus stained with AT8. d) AT8-positive globular astrocyte in hippocampus. e) AT8-positive neurons in hippocampus. f) Hippocampus stained with antibody RD4 (specific for 4R tau). g) Gallyas-Braak silver-positive neurons and glial cells in hippocampus. h) Hippocampus stained with antibody RD3 (specific for 3R tau). i) Higher power view of frontal cortex stained with AT8. j) AT8-positive globular astrocyte in frontal cortex. k) AT8-positive neurons in frontal cortex. l) Frontal cortex stained with RD4. m) Gallyas-Braak silver-positive neurons and glial cells in frontal cortex. n) Frontal cortex stained with RD3. Representative images are shown. Similar results were obtained using a minimum of six additional stained sections for each panel. Scale bars: 400 μm in (a); 200 μm in (b), 50 μm in (c, f, g, h, i, l, m, n); 10 μm in (d, e, j, k).
Extended Data Figure 6
Extended Data Figure 6. Structural comparisons
a) Comparison of two different main-chain conformations for GPT type 1 filaments (type 1a in purple; type 1b in green) and the main-chain conformation of GPT type 2 filaments (red). b) Comparison of the PSP (orange), GGT (blue) and GPT (purple) folds. c) Comparison of the inter-protofilament interfaces of GGT type 3 and GPT type 2 filaments. d) Comparison of the AGD type 1 (light blue), AGD type 2 (pink) and CBD (grey) folds.
Extended Data Figure 7
Extended Data Figure 7. Argyrophilic grains in the entorhinal cortex
Representative tau staining with antibodies RD4 (4R tau), RD3 (3R tau), AT8 (pS202/pT205 tau), as well as Gallyas-Braak silver, of the entorhinal cortex from cases 1 and 2 with mutation +3 in intron 10 of MAPT and from case 3 of PSP-RS. Similar results were obtained using a minimum of six additional stained sections for each case. Scale bar, 50 μm.
Extended Data Figure 8
Extended Data Figure 8. Immunoblot analysis of 4R tauopathies
Hyperphosphorylated full-length tau (64 and 68 kDa) and C-terminal fragments (33 kDa and 37 kDa) were detected in sarkosyl-insoluble fractions from the brain regions used for cryo-EM by anti-tau antibody T46. A prominent 33 kDa band was characteristic of PSP and GGT; strong 37 kDa bands were in evidence in AGD, ARTAG, cases with intron 10 mutations in MAPT (+3 and +16) and in CBD. PSP-RS case 3 had a strong 33 kDa band in thalamus (Tha) and strong 37 kDa bands in entorhinal cortex (EC), consistent with AGD co-pathology. Similar results were obtained in three independent experiments. The original, uncropped image is available in Supplementary Figure 1.
Figure 1
Figure 1. Three-layered 4R tau filament structures
(a), Amino acid sequence of tau residues 272-387. Residues in R1-4 and in the C-terminal domain are coloured purple, blue, green, gold and orange, respectively; (b), Cryo-EM density map (in transparent grey) and atomic model for the PSP filaments. (c), As in (b), for GGT type 1, GGT type 2 and GGT type 3 filaments; (d) As in (b), for GPT type 1 and GPT type 2 filaments. Black arrows point to additional densities that are described in the main text.
Figure 2
Figure 2. Four-layered 4R tau filament structures
Cryo-EM density map and atomic model for AGD type 1 filaments and AGD type 2 filaments. Colours are as in Figure 1. The black arrow points to additional density discussed in the main text. The dotted lines indicate main chain connectivity for which cryo-EM density is missing.
Figure 3
Figure 3. Structure-based Classification of Tauopathies
The dendrogram shows the proposed classification of tauopathies as described in the main text, with the corresponding folds displayed with the first β-strand in R3 oriented horizontally, except for the GGT and GPT folds, which are aligned to the PSP fold. Colours are as in Figure 1. Internal, non-proteinaceous densities are shown in black.

Comment in

Similar articles

Cited by

References

    1. Fitzpatrick AWP, et al. Cryo-EM structures of tau filaments from Alzheimer’s disease. Nature. 2017;547:185–190. - PMC - PubMed
    1. Falcon B, et al. Tau filaments from multiple cases of sporadic and inherited Alzheimer’s disease adopt a common fold. Acta Neuropathol. 126:699–708. - PMC - PubMed
    1. Falcon B, et al. Structures of filaments from Pick’s disease reveal a novel tau protein fold. Nature. 2018;561:137–140. - PMC - PubMed
    1. Falcon B, et al. Novel tau filament fold in chronic traumatic encephalopathy encloses hydrophobic molecules. Nature. 2019;568:420–423. - PMC - PubMed
    1. Zhang W, et al. Novel tau filament fold in corticobasal degeneration. Nature. 2020;580:283–287. - PMC - PubMed

Publication types

MeSH terms