. 2022 Jun;75(6):1386-1401.
doi: 10.1002/hep.32177. Epub 2021 Dec 6.

Integration of glucose and cardiolipin anabolism confers radiation resistance of HCC

Affiliations

Integration of glucose and cardiolipin anabolism confers radiation resistance of HCC

Yuan Fang et al. Hepatology. 2022 Jun.

Abstract

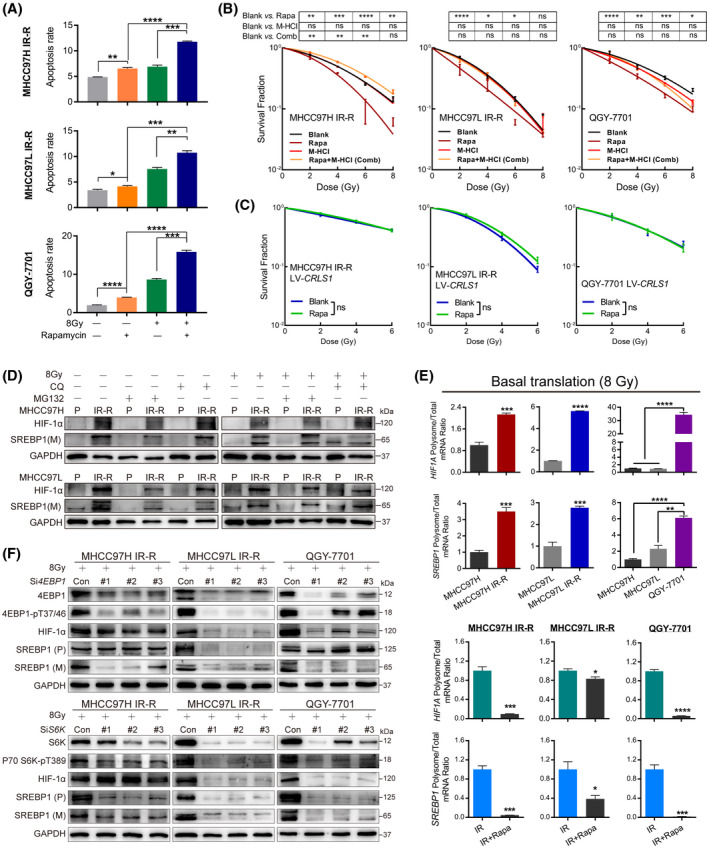
Background and aims: Poor response to ionizing radiation (IR) due to resistance remains a clinical challenge. Altered metabolism represents a defining characteristic of nearly all types of cancers. However, how radioresistance is linked to metabolic reprogramming remains elusive in hepatocellular carcinoma (HCC).

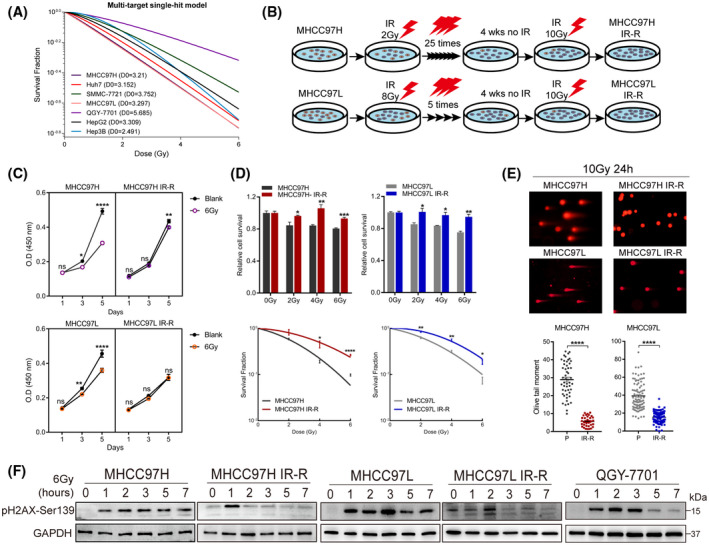
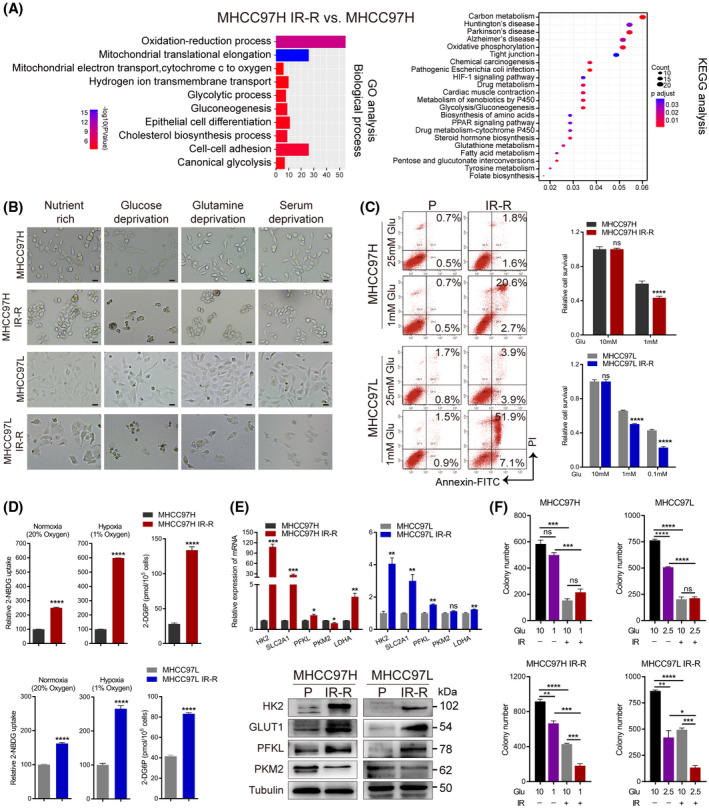
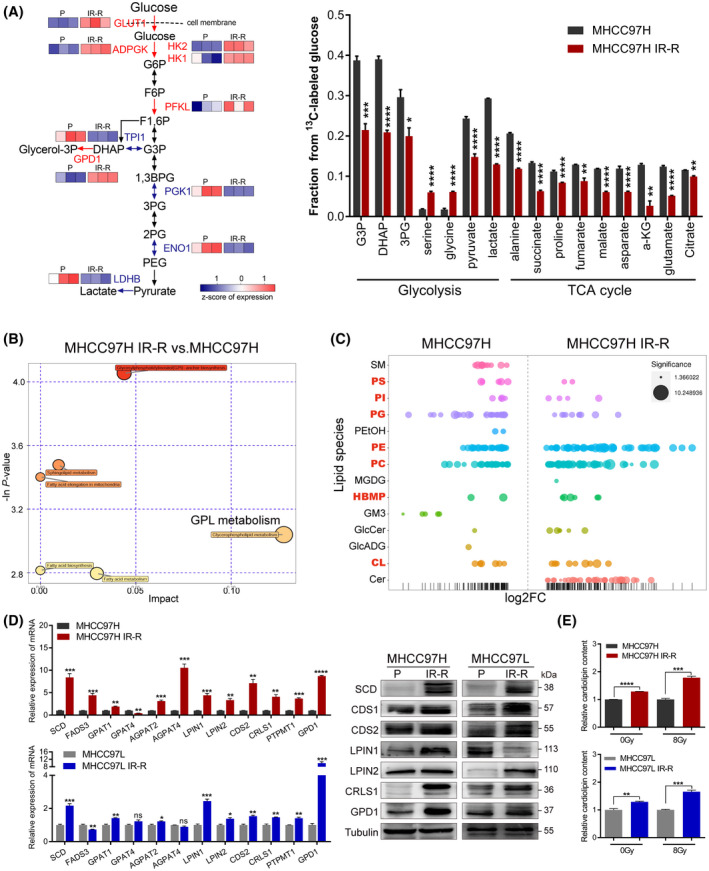
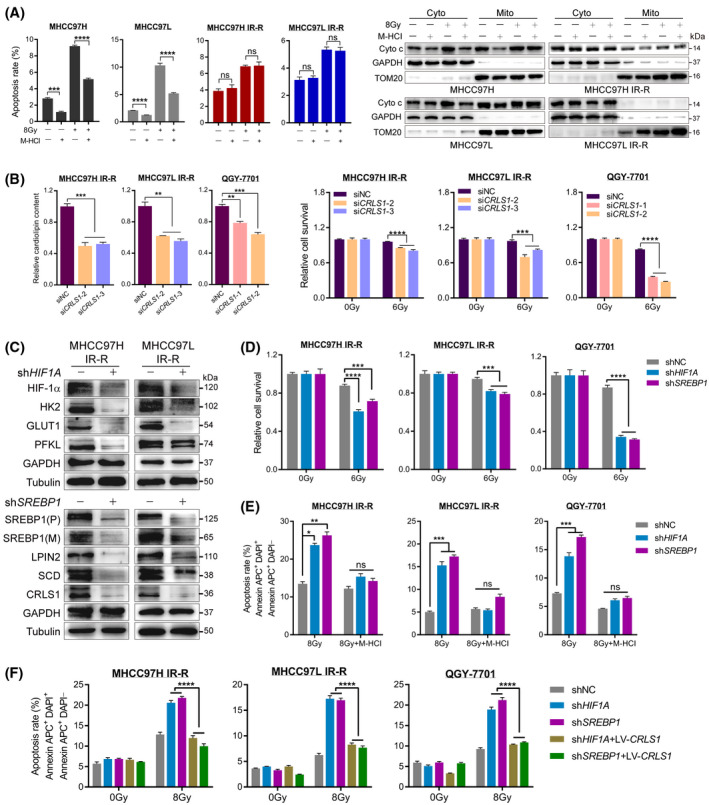
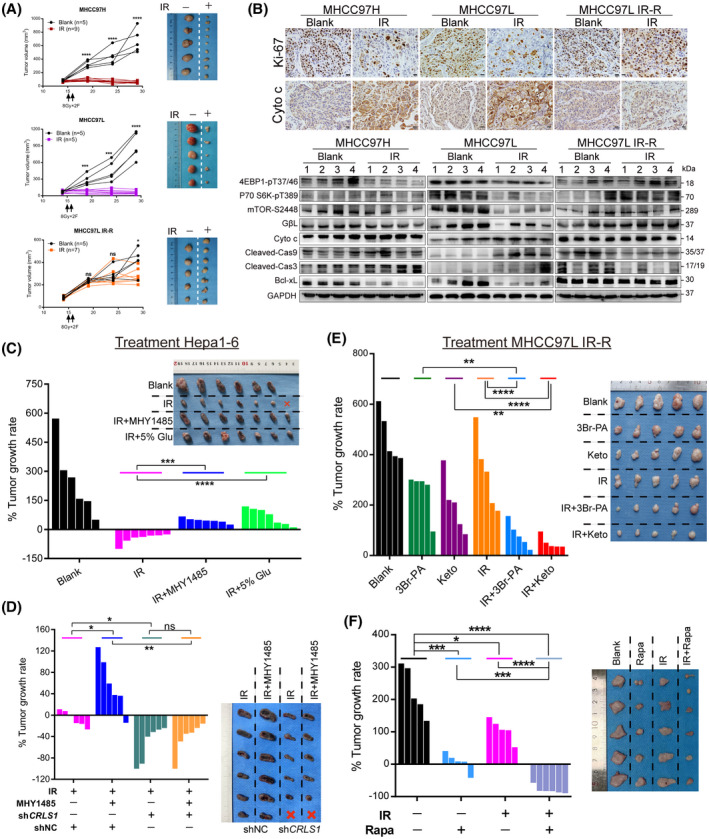
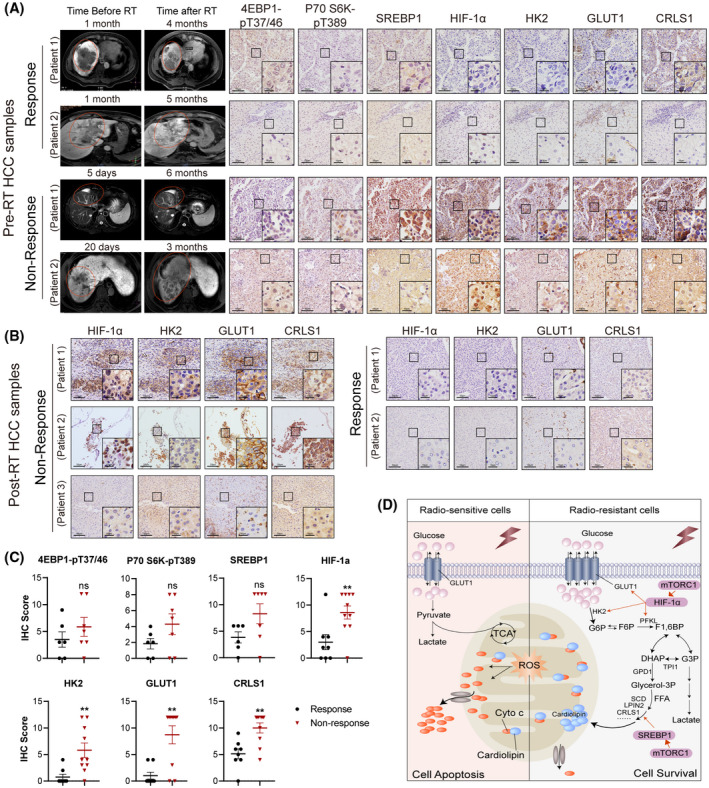
Approach and results: Baseline radiation responsiveness of different HCC cells were identified and cells with acquired radio-resistance were generated. By performing proteomics, metabolomics, metabolic flux, and other functional studies, we depicted a metabolic phenotype that mediates radiation resistance in HCC, whereby increased glucose flux leads to glucose addiction in radioresistant HCC cells and a corresponding increase in glycerophospholipids biosynthesis to enhance the levels of cardiolipin. Accumulation of cardiolipin dampens the effectiveness of IR by inhibiting cytochrome c release to initiate apoptosis. Mechanistically, mammalian target of rapamycin complex 1 (mTORC1) signaling-mediated translational control of hypoxia inducible factor-1α (HIF-1α) and sterol regulatory element-binding protein-1 (SREBP1) remodels such metabolic cascade. Targeting mTORC1 or glucose to cardiolipin synthesis, in combination with IR, strongly diminishes tumor burden. Finally, activation of glucose metabolism predicts poor response to radiotherapy in cancer patients.

Conclusions: We demonstrate a link between radiation resistance and metabolic integration and suggest that metabolically dismantling the radioresistant features of tumors may provide potential combination approaches for radiotherapy in HCC.


Conflict of interest statement

Nothing to disclose.

Figures

FIGURE 1
FIGURE 1
Response of HCC cell lines to IR and generation of radiation‐resistant sublines. (A) Surviving fractions of radiation colony formation of HCC cell lines exposed to the indicated doses of IR. (B) Schematic of the generation of sublines with acquired IR‐R. (C) Proliferation of control and IR‐R cells at 1, 3, or 5 days postexposure to 6 Gy IR by CCK8 assays. (D) Relative sensitivity of parental compared with IR‐R cells to increasing dose of IR as determined by MTT assays (72 h after IR) and colony formation assays. (E) Comet assays between parental and IR‐R cells postexposure to 10 Gy IR. (F) Western blots of pH2AX‐Ser139 levels in the indicated cell lines at 0, 1, 2, 3, 5, or 7 h following IR. Survival data were normalized to those of unirradiated control cells. Data are represented as mean ± SEM of at least three replicates. *p < 0.05, **p < 0.01, ***p < 0.001, ****p < 0.0001. Abbreviations: GAPDH, glyceraldehyde 3‐phosphate dehydrogenase; OD, optical density; P, parental; ns, not significant; wks, weeks [Color figure can be viewed at wileyonlinelibrary.com]
FIGURE 2
FIGURE 2
Increased glucose metabolism fuels radioresistance in HCC cells. (A) GO and KEGG enrichment analysis of the proteome profiles between MHCC97H parental and IR‐R cells. (B) Images of control and IR‐R cells cultured for 48 h in nutrient‐rich (10% FBS and 10 mM glucose), glucose‐deprived (10% FBS and 1 mM glucose), serum‐deprived (0.1% FBS and 10 mM glucose), or glutamine‐deprived (10% FBS and 10 mM glucose but no glutamine) DMEM. Scale bars, 100 μm. (C) Effect of glucose deprivation on apoptosis and cell survival as determined by annexin V and propidium iodide staining and MTT assays. Survival data were normalized to those of control cells cultured in 10 mM glucose. (D) Relative 2‐NBDG uptake (fluorescent glucose analogue) and 2‐deoxyglucose‐6‐phosphate content (reflects glucose analogue 2‐deoxyglucose uptake) in IR‐R and parental cells. Counts for 2‐NBDG uptake were normalized to the cell count in respective parental control cultured under normoxia or hypoxia. (E) Quantitative RT‐PCR and western blots of glycolytic genes. (F) Clonogenic survival of the indicated cells cultured in DMEM containing the indicated concentration of glucose with or without 6 Gy IR. Data are represented as mean ± SEM of at least three replicates. *p < 0.05, **p < 0.01, ***p < 0.001, ****p < 0.0001. Abbreviations: 2‐DG6P, 2‐deoxyglucose‐6‐phosphate; Glu, glucose; GO, gene ontology; KEGG, Kyoto Encyclopedia of Genes and Genomes; LDHA, lactate dehydrogenase A; 2‐NBDG, 2‐(N‐(7‐nitrobenz‐2‐oxa‐1,3‐diazol‐4‐yl) amino)‐2‐deoxy‐D‐glucose; ns, not significant; P, parental; PI, prodium iodide; PKM2, pyruvate kinase M2; SLC2A1, solute carrier family 2 member 1 [Color figure can be viewed at wileyonlinelibrary.com]
FIGURE 3
FIGURE 3
Increased glucose flux to CL anabolism in radioresistant HCC cells. (A) 13C‐labeled glycolytic and TCA metabolites as identified by gas chromatographic–mass spectrometric analysis and corresponding protein expression of indicated enzymes in glycolysis from proteomic analyses. Red indicates overexpressed enzymes in MHCC97H IR‐R cells, n = 3/group. (B) Metabolic pathway impact analysis of metabolites by Metaboanalyst 3.0 based on results of liquid chromatography–tandem mass spectrometry–based untargeted metabolomics, n = 3/group. (C) Relative expression levels of up‐regulated and down‐regulated lipid species displayed as log2 fold change in MHCC97H IR‐R compared to MHCC97H cells. Each spot represents a species of lipids, and the spot size indicates significance. Red indicates species of GPLs, n = 6/group. (D) Quantitative RT‐PCR and western blots of genes involved in CL synthesis. (E) Relative CL content in cells under basal conditions or at 24 h after 8 Gy IR as determined by ELISA. Data were calculated relative to respective untreated or 8 Gy‐treated controls. Data are represented as mean ± SEM of at least three replicates. *p < 0.05, **p < 0.01, ***p < 0.001, ****p < 0.0001. Abbreviations: ADPGK, ADP‐dependent glucokinase; AGPAT2/4, 1‐acylglycerol‐3‐phosphate O‐acyltransferase 2/4; a‐KG, alpha‐ketoglutarate; 1,3BPG, 1,3‐bisphosphoglyceric acid; CDS1/2, cytidine diphosphate–diacylglycerol synthase 1/2; Cer, ceramide; ENO1, enolase 1; FADS3, fatty acid desaturase 3; FC, fold change; F6P, fructose‐6‐phosphate; F1,6P, fructose‐1,6‐bisphosphate; GlcADG, glucuronosyldiacylglycerol; GlcCer, glucosylceramide; GM3, ganglioside monosialic acid 3; G6P, glucose‐6‐phosphate; GPAT1/4, glycerol‐3‐phosphate acyltransferase 1/4; HBMP, human bone morphogenetic protein ; LPIN1/2, lipin 1/2; MGDG, monogalactosyldiacylglycerol; P, parental; PC, polycarbonate; PE, phosphatidylethanolamine; PEG, polyethylene glycol; PEtOH, phosphatidylethanol; PG, phosphatidylglycerol; 2PG/3PG, 2/3‐phosphoglyceric acid; PGK1, phosphoglycerate kinase 1; PI, phosphatidylinositol; PS, phosphatidylserine; PTPMT1, protein tyrosine phosphatase mitochondrial 1; SM, sphingomyelin [Color figure can be viewed at wileyonlinelibrary.com]
FIGURE 4
FIGURE 4
HIF‐1α and SREBP1 mediating increased glucose to CL anabolism represses cytochrome c release in radioresistant HCC cells. (A) Restorative effect of M‐HCl (20 μM, 48 h) on IR‐induced apoptosis and cytochrome c release in the indicated cell lines. Glyceraldehyde 3‐phosphate dehydrogenase and translocase of outer mitochondrial membrane 20 were loaded as cytoplasmic and mitochondrial markers, respectively. (B) Relative CL content (left) and cell survival determined by MTT assays (right) of radioresistant cells transiently expressing either scrambled siRNA or siRNA against CRLS1 following IR treatment. (C) Western blot of downstream targets in IR‐R cells upon HIF1A or SREBP1 knockdown using shRNA. (D) Cell viability determined by MTT assays in resistant cells upon HIF1A or SREBP1 knockdown. (E,F) Restorative effect of M‐HCl (E) or CRLS1 overexpression (F) on IR‐induced apoptosis in radioresistant cell lines with HIF1A or SREBP1 knockdown. Survival data were normalized to those of unirradiated control cells. Data are represented as mean ± SEM of at least three replicates. *p < 0.05, **p < 0.01, ***p < 0.001, ****p < 0.0001. Abbreviations: Cyto, cytoplasmic; GAPDH, glyceraldehyde 3‐phosphate dehydrogenase; DAPI, 4‐6‐diamidino‐2‐phenylindole; (M), mature; Mito, mitochondrial; ns, not significant; (P), precursor; TOM20, translocase of outer mitochondrial membrane 20 [Color figure can be viewed at wileyonlinelibrary.com]
FIGURE 5
FIGURE 5
mTORC1‐mediated translation of HIF‐1α and SREBP1 drives IR‐R in HCC cells. (A) Synergy of rapamycin (2 μM, 48 h) with IR in radioresistant cells by apoptosis measurements. (B,C) Restorative effect of M‐HCl (10 μM) (B) or CRLS1 overexpression (C) on clonogenic survival of radioresistant cell lines treated with rapamycin (1 μM) and exposed to the indicated dose of IR. Survival data were normalized to respective unirradiated controls. (D) MG132 (20 μM, 24 h) or chloroquine (20 μM, 24 h) treatment on indicated cells with or without 8 Gy IR. (E) The ratio of HIF‐1α and SREBP1 mRNA loaded on polysomes to their total mRNA levels by quantitative RT‐PCR analysis in IR or IR plus rapamycin–treated conditions (2 μM, 24 h). Each value was normalized to tubulin loaded on the polysome and total tubulin expression. (F) Protein levels of HIF‐1α and SREBP1 in radioresistant cells with 4E‐BP1 or S6K knocked down by siRNA with 8 Gy IR. Data are represented as mean ± SEM of at least three replicates. *p < 0.05, **p < 0.01, ***p < 0.001, ****p < 0.0001. Abbreviations: Con, control; CQ, chloroquine; GAPDH, glyceraldehyde 3‐phosphate dehydrogenase; (M), mature; ns, not significant; P, parental; (P), precursor; Rapa, rapamycin [Color figure can be viewed at wileyonlinelibrary.com]
FIGURE 6
FIGURE 6
mTORC1 activation–mediated glucose to CL anabolism determines radiation sensitivity in vivo. (A,B) Tumor growth curves, tumor images, representative immunohistochemical staining, and western blots of s.c. xenograft models in nude mice with indicated cells and treatments. (C) Response of Hepa1‐6 xenografts in C57 mice treated with control, IR (8 Gy × 3 F), IR with MHY1485 (5 mg/kg), or IR with high‐glucose drinking (5%). (D) Response of Hepa1‐6 short hairpin RNA control (shNC) and shCRLS1 xenografts in C57 mice treated with IR (8 Gy × 2 F) or IR with MHY1485 (5 mg/kg). (E) Effect of cutting off glucose flux on radiation responsiveness in s.c. implanted MHCC97L IR‐R nude mice subjected to treatments with control, 3Br‐PA (5 mg/kg), ketoconazole (20 mg/kg), IR (8 Gy × 2 F), IR with 3Br‐PA, or IR with ketoconazole. (F) Response of MHCC97L IR‐R xenografts to treatment with control, rapamycin (4 mg/kg), IR (8 Gy × 2 F), or combination. Waterfall plot showing the percentage of tumor growth rate per individual mouse and tumor images upon necropsy presented in (C–F). Data are represented as mean ± SEM. Scale bars, 20 μm. *p < 0.05, **p < 0.01, ***p < 0.001, ****p < 0.0001. Abbreviations: Cas3/9, caspase 3/9; GAPDH, glyceraldehyde 3‐phosphate dehydrogenase; Glu, glucose; Keto, ketoconazole; ns, not significant; Rapa, rapamycin [Color figure can be viewed at wileyonlinelibrary.com]
FIGURE 7
FIGURE 7
Activated metabolism correlates with response of patients with HCC to RT. (A) Representative images of indicated immunohistochemical staining of tumor samples from patients with HCC who received surgical resection or liver biopsy before RT. Matched MRIs from corresponding patients before and after RT are displayed. (B) Representative immunohistochemical staining of indicated targets in five tumor samples from patients with HCC who received surgical resection after RT. Scale bars, 50 μm/10 μm (inset). (C) Statistics of indicated targets between RT response and nonresponse in patients with HCC, as related to (A,B). (D) Working model depicting the mechanisms that drive glucose and CL anabolism underlying radioresistance of HCC cells. Abbreviations: FFA, free fatty acid; F6P, fructose‐6‐phosphate; F1,6P, fructose‐1,6‐bisphosphate; G6P, glucose‐6‐phosphate; IHC, immunohistochemistry; ROS, reactive oxygen species [Color figure can be viewed at wileyonlinelibrary.com]

Similar articles

Cited by

References

    1. Bray F, Ferlay J, Soerjomataram I, Siegel RL, Torre LA, Jemal A. Global cancer statistics 2018: GLOBOCAN estimates of incidence and mortality worldwide for 36 cancers in 185 countries. CA Cancer J Clin. 2018;68:394–424. - PubMed
    1. Rajyaguru DJ, Borgert AJ, Smith AL, Thomes RM, Conway PD, Halfdanarson TR, et al. Radiofrequency ablation versus stereotactic body radiotherapy for localized hepatocellular carcinoma in nonsurgically managed patients: analysis of the national cancer database. J Clin Oncol. 2018;36:600–8. - PubMed
    1. Wahl DR, Stenmark MH, Tao Y, Pollom EL, Caoili EM, Lawrence TS, et al. Outcomes after stereotactic body radiotherapy or radiofrequency ablation for hepatocellular carcinoma. J Clin Oncol. 2016;34:452–9. - PMC - PubMed
    1. Wei X, Jiang Y, Zhang X, Feng S, Zhou B, Ye X, et al. Neoadjuvant three‐dimensional conformal radiotherapy for resectable hepatocellular carcinoma with portal vein tumor thrombus: a randomized, open‐label, multicenter controlled study. J Clin Oncol. 2019;37:2141–51. - PMC - PubMed
    1. Zhou W, Yao Y, Scott AJ, Wilder‐Romans K, Dresser JJ, Werner CK, et al. Purine metabolism regulates DNA repair and therapy resistance in glioblastoma. Nat Commun. 2020;11:1–14. - PMC - PubMed

Publication types

MeSH terms

Substances