. 2021:1:32.
doi: 10.1038/s43586-021-00029-y. Epub 2021 Apr 29.

Subcellular proteomics

Affiliations

Subcellular proteomics

Josie A Christopher et al. Nat Rev Methods Primers. 2021.

Abstract

The eukaryotic cell is compartmentalized into subcellular niches, including membrane-bound and membrane-less organelles. Proteins localize to these niches to fulfil their function, enabling discreet biological processes to occur in synchrony. Dynamic movement of proteins between niches is essential for cellular processes such as signalling, growth, proliferation, motility and programmed cell death, and mutations causing aberrant protein localization are associated with a wide range of diseases. Determining the location of proteins in different cell states and cell types and how proteins relocalize following perturbation is important for understanding their functions, related cellular processes and pathologies associated with their mislocalization. In this Primer, we cover the major spatial proteomics methods for determining the location, distribution and abundance of proteins within subcellular structures. These technologies include fluorescent imaging, protein proximity labelling, organelle purification and cell-wide biochemical fractionation. We describe their workflows, data outputs and applications in exploring different cell biological scenarios, and discuss their main limitations. Finally, we describe emerging technologies and identify areas that require technological innovation to allow better characterization of the spatial proteome.


Conflict of interest statement

Competing interests The authors declare no competing interests.

Figures
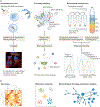
Fig. 1 |
Fig. 1 |. Overview of spatial proteomics approaches.
Spatial proteomics approaches include fluorescence imaging approaches and proximity labelling or biochemical fractionation techniques coupled with mass spectrometry (MS). a | Imaging of cells and tissues stained with fluorescently labelled antibodies (or other affinity reagents) allows for subcellular protein localization in situ. Proximity labelling strategies permit in vivo biotin labelling of proteins in close proximity to a chosen bait protein that has been genetically fused to a biotinylating enzyme. Following labelling, samples can be processed using MS proteomics protocols. Biochemical fractionation methods can produce cell fractions that are enriched for organelles of interest based on the different biophysical and chemical properties of different subcellular niches. These fractions are then subject to MS analysis. Typically, organellar separation is achieved using density gradient or differential/sedimentation centrifugation, or sequential solubilization using detergents,,–,. b | All of these methods produce data-rich outputs that require computational analysis using techniques such as hierarchical clustering, dimension reduction or network analysis to visually represent and calculate statistical information. Machine learning techniques can also be used (not pictured). Correlation profiling plot in part a and dimension reduction plot in part b adapted from REF., Springer Nature Limited.
Fig. 2 |
Fig. 2 |. Proximity labelling proteomics.
Proximity labelling strategies permit biotin labelling of proteins in immediate proximity to the chosen bait proteins in living cells. a | Baits of interest (BaitA, BaitZ) are genetically fused with an enzyme such as APEX/APEX2 or BirA*, BioID2, miniTurbo or TurboID for BioID (step 1), which biotinylate nearby proteins upon incubation of engineered cells with biotin in culture (step 2). Control lines can express the labelling enzyme fused to a non-specifically localized control bait such as green fluorescent protein or a localization signal specific for a non-target organelle. In the case of APEX, the addition of H2O2 generates short-lived biotin-phenol free radicals that react with nearby biomolecules. Following labelling, a streptavidin pull-down step enriches for labelled proteins, which can then be identified by mass spectrometry (MS) (step 3). High-confidence proximity interactors are determined by comparing preys with proteins isolated to control lines using such tools as SAINT (Significance Analysis of INTeractome) (step 4). b | Organellar components can be elucidated using bait-centric or prey-centric analyses. Ratiometric quantification of baits, for example using isotopic labelling approaches with baits in and outside the organelle, or hierarchical clustering of multiple baits can be used to identify enrichment of proteins within an organelle of interest in a bait-centric manner. Alternatively, extensive proximity interaction networks can be elucidated using multiple baits and prey-centric analyses including Pearson’s correlation and factorization approaches such as non-negative matrix factorization (NMF). LC-MS/MS, liquid chromatography with tandem mass spectrometry; m/z, mass to charge ratio; SILAC, stable isotope labelling by amino acids in cell culture; TMT, tandem mass tagging; t-SNE, t-distributed stochastic embedding; LFQ, label-free quantitation.
Fig. 3 |
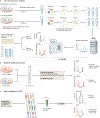
Fig. 3 |. Generic data-dependent acquisition workflows in quantitative proteomics.
a | Two sample preparation workflows incorporating biochemical fractionation and proximity labelling techniques are shown in the context of a standard data-dependent acquisition (DDA) proteomics workflow. In DDA workflows, proteins are solubilized and denatured using buffers containing chaotropic agents and detergents, such as urea and SDS. Reduction of disulfide bonds and alkylation of free cysteine thiols allows for efficient digestion of the proteins to peptides using proteolytic enzymes, typically trypsin. Samples are then acidified and analysed by liquid chromatography with tandem mass spectrometry (LC-MS/MS). MS/MS consists of an initial MS1 scan, which detects charged peptides (known as precursor ions), followed by isolation, fragmentation and detection of these ions in a subsequent MS2 scan to determine the amino acid sequence of the precursor ions. The complex spectra can then be deconvoluted using in silico reference databases, using algorithms that account for experimental parameters and sample preparations. b | Labelling-based proteomics methods use the above strategy, although additional steps are added to the workflow. For metabolic labelling methods such as stable isotope labelling by amino acid in culture (SILAC), a light and heavy isotopic version of an amino acid are added to the cell culture growth media, allowing metabolic incorporation of stable isotope-labelled amino acids into newly synthesized proteins. For complete incorporation, approximately six cell doublings are needed. Labelling enables sample pooling after cell harvest to minimize downstream technical variability. c | Isobaric labelling methods such as tandem mass tagging (TMT) also reduce technical variability. Labelling occurs post digestion and up to 16 samples can be multiplexed and measure in one MS run using TMT labelling. Although each tag has the same mass when bound to the peptides, upon fragmentation by higher-energy collisional dissociation during MS, their ion reporter components — which have distinguishing mass — are displaced from the peptide and can be observed in the low mass region of the MS2 spectra to determine the relative quantities of the same peptide across multiple samples. m/z, mass to charge ratio. S1–S6, sample 1–sample 6.
Fig. 4 |
Fig. 4 |. Generic fluorescence immunocytochemistry proteomics workflow.
a | Cells are fixed using either cross-linking agents or organic solvents, such as aldehydes or alcohols. Cross-linkers generally outperform organic solvents for preserving subcellular structures but may reduce antigen retrieval for certain proteins. Permeabilization of cells with detergents such as digitonin or Triton X-100 extracts lipids from the cell membrane and allows for penetration of affinity agents such as antibodies into the cells. Blocking buffer containing serum or albumin helps reduce unspecific labelling before addition of affinity reagents. Cells are then counterstained with different organelle probes before imaging. Image acquisition is typically performed using confocal microscopy and an optional embedding step can be used for archiving of the samples. b,c | After image acquisition, the image data are annotated to assign protein location to subcellular structures. b | Manual inspection of images can be used to acquire qualitative data. For obvious staining patterns easily interpreted by eye, qualitative annotation might be sufficient if the data sets are small. c | For large image data sets, computational analysis is required. Computational strategies enable high-throughput collection of quantitative, morphological and comparative information, such as algorithms for segmentation and intensity measurements. Such quantitative data can then be used to generate networks and dimension reduction plots. Multi-label patterns and fine structures stained in a subset of cells may require manual annotation or more advanced computational analysis. Relationship and network analysis in part c adapted from REF., AAAS. Dimension reduction plot in part c adapted from REF., CC BY 4.0 (https://creativecommons.org/licenses/by/4.0/).
Fig. 5 |
Fig. 5 |. Subtractive versus correlation profiling analysis.
a | Subtractive proteomics techniques involve purifying an organelle of interest — usually using a combination of sedimentation and density centrifugation — alongside one or more crude fractions containing ‘contaminant’ components. By quantifying protein markers for the organelle of interest and proteins from the crude fractions using quantitative liquid chromatography with tandem mass spectrometry (LC-MS/MS), intensity versus ratio plots can be produced and used to distinguish true residents of the organelle of interest versus contaminants. b | In cell-wide correlation profiling experiments, multiple organelle-enriched fractions are collected across a sedimentation or density gradient. This allows for the unique profiles of multiple subcellular niches to be generated by annotation with organellar marker proteins. The variance of each organellar niche can be represented using dimension reduction methods such as principle component analysis (PCA). Markers can be used to train machine learning algorithms such as support vector machines (SVMs) or T-augmented Gaussian mixture models (TAGMs) to assign unannotated proteins, and find posterior probabilities of proteins belonging to multiple organelles in order to elucidate the locations of MLPs. Intensity versus ratio plots in part a adapted with permission from REF.. Elements of part b adapted from REF., Springer Nature Limited, apart from TAGM plot adapted from REF., CC BY 4.0 (https://creativecommons.org/licenses/by/4.0/).

Similar articles

Cited by

References

    1. Gibson TJ Cell regulation: determined to signal discrete cooperation. Trends Biochem. Sci 34, 471–482 (2009). - PubMed
    1. Hung M-C & Link W Protein localization in disease and therapy. J. Cell Sci 124, 3381 (2011). - PubMed
    1. Pankow S, Martínez-Bartolomé S, Bamberger C & Yates JR Understanding molecular mechanisms of disease through spatial proteomics. Curr. Opin. Chem. Biol 48, 19–25 (2019). - PMC - PubMed
    1. Siljee JE et al.Subcellular localization of MC4R with ADCY3 at neuronal primary cilia underlies a common pathway for genetic predisposition to obesity. Nat. Genet 50, 180–185 (2018). - PMC - PubMed
    1. Neel DS et al.Differential subcellular localization regulates oncogenic signaling by ROS1 kinase fusion proteins. Cancer Res. 79, 546 (2019). - PMC - PubMed

LinkOut - more resources