Single-cell transcriptome analysis reveals defective decidua stromal niche attributes to recurrent spontaneous abortion
- PMID: 34546587
- PMCID: PMC8560595
- DOI: 10.1111/cpr.13125
Single-cell transcriptome analysis reveals defective decidua stromal niche attributes to recurrent spontaneous abortion
Abstract
Objectives: Successful pregnancy involves the homeostasis between maternal decidua and fetoplacental units, whose disruption contributes to compromised pregnancy outcomes, including recurrent spontaneous abortion (RSA). The role of cell heterogeneity of maternal decidua in RSA is yet to be illustrated.
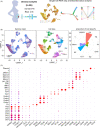
Materials and methods: A total of 66,078 single cells from decidua samples isolated from patients with RSA and healthy controls were analysed by unbiased single-cell RNA sequencing (scRNA-seq).
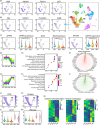
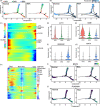
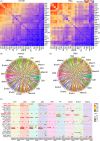
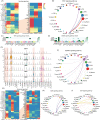
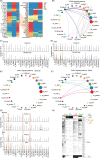
Results: Our scRNA-seq results revealed that stromal cells are the most abundant cell type in decidua during early pregnancy. RSA samples are accompanied by aberrant decidualization and obviously obstructed communication between stromal cells and other cell types, such as abnormal activation of macrophages and NK cells. In addition, the over-activated TNF superfamily member 12 (TNFSF12, TWEAK) and FASLG in RSA are closely related to stromal cell demise and pregnancy failure.
Conclusions: Our research reveals that the cell composition and communications in normal and RSA decidua at early pregnancy and provides insightful information for the pathology of RSA and will pave the way for pregnancy loss prevention.
© 2021 The Authors. Cell Proliferation published by John Wiley & Sons Ltd.
Conflict of interest statement
There are no competing financial or non‐financial interests regarding this work.
Figures

Similar articles
-
Deciphering decidual deficiencies in recurrent spontaneous abortion and the therapeutic potential of mesenchymal stem cells at single-cell resolution.Stem Cell Res Ther. 2024 Jul 29;15(1):228. doi: 10.1186/s13287-024-03854-6. Stem Cell Res Ther. 2024. PMID: 39075579 Free PMC article.
-
Natural killer, natural killer T, helper and cytotoxic T cells in the decidua from recurrent spontaneous abortion with normal and abnormal chromosome karyotypes.Biochem Biophys Res Commun. 2019 Jan 8;508(2):354-360. doi: 10.1016/j.bbrc.2018.11.156. Epub 2018 Nov 29. Biochem Biophys Res Commun. 2019. PMID: 30503343
-
Extravillous trophoblast invasion of venous as well as lymphatic vessels is altered in idiopathic, recurrent, spontaneous abortions.Hum Reprod. 2017 Jun 1;32(6):1208-1217. doi: 10.1093/humrep/dex058. Hum Reprod. 2017. PMID: 28369440
-
The Pleiotropic Effect of Glycodelin-A in Early Pregnancy.Am J Reprod Immunol. 2016 Mar;75(3):290-7. doi: 10.1111/aji.12471. Epub 2016 Jan 12. Am J Reprod Immunol. 2016. PMID: 26757357 Review.
-
Non-coding RNA regulates the immune microenvironment in recurrent spontaneous abortion (RSA): new insights into immune mechanisms†.Biol Reprod. 2024 Feb 10;110(2):220-229. doi: 10.1093/biolre/ioad157. Biol Reprod. 2024. PMID: 37956412 Free PMC article. Review.
Cited by
-
SLC8A1, a novel prognostic biomarker and immunotherapy target in RSA and UCEC based on scRNA-seq and pan-cancer analysis.Heliyon. 2024 Aug 24;10(17):e36899. doi: 10.1016/j.heliyon.2024.e36899. eCollection 2024 Sep 15. Heliyon. 2024. PMID: 39263055 Free PMC article.
-
Spatial transcriptomics of fetal membrane-Decidual interface reveals unique contributions by cell types in term and preterm births.PLoS One. 2024 Aug 19;19(8):e0309063. doi: 10.1371/journal.pone.0309063. eCollection 2024. PLoS One. 2024. PMID: 39159152 Free PMC article.
-
Placental growth factor mediates pathological uterine angiogenesis by activating the NFAT5-SGK1 signaling axis in the endometrium: implications for preeclampsia development.Biol Res. 2024 Aug 17;57(1):55. doi: 10.1186/s40659-024-00526-w. Biol Res. 2024. PMID: 39152497 Free PMC article.
-
Deciphering decidual deficiencies in recurrent spontaneous abortion and the therapeutic potential of mesenchymal stem cells at single-cell resolution.Stem Cell Res Ther. 2024 Jul 29;15(1):228. doi: 10.1186/s13287-024-03854-6. Stem Cell Res Ther. 2024. PMID: 39075579 Free PMC article.
-
Deciphering the Epigenetic Landscape: Placental Development and Its Role in Pregnancy Outcomes.Stem Cell Rev Rep. 2024 May;20(4):996-1014. doi: 10.1007/s12015-024-10699-2. Epub 2024 Mar 8. Stem Cell Rev Rep. 2024. PMID: 38457061 Review.
References
MeSH terms
Grants and funding
- 2017YFC1001402/National Key R&D Program of China
- 2016YFC1000405/National Key R&D Program of China
- 2018YFC1004100/National Key R&D Program of China
- 2018YFC10029002/National Key R&D Program of China
- 81830045/National Natural Science Foundation of China
- 82071652/National Natural Science Foundation of China
- 81701483/National Natural Science Foundation of China
- 81971419/National Natural Science Foundation of China
- 20720190073/Fundamental Research Funds for the Central Universities
- 202102010006/Science and Technology Program of Guangzhou, China
- 2020A1515010273/General Program of Guangdong Province Natural Science Foundation
- 2021A1515011039/General Program of Guangdong Province Natural Science Foundation
LinkOut - more resources
Full Text Sources
Other Literature Sources

