. 2021 Sep 20;17(9):e1009622.
doi: 10.1371/journal.ppat.1009622. eCollection 2021 Sep.

Phase separation of a plant virus movement protein and cellular factors support virus-host interactions

Affiliations

Phase separation of a plant virus movement protein and cellular factors support virus-host interactions

Shelby L Brown et al. PLoS Pathog. .

Abstract

Both cellular and viral proteins can undergo phase separation and form membraneless compartments that concentrate biomolecules. The p26 movement protein from single-stranded, positive-sense Pea enation mosaic virus 2 (PEMV2) separates into a dense phase in nucleoli where p26 and related orthologues must interact with fibrillarin (Fib2) as a pre-requisite for systemic virus movement. Using in vitro assays, viral ribonucleoprotein complexes containing p26, Fib2, and PEMV2 genomic RNAs formed droplets that may provide the basis for self-assembly in planta. Mutating basic p26 residues (R/K-G) blocked droplet formation and partitioning into Fib2 droplets or the nucleolus and prevented systemic movement of a Tobacco mosaic virus (TMV) vector in Nicotiana benthamiana. Mutating acidic residues (D/E-G) reduced droplet formation in vitro, increased nucleolar retention 6.5-fold, and prevented systemic movement of TMV, thus demonstrating that p26 requires electrostatic interactions for droplet formation and charged residues are critical for nucleolar trafficking and virus movement. p26 readily partitioned into stress granules (SGs), which are membraneless compartments that assemble by clustering of the RNA binding protein G3BP following stress. G3BP is upregulated during PEMV2 infection and over-expression of G3BP restricted PEMV2 RNA accumulation >20-fold. Deletion of the NTF2 domain that is required for G3BP condensation restored PEMV2 RNA accumulation >4-fold, demonstrating that phase separation enhances G3BP antiviral activity. These results indicate that p26 partitions into membraneless compartments with either proviral (Fib2) or antiviral (G3BP) factors.


Conflict of interest statement

The authors have declared that no competing interests exist.

Figures

Fig 1
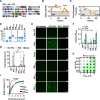
Fig 1. p26 forms poorly dynamic condensates in vivo.
(A) Genomic organization of the single-stranded positive-sense RNA genome of PEMV2. Free GFP and p26 C-terminally fused with GFP (p26WT) were expressed from binary expression plasmids under the constitutive CaMV 35S promoter. (B) Free GFP or p26WT were agroinfiltrated alongside the p14 RNA silencing suppressor in N. benthamiana and imaged at 2 dpi using confocal microscopy (488 nm). Note that the majority of plant mesophyll cells is taken up by a single large vacuole. Differential interference contrast (DIC) microscopy was used for p26WT to visualize cell borders. Bar scale: 20 μm. (C) FRAP analyses were performed by photobleaching cytoplasmic condensates and monitoring fluorescence recovery at 5 s intervals. A representative p26WT condensate is shown before photobleaching, immediately following photobleaching (5 s), and at 120 s. Bar scale 5 μm. Average FRAP intensity is shown from seven FRAP experiments and shaded area represents standard deviations.
Fig 2
Fig 2. p26 is intrinsically disordered and phase separates through electrostatic interactions.
(A) The p26 IDR (amino acids 1–132) is shown with highlighted residues corresponding to basic (blue) or acidic (red) residues. The conserved nuclear localization signal (NLS) is highlighted in yellow. (B) Graphical representation of predicted intrinsic disorder in p26 using IUPRED [53]. (C) Graphical representation of predicted phase separation propensity within p26 using the catGRANULE algorithm [54]. (D) N-terminal His-tagged recombinant proteins were analyzed by SDS-PAGE to assess size and purity. Proteins were stained using Coomassie Blue. Marker (M) sizes are shown in kilodaltons (kDa). IDRR/K-G migrated more slowly than expected both in vitro and in vivo (see Fig 6B). (E) In vitro droplet formation was visualized by confocal microscopy. Eight micromolar protein was used for all assays and 10% PEG-8000 was added as a crowding agent (Middle panels). One molar NaCl was added to disrupt electrostatic interactions (Right panel). Bar scale: 20 μm. Images in all panels are representative of at least two independent experiments. (F) Turbidity assays (OD600) using either 8 μM or 24 μM protein were performed for all constructs. **** P<0.0001 by two-way ANOVA with Dunnett’s multiple comparisons test vs. IDRWT. Error bars denote standard deviations and individual data points (red circles) represent three biological replicates. (G) Total droplet areas (%) were measured from confocal images using ImageJ. Error bars denote standard deviations and red circles represent three 20x fields for each assay. *** P<0.001, **** P<0.0001, ns: not significant using two-way ANOVA with Sidak’s multiple comparisons test. (H) Phase diagram for IDRWT over a range of protein and NaCl concentrations. Results are representative of two independent experiments. (I) Mean condensate sizes for IDR mutants (excluding IDRR/K-G) were plotted by cumulative distribution frequency. Particle sizes were measured from three representative 20x fields using ImageJ. P values represent results from two-tailed Mann-Whitney tests compared to IDRWT. ns: not significant.
Fig 3
Fig 3. Charged residues govern p26 nucleolar partitioning.
(A) p26-GFP fusions were expressed from the CaMV 35S promoter in N. benthamiana leaves following agroinfiltration. Prior to imaging, leaves were infiltrated with 5 μg/mL DAPI to stain nuclei. 20x and 63x fields are shown. Arrows denote p26 partitioned inside nuclear bodies (e.g. nucleolus). Bar scale: Top 20 μm; Bottom 10 μm. Images in all panels are representative of two independent experiments. (B) Nuclear granules were manually counted from six 20x fields across three biological replicates. Total granule counts (>2 μm2 in size) were counted using the ImageJ “analyze particles” tool. Error bars denote standard deviations and data points (red circles) denote individual 20x fields. ****P<0.0001 unpaired t test, ND not detected.
Fig 4
Fig 4. p26 phase separation is required for partitioning into Fib2 droplets.
(A) Graphical representation of predicted intrinsic disorder in A. thaliana Fib2 using IUPRED [53]. The N-terminal glycine and arginine rich (GAR) domain is labelled. (B) The Fib2 GAR domain (Fib2GAR) and full-length Fib2 (Fib2FL) were fused to mCherry and purified from E. coli and analyzed by SDS-PAGE. Proteins were Coomassie stained and molecular weight (kDa) marker is shown. (C) mCherry, Fib2GAR, and Fib2FL were examined by confocal microscopy after inducing phase separation with 10% PEG-8000 alone or in the presence of 1 M NaCl. Eight micromolar protein was used for all assays. Bar scale: 20 μm. Experiments were repeated. (D) Total droplet areas of Fib2GAR and Fib2FL were measured using ImageJ. Error bars denote standard deviations and data points (red circles) represent representative 20x fields (3 total) for each condition. **** P<0.0001, ns: not significant using two-way ANOVA with Sidak’s multiple comparisons test. (E) Fib2GAR droplets were pre-formed using 24 μM protein before the addition of 4 μM IDRWT or IDRR/K-G. Sorting of IDRWT to Fib2 droplets was observed by confocal microscopy. White arrows indicate exclusion of IDRR/K-G from pre-formed Fib2GAR droplets. Bar scale 10 μm. Images in all panels are representative of two independent experiments.
Fig 5
Fig 5. vRNPs required for systemic trafficking can be reconstituted in vitro via phase separation.
(A) Fib2GAR and Fib2FL droplets were pre-formed prior to the addition of PEMV2-Cy5 gRNAs at a 1:500 RNA:protein molar ratio. Sorting of Cy5-labelled RNAs into Fib2 droplets was monitored using confocal microscopy. Bar scale: 20 μm. (B) The fraction of Fib2GAR or Fib2FL signal that was positive for Cy5-labelled RNA was determined by MOC analysis using EzColocalization [87]. Error bars denote standard deviations and individual data points (red circles) represent individual 20x fields (3 total) for each condition. ***P<0.001 unpaired t test. (C) IDRWT droplets were pre-formed prior to the addition of PEMV2-Cy5 gRNA, TCV-Cy5 gRNA, or RLuc-Cy5 RNA. Bar scale: 20 μm. (D) The fraction of IDRWT signal that was positive for Cy5-labelled RNA was determined by MOC analysis. ns: not significant by unpaired t test. Error bars denote standard deviations. Three 20x fields were quantified for each condition (red circles). (E) IDRWT, Fib2FL, and PEMV2-Cy5 gRNA were mixed under crowding conditions. Bar scale: 10 μm. Images in all Fig 5 panels are representative of at least two independent experiments.
Fig 6
Fig 6. Phase separation-deficient p26 mutants fail to systemically traffic a virus vector.
(A) The TMV-derived TRBO vector lacks CP and is severely impaired in systemic trafficking. Free GFP, p26WT, p26R/K-G, and p26D/E-G GFP-fusions were expressed from TRBO after establishing local infections via agroinfiltration (B) GFP-fusion proteins were visualized and detected in local leaves at 4 dpi by UV exposure (Left) or western blotting (Right). Pooled samples from 3 biological replicates were used for western blotting. Rubisco serves as a loading control. Red asterisks denote free GFP or GFP-fusion bands. (C) Localization patterns of free GFP, p26WT, p26R/K-G, and p26D/E-G in TRBO-infected leaves. Nuclear p26WT or p26D/E-G granules were counted from five 20x fields across three biological replicates and divided by the total number of granules (counted with ImageJ) to calculate a percentage (%). Bar scale: 20 μm. Results were compared with p26WT or p26D/E-G expressed from the duplicated 35S promoter (Fig 3B data is included for comparison). Error bars denote standard deviations and data points (red circles) represent individual 20x fields. ns not significant by multiple unpaired t tests. ****P<0.0001 unpaired t test. (D) Systemic leaves were imaged at 14 dpi. RT-PCR was used to detect the TRBO vector or actin as a control. -RT: No reverse transcriptase controls. Two pools of 3–4 leaves are shown for each construct. Results are representative of three independent experiments consisting of at least 4 plants/construct.
Fig 7
Fig 7. p26 is sorted into G3BP phase separations that restrict PEMV2 accumulation.
(A) Graphical representation of predicted intrinsic disorder in A. thaliana G3BP using IUPRED [53]. G3BP contains an N-terminal NTF2 domain and C-terminal RNA Recognition Motif (RRM). (B) Following agroinfiltration, G3BP or ΔNTF2 expression patterns were visualized at 3 dpi in the absence of stress or after heat shock. During co-expression, p26 partitioning into G3BP SGs was observed following heat shock (White arrows). Scale bar: 20 μm. Inset shows western blot using anti-RFP antibodies to detect full-length G3BP and ΔNTF2. Rubisco was used as a loading control. Results represent two independent experiments. (C) G3BP was agroinfiltrated into N. benthamiana plants systemically infected with TRBO-p26WT. Confocal microscopy was used to observe co-localization (White arrows) between p26 and G3BP during virus infection. Scale bar: 20 μm. Results are representative of two independent experiments. (D) Native G3BP expression was measured in Mock- or PEMV2-infected N. benthamiana at 3 dpi by RT-qPCR. The agroinfiltrated p14 RNA silencing suppressor was used as a reference gene. Data is from three biological replicates (red circles). *P<0.05; student’s t-test. Bars denote standard error. (E) PEMV2 was agroinfiltrated alone, or alongside either G3BP or ΔNTF2 (both tagged with RFP). Western blot confirmed expression of G3BP and ΔNTF2 (top). RT-qPCR was used to measure PEMV2 gRNA accumulation and represents 7 biological replicates from 2 independent experiments (red circles, Bottom). Bars denote standard error. Brown-Forsythe and Welch ANOVA with multiple comparisons was used to determine if observed differences were significant. ** P<0.01.

Similar articles

Cited by

References

    1. Inoue T, Tsai B. How viruses use the endoplasmic reticulum for entry, replication, and assembly. Cold Spring Harb Perspect Biol. 2013;5(1):a013250-a. doi: 10.1101/cshperspect.a013250 - DOI - PMC - PubMed
    1. Anand SK, Tikoo SK. Viruses as modulators of mitochondrial functions. Adv Virol. 2013;2013:738794-. doi: 10.1155/2013/738794 - DOI - PMC - PubMed
    1. Walker EJ, Ghildyal R. Editorial: Viral Interactions with the Nucleus. Front Microbiol. 2017;8:951-. doi: 10.3389/fmicb.2017.00951 - DOI - PMC - PubMed
    1. Miller S, Krijnse-Locker J. Modification of intracellular membrane structures for virus replication. Nat Rev Microbiol. 2008;6(5):363–74. doi: 10.1038/nrmicro1890 - DOI - PMC - PubMed
    1. Dolgin E. What lava lamps and vinaigrette can teach us about cell biology. Nature. 2018;555(7696):300–2. - PubMed

Publication types

MeSH terms

Substances

Grants and funding

This work was supported by University of Missouri-Kansas City (UMKC) institutional start-up funds to J.P.M. The funders had no role in study design, data collection and analysis, decision to publish, or preparation of the manuscript.