

Exploring the ATR-CHK1 pathway in the response of doxorubicin-induced DNA damages in acute lymphoblastic leukemia cells
- PMID: 34519926
- PMCID: PMC10406704
- DOI: 10.1007/s10565-021-09640-x
Exploring the ATR-CHK1 pathway in the response of doxorubicin-induced DNA damages in acute lymphoblastic leukemia cells
Erratum in
-
Correction to: Exploring the ATR-CHK1 pathway in the response of doxorubicin-induced DNA damages in acute lymphoblastic leukemia cells.Cell Biol Toxicol. 2024 Aug 31;40(1):73. doi: 10.1007/s10565-024-09913-1. Cell Biol Toxicol. 2024. PMID: 39215871 Free PMC article. No abstract available.
Abstract
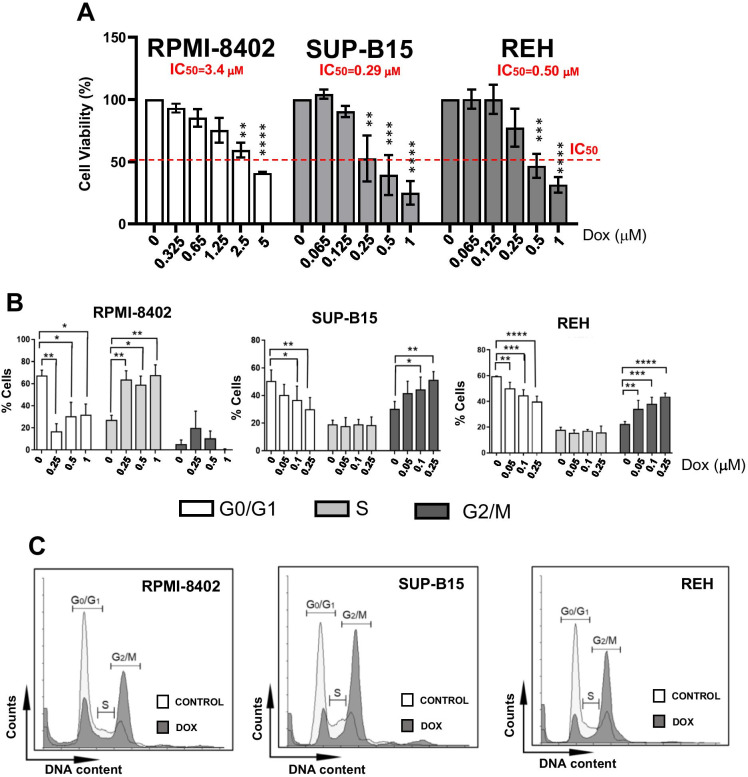
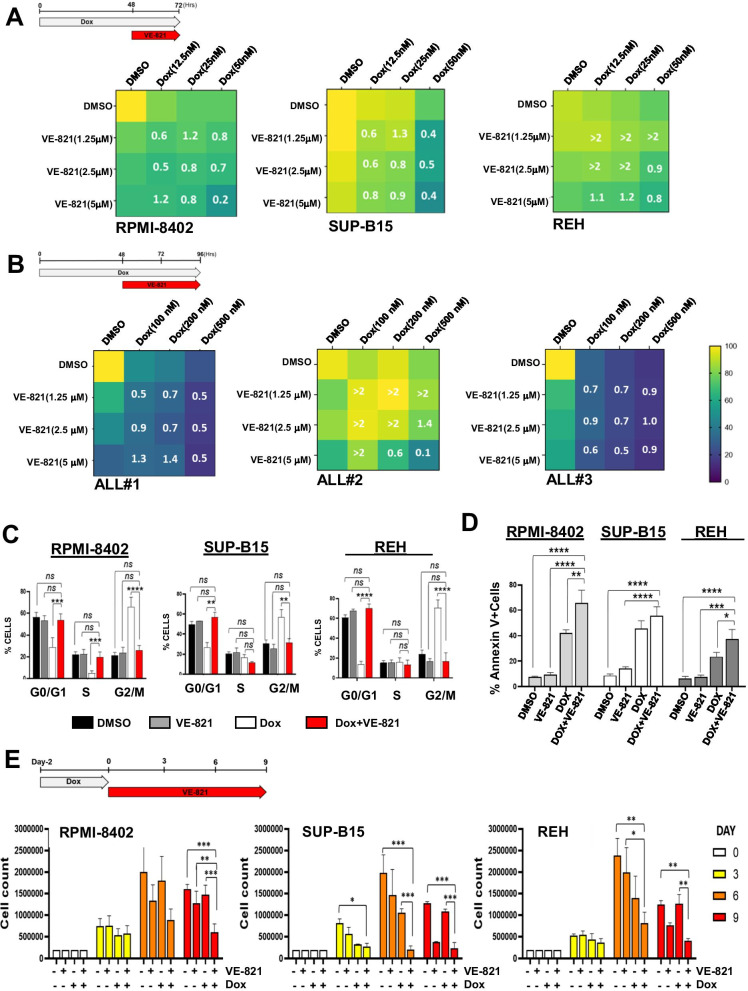
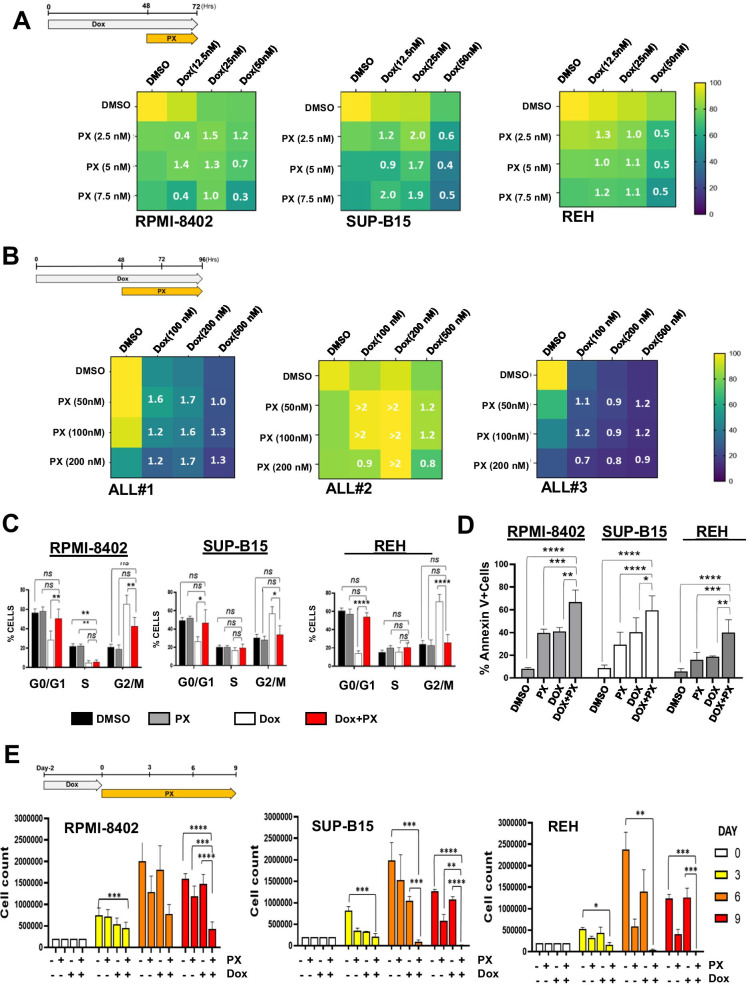
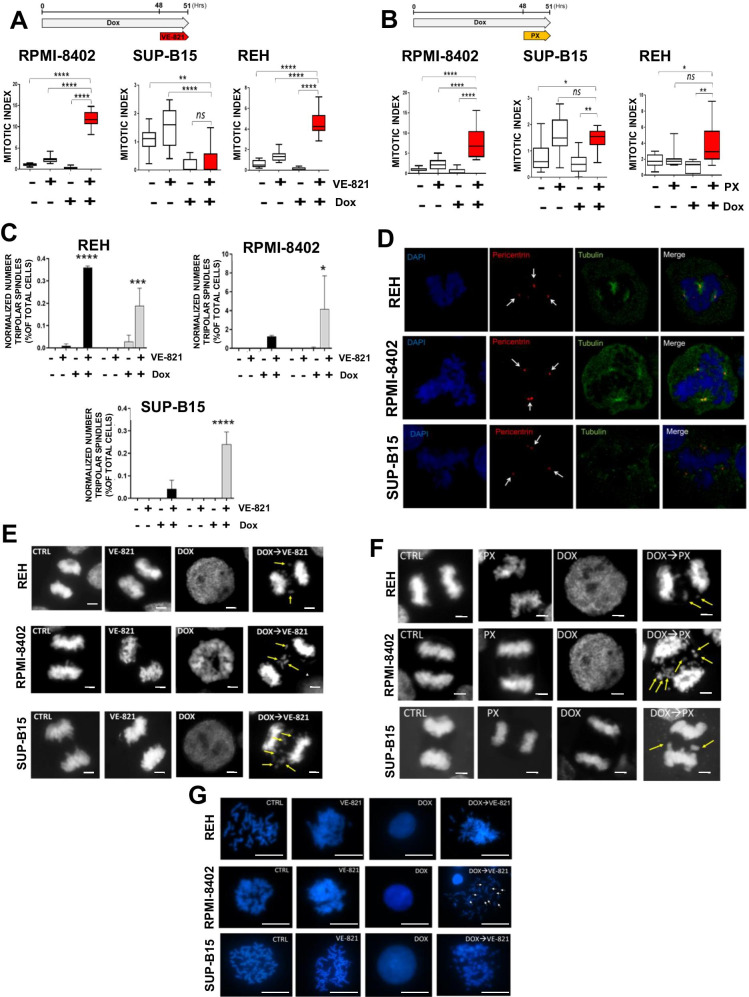
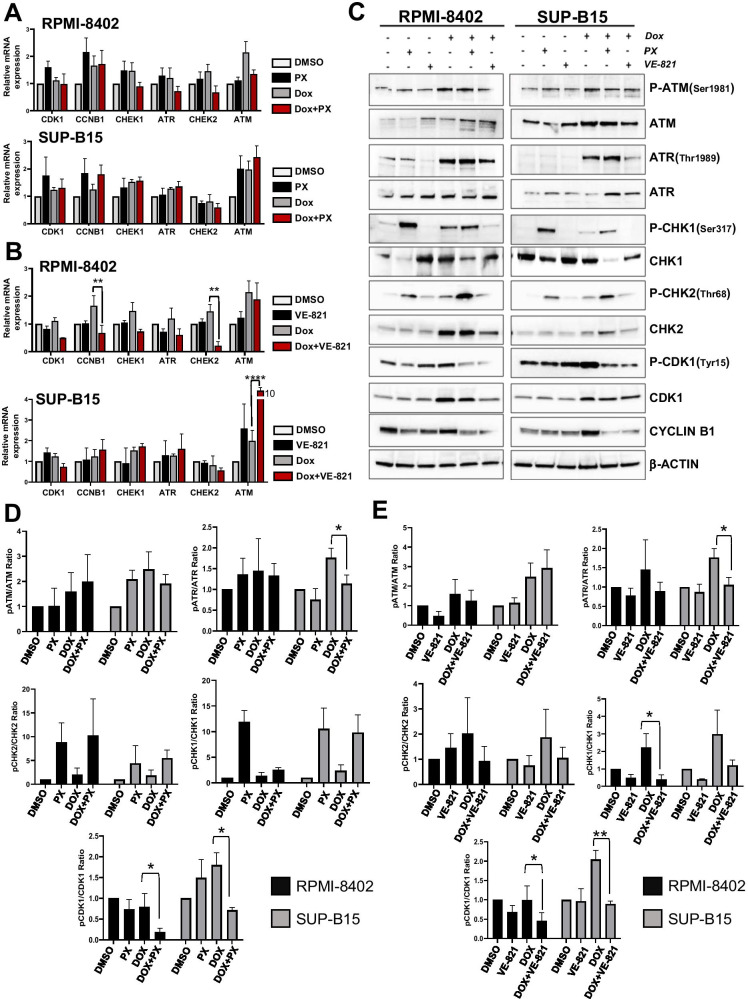
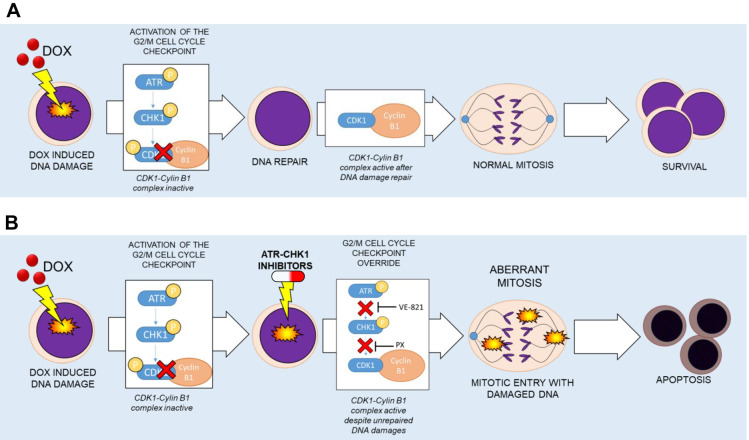
Doxorubicin (Dox) is one of the most commonly used anthracyclines for the treatment of solid and hematological tumors such as B-/T cell acute lymphoblastic leukemia (ALL). Dox compromises topoisomerase II enzyme functionality, thus inducing structural damages during DNA replication and causes direct damages intercalating into DNA double helix. Eukaryotic cells respond to DNA damages by activating the ATM-CHK2 and/or ATR-CHK1 pathway, whose function is to regulate cell cycle progression, to promote damage repair, and to control apoptosis. We evaluated the efficacy of a new drug schedule combining Dox and specific ATR (VE-821) or CHK1 (prexasertib, PX) inhibitors in the treatment of human B-/T cell precursor ALL cell lines and primary ALL leukemic cells. We found that ALL cell lines respond to Dox activating the G2/M cell cycle checkpoint. Exposure of Dox-pretreated ALL cell lines to VE-821 or PX enhanced Dox cytotoxic effect. This phenomenon was associated with the abrogation of the G2/M cell cycle checkpoint with changes in the expression pCDK1 and cyclin B1, and cell entry in mitosis, followed by the induction of apoptosis. Indeed, the inhibition of the G2/M checkpoint led to a significant increment of normal and aberrant mitotic cells, including those showing tripolar spindles, metaphases with lagging chromosomes, and massive chromosomes fragmentation. In conclusion, we found that the ATR-CHK1 pathway is involved in the response to Dox-induced DNA damages and we demonstrated that our new in vitro drug schedule that combines Dox followed by ATR/CHK1 inhibitors can increase Dox cytotoxicity against ALL cells, while using lower drug doses. • Doxorubicin activates the G2/M cell cycle checkpoint in acute lymphoblastic leukemia (ALL) cells. • ALL cells respond to doxorubicin-induced DNA damages by activating the ATR-CHK1 pathway. • The inhibition of the ATR-CHK1 pathway synergizes with doxorubicin in the induction of cytotoxicity in ALL cells. • The inhibition of ATR-CHK1 pathway induces aberrant chromosome segregation and mitotic spindle defects in doxorubicin-pretreated ALL cells.
Keywords: ATR; Acute lymphoblastic leukemia; CHK1; Cell cycle; Doxorubicin.
© 2021. The Author(s).
Conflict of interest statement
GM has competing interests with Novartis, BMS, Roche, Pfizer, ARIAD, and MSD.
Figures
Similar articles
-
Chk1 and Wee1 control genotoxic-stress induced G2-M arrest in melanoma cells.Cell Signal. 2015 May;27(5):951-60. doi: 10.1016/j.cellsig.2015.01.020. Epub 2015 Feb 12. Cell Signal. 2015. PMID: 25683911
-
Mitotic DNA damage response: Polo-like kinase-1 is dephosphorylated through ATM-Chk1 pathway.Cell Cycle. 2010 Jun 15;9(12):2389-98. doi: 10.4161/cc.9.12.11904. Epub 2010 Jun 15. Cell Cycle. 2010. PMID: 20581453
-
Src family kinases promote silencing of ATR-Chk1 signaling in termination of DNA damage checkpoint.J Biol Chem. 2014 May 2;289(18):12313-29. doi: 10.1074/jbc.M113.533752. Epub 2014 Mar 14. J Biol Chem. 2014. PMID: 24634213 Free PMC article.
-
Regulation of ATR-CHK1 signaling by ubiquitination of CLASPIN.Biochem Soc Trans. 2022 Oct 31;50(5):1471-1480. doi: 10.1042/BST20220729. Biochem Soc Trans. 2022. PMID: 36196914 Review.
-
DNA damage checkpoint kinases in cancer.Expert Rev Mol Med. 2020 Jun 8;22:e2. doi: 10.1017/erm.2020.3. Expert Rev Mol Med. 2020. PMID: 32508294 Review.
Cited by
-
Targeting the DNA damage response in hematological malignancies.Front Oncol. 2024 Jan 29;14:1307839. doi: 10.3389/fonc.2024.1307839. eCollection 2024. Front Oncol. 2024. PMID: 38347838 Free PMC article. Review.
-
Indigofera suffruticosa aerial parts extract induce G2/M arrest and ATR/CHK1 pathway in Jurkat cells.BMC Complement Med Ther. 2024 Jan 9;24(1):28. doi: 10.1186/s12906-023-04325-w. BMC Complement Med Ther. 2024. PMID: 38195460 Free PMC article.
-
ATR inhibition sensitizes liposarcoma to doxorubicin by increasing DNA damage.Am J Cancer Res. 2022 Apr 15;12(4):1577-1592. eCollection 2022. Am J Cancer Res. 2022. PMID: 35530299 Free PMC article.
-
Doxorubicin-An Agent with Multiple Mechanisms of Anticancer Activity.Cells. 2023 Feb 19;12(4):659. doi: 10.3390/cells12040659. Cells. 2023. PMID: 36831326 Free PMC article. Review.
References
-
- Aarts M, Sharpe R, Garcia-Murillas I, Gevensleben H, Hurd MS, Shumway SD, et al. Forced mitotic entry of S-phase cells as a therapeutic strategy induced by inhibition of WEE1. Cancer Discov. 2012;2(6):524–39. - PubMed
-
- Alikarami F, Safa M, Faranoush M, Hayat P, Kazemi A. Inhibition of DNA-PK enhances chemosensitivity of B-cell precursor acute lymphoblastic leukemia cells to doxorubicin. Biomed Pharmacother. Elsevier Masson SAS 2017;94:1077–93. - PubMed
-
- Baranski Z, Booij TH, Cleton-Jansen AM, Price LS, Van De Water B, Bovée JVMG, et al. Aven-mediated checkpoint kinase control regulates proliferation and resistance to chemotherapy in conventional osteosarcoma. J Pathol. 2015;236(3):348–59. - PubMed
Publication types
MeSH terms
Substances
LinkOut - more resources
Full Text Sources
Research Materials
Miscellaneous
