

Quercetin Administration Suppresses the Cytokine Storm in Myeloid and Plasmacytoid Dendritic Cells
- PMID: 34361114
- PMCID: PMC8348289
- DOI: 10.3390/ijms22158349
Quercetin Administration Suppresses the Cytokine Storm in Myeloid and Plasmacytoid Dendritic Cells
Abstract
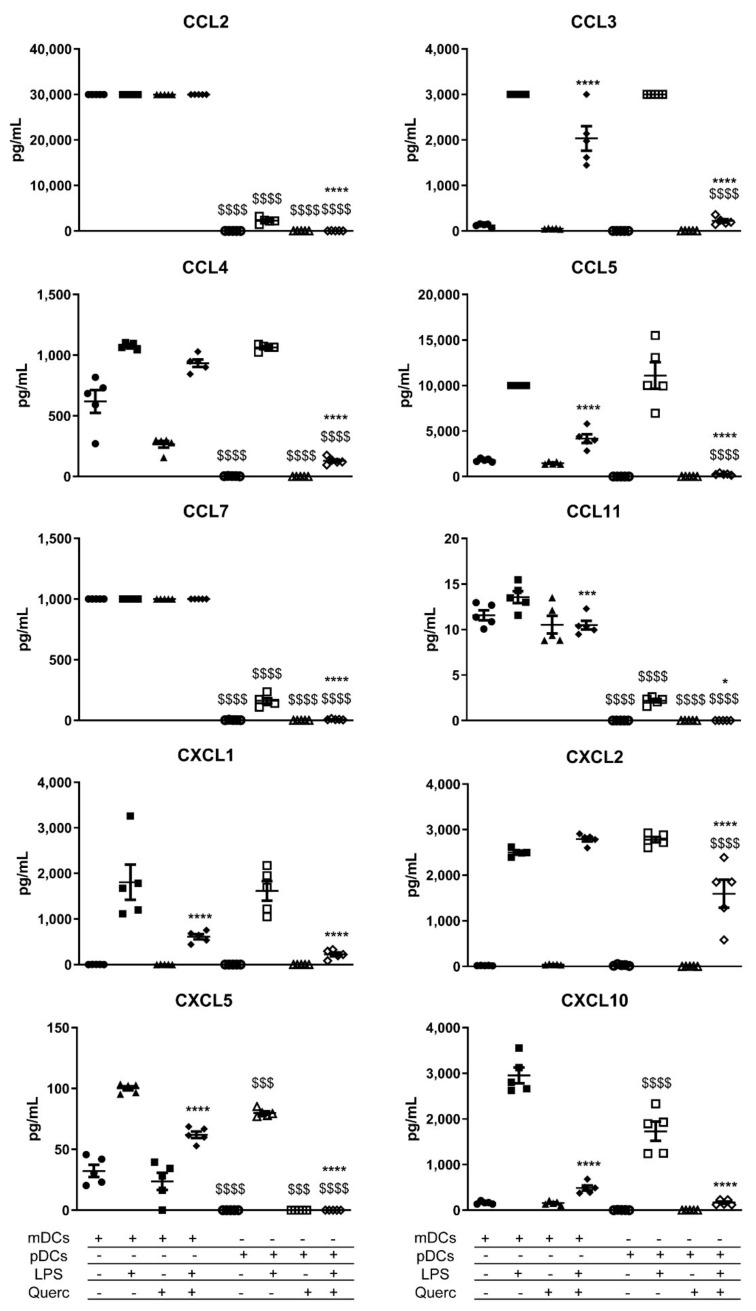
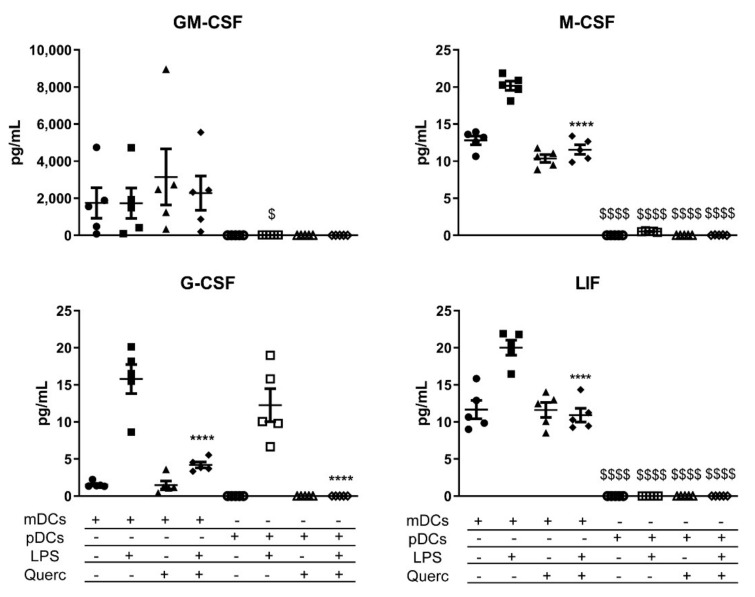
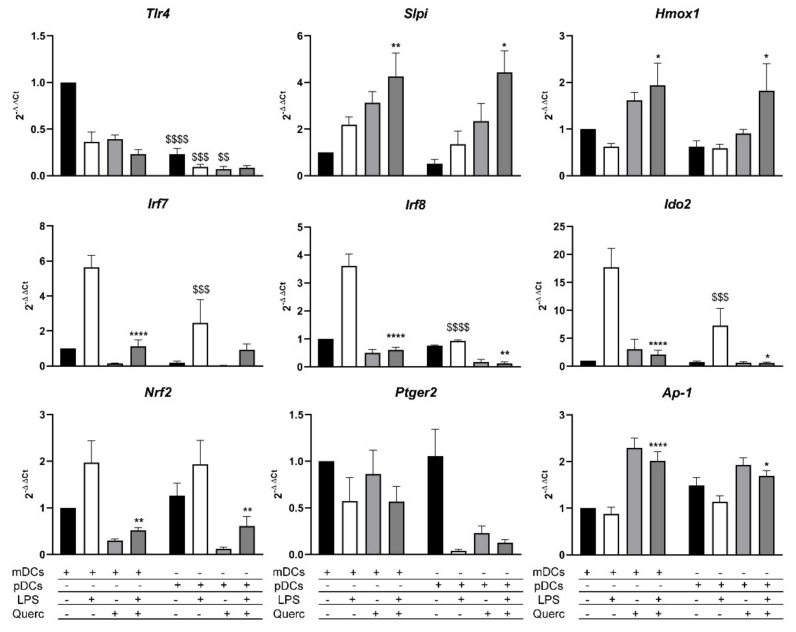
Dendritic cells (DCs) can be divided by lineage into myeloid dendritic cells (mDCs) and plasmacytoid dendritic cells (pDCs). They both are present in mucosal tissues and regulate the immune response by secreting chemokines and cytokines. Inflammatory bowel diseases (IBDs) are characterized by a leaky intestinal barrier and the consequent translocation of bacterial lipopolysaccharide (LPS) to the basolateral side. This results in DCs activation, but the response of pDCs is still poorly characterized. In the present study, we compared mDCs and pDCs responses to LPS administration. We present a broad panel of DCs secreted factors, including cytokines, chemokines, and growth factors. Our recent studies demonstrated the anti-inflammatory effects of quercetin administration, but to date, there is no evidence about quercetin's effects on pDCs. The results of the present study demonstrate that pDCs can respond to LPS and that quercetin exposure modulates soluble factors release through the same molecular pathway used by mDCs (Slpi, Hmox1, and AP-1).
Keywords: cytokines; dendritic cells; plasmacytoid; quercetin; slpi.
Conflict of interest statement
The authors declare no conflict of interest.
Figures
Similar articles
-
Naturally produced type I IFNs enhance human myeloid dendritic cell maturation and IL-12p70 production and mediate elevated effector functions in innate and adaptive immune cells.Cancer Immunol Immunother. 2018 Sep;67(9):1425-1436. doi: 10.1007/s00262-018-2204-2. Epub 2018 Jul 13. Cancer Immunol Immunother. 2018. PMID: 30019146 Free PMC article.
-
Secretory Leukoprotease Inhibitor (Slpi) Expression Is Required for Educating Murine Dendritic Cells Inflammatory Response Following Quercetin Exposure.Nutrients. 2017 Jul 6;9(7):706. doi: 10.3390/nu9070706. Nutrients. 2017. PMID: 28684695 Free PMC article.
-
Human plasmacytoid dendritic cells efficiently cross-present exogenous Ags to CD8+ T cells despite lower Ag uptake than myeloid dendritic cell subsets.Blood. 2013 Jan 17;121(3):459-67. doi: 10.1182/blood-2012-06-435644. Epub 2012 Dec 4. Blood. 2013. PMID: 23212525
-
Myeloid dendritic cells: Development, functions, and role in atherosclerotic inflammation.Immunobiology. 2015 Jun;220(6):833-44. doi: 10.1016/j.imbio.2014.12.010. Epub 2015 Jan 5. Immunobiology. 2015. PMID: 25595536 Review.
-
Differential migration behavior and chemokine production by myeloid and plasmacytoid dendritic cells.Hum Immunol. 2002 Dec;63(12):1164-71. doi: 10.1016/s0198-8859(02)00755-3. Hum Immunol. 2002. PMID: 12480260 Review.
Cited by
-
Quercetin in the Prevention and Treatment of Coronavirus Infections: A Focus on SARS-CoV-2.Pharmaceuticals (Basel). 2022 Aug 25;15(9):1049. doi: 10.3390/ph15091049. Pharmaceuticals (Basel). 2022. PMID: 36145270 Free PMC article. Review.
-
Emerging Therapeutic Potential of Polyphenols from Geranium sanguineum L. in Viral Infections, Including SARS-CoV-2.Biomolecules. 2024 Jan 19;14(1):130. doi: 10.3390/biom14010130. Biomolecules. 2024. PMID: 38275759 Free PMC article. Review.
-
The Chelating Ability of Plant Polyphenols Can Affect Iron Homeostasis and Gut Microbiota.Antioxidants (Basel). 2023 Mar 3;12(3):630. doi: 10.3390/antiox12030630. Antioxidants (Basel). 2023. PMID: 36978878 Free PMC article. Review.
-
The reservoir of latent HIV.Front Cell Infect Microbiol. 2022 Jul 28;12:945956. doi: 10.3389/fcimb.2022.945956. eCollection 2022. Front Cell Infect Microbiol. 2022. PMID: 35967854 Free PMC article. Review.
-
Non-Celiac Gluten Sensitivity and Protective Role of Dietary Polyphenols.Nutrients. 2022 Jun 28;14(13):2679. doi: 10.3390/nu14132679. Nutrients. 2022. PMID: 35807860 Free PMC article. Review.
References
MeSH terms
Substances
Grants and funding
- GR-2011-02347991/Ministero della Salute
- Ricerca Corrente 2020 IRCCS "S. de Bellis"/Ministero della Salute
- Associazione Malattie Infiammatorie Croniche Intestinali/M.I.Cro
- SiCURA "Soluzioni Innovative per la gestione del paziente e il follow up terapeutico della Colite UlceRosA" (KC3U5Y1)/Regione Puglia
- PO FESR 2014-2020; "Piattaforme tecnologiche di ricerca collaborativa per la lotta alle patologie oncologiche"/Regione Campania
LinkOut - more resources
Full Text Sources
Medical
