Co-culture model of B-cell acute lymphoblastic leukemia recapitulates a transcription signature of chemotherapy-refractory minimal residual disease
- PMID: 34349149
- PMCID: PMC8339057
- DOI: 10.1038/s41598-021-95039-x
Co-culture model of B-cell acute lymphoblastic leukemia recapitulates a transcription signature of chemotherapy-refractory minimal residual disease
Abstract
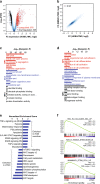
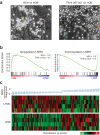
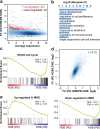
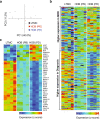
B-cell acute lymphoblastic leukemia (ALL) is characterized by accumulation of immature hematopoietic cells in the bone marrow, a well-established sanctuary site for leukemic cell survival during treatment. While standard of care treatment results in remission in most patients, a small population of patients will relapse, due to the presence of minimal residual disease (MRD) consisting of dormant, chemotherapy-resistant tumor cells. To interrogate this clinically relevant population of treatment refractory cells, we developed an in vitro cell model in which human ALL cells are grown in co-culture with human derived bone marrow stromal cells or osteoblasts. Within this co-culture, tumor cells are found in suspension, lightly attached to the top of the adherent cells, or buried under the adherent cells in a population that is phase dim (PD) by light microscopy. PD cells are dormant and chemotherapy-resistant, consistent with the population of cells that underlies MRD. In the current study, we characterized the transcriptional signature of PD cells by RNA-Seq, and these data were compared to a published expression data set derived from human MRD B-cell ALL patients. Our comparative analyses revealed that the PD cell population is markedly similar to the MRD expression patterns from the primary cells isolated from patients. We further identified genes and key signaling pathways that are common between the PD tumor cells from co-culture and patient derived MRD cells as potential therapeutic targets for future studies.
© 2021. The Author(s).
Conflict of interest statement
The authors declare no competing interests.
Figures


Similar articles
-
B-cell precursor acute lymphoblastic leukemia elicits an interferon-α/β response in bone marrow-derived mesenchymal stroma.Haematologica. 2024 Jul 1;109(7):2073-2084. doi: 10.3324/haematol.2023.283494. Haematologica. 2024. PMID: 38426282 Free PMC article.
-
Differential impact of minimal residual disease negativity according to the salvage status in patients with relapsed/refractory B-cell acute lymphoblastic leukemia.Cancer. 2017 Jan 1;123(2):294-302. doi: 10.1002/cncr.30264. Epub 2016 Sep 7. Cancer. 2017. PMID: 27602508 Free PMC article.
-
Improving Stratification for Children With Late Bone Marrow B-Cell Acute Lymphoblastic Leukemia Relapses With Refined Response Classification and Integration of Genetics.J Clin Oncol. 2019 Dec 20;37(36):3493-3506. doi: 10.1200/JCO.19.01694. Epub 2019 Oct 23. J Clin Oncol. 2019. PMID: 31644328 Clinical Trial.
-
Detection of residual disease in pediatric B-cell precursor acute lymphoblastic leukemia by comparative phenotype mapping: method and significance.Leuk Lymphoma. 2000 Jul;38(3-4):295-308. doi: 10.3109/10428190009087020. Leuk Lymphoma. 2000. PMID: 10830736 Review.
-
Molecular and cellular mechanisms of chemoresistance in paediatric pre-B cell acute lymphoblastic leukaemia.Cancer Metastasis Rev. 2024 Dec;43(4):1385-1399. doi: 10.1007/s10555-024-10203-9. Epub 2024 Aug 5. Cancer Metastasis Rev. 2024. PMID: 39102101 Free PMC article. Review.
Cited by
-
Molecular Signatures of CB-6644 Inhibition of the RUVBL1/2 Complex in Multiple Myeloma.Int J Mol Sci. 2024 Aug 20;25(16):9022. doi: 10.3390/ijms25169022. Int J Mol Sci. 2024. PMID: 39201707 Free PMC article.
-
Trypanosoma cruzi Antigenic Proteins Shared with Acute Lymphoblastic Leukemia and Neuroblastoma.Pharmaceuticals (Basel). 2022 Nov 17;15(11):1421. doi: 10.3390/ph15111421. Pharmaceuticals (Basel). 2022. PMID: 36422551 Free PMC article.
-
Galectin-1 and Galectin-3 in B-Cell Precursor Acute Lymphoblastic Leukemia.Int J Mol Sci. 2022 Nov 18;23(22):14359. doi: 10.3390/ijms232214359. Int J Mol Sci. 2022. PMID: 36430839 Free PMC article.
-
XX sex chromosome complement modulates immune responses to heat-killed Streptococcus pneumoniae immunization in a microbiome-dependent manner.Res Sq [Preprint]. 2023 Nov 2:rs.3.rs-3429829. doi: 10.21203/rs.3.rs-3429829/v1. Res Sq. 2023. Update in: Biol Sex Differ. 2024 Mar 14;15(1):21. doi: 10.1186/s13293-024-00597-0. PMID: 37961596 Free PMC article. Updated. Preprint.
-
Dose-Specific Intratumoral GM-CSF Modulates Breast Tumor Oxygenation and Antitumor Immunity.J Immunol. 2023 Nov 15;211(10):1589-1604. doi: 10.4049/jimmunol.2300326. J Immunol. 2023. PMID: 37756529 Free PMC article.
References
Publication types
MeSH terms
Substances
Grants and funding
LinkOut - more resources
Full Text Sources
Molecular Biology Databases

