. 2021 Aug 11;8(4):ENEURO.0155-21.2021.
doi: 10.1523/ENEURO.0155-21.2021. Print 2021 Jul-Aug.

MicroRNAs 21 and 199a-3p Regulate Axon Growth Potential through Modulation of Pten and mTo r mRNAs

Affiliations

MicroRNAs 21 and 199a-3p Regulate Axon Growth Potential through Modulation of Pten and mTo r mRNAs

Amar N Kar et al. eNeuro. .

Abstract

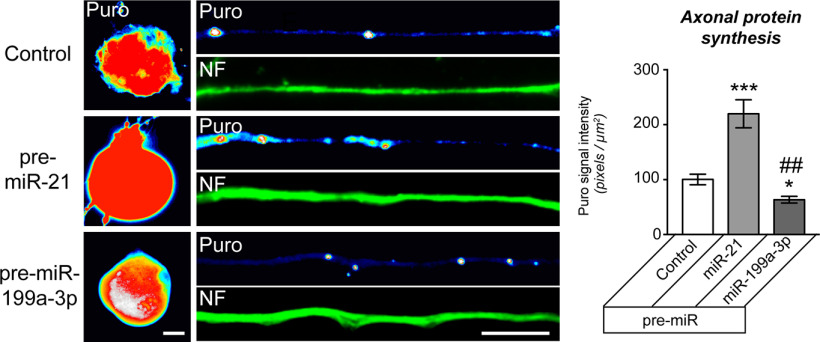
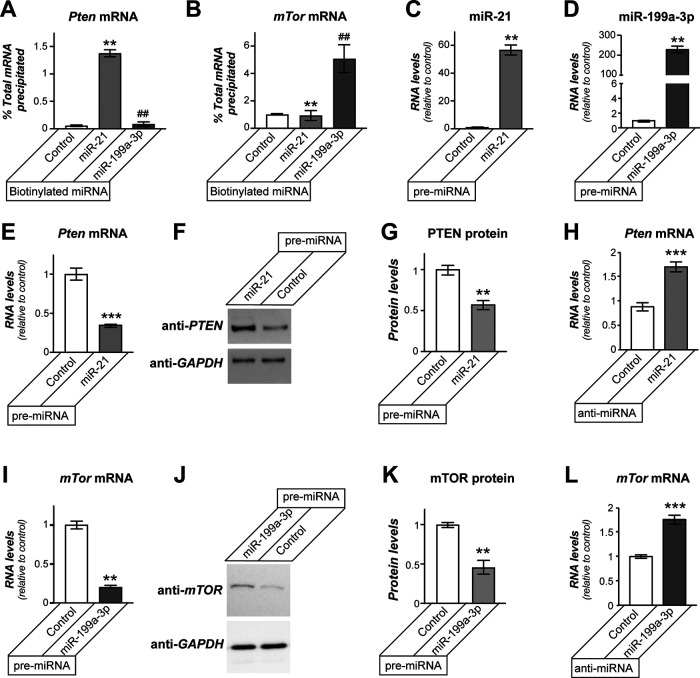
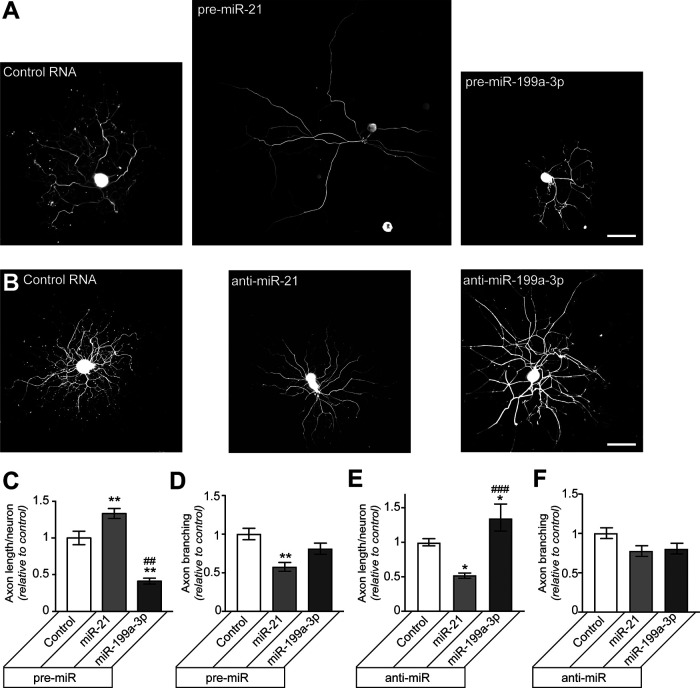
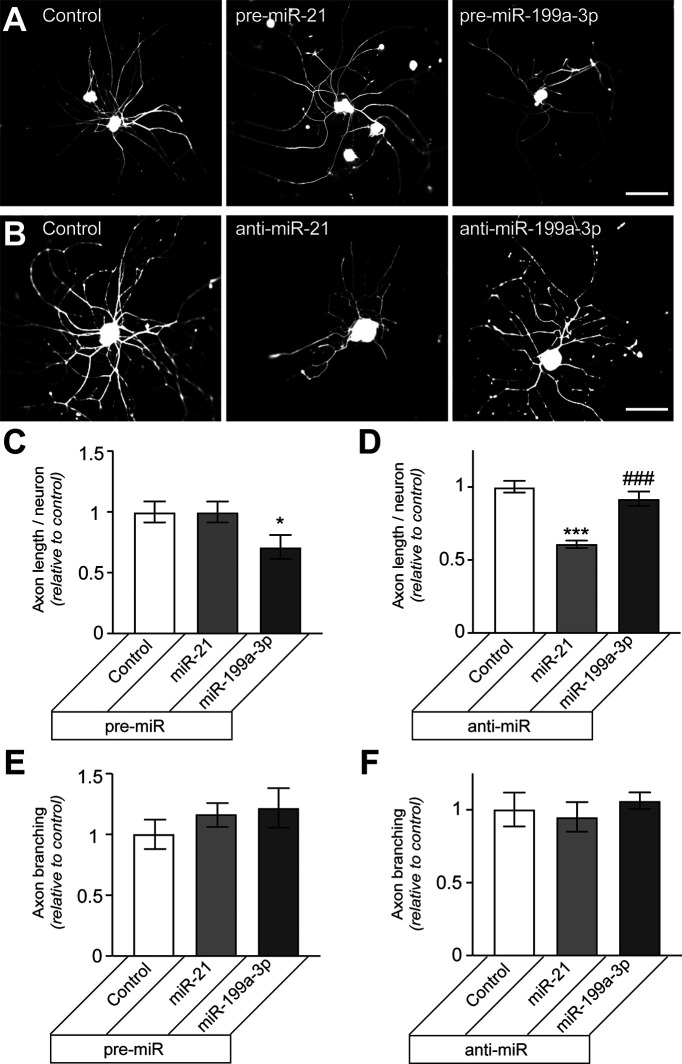
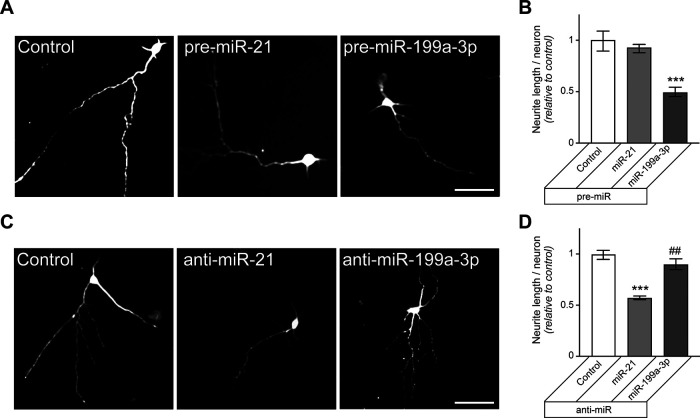
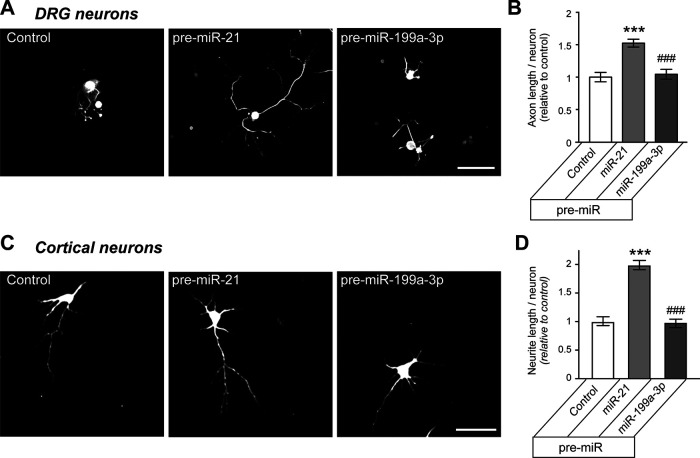
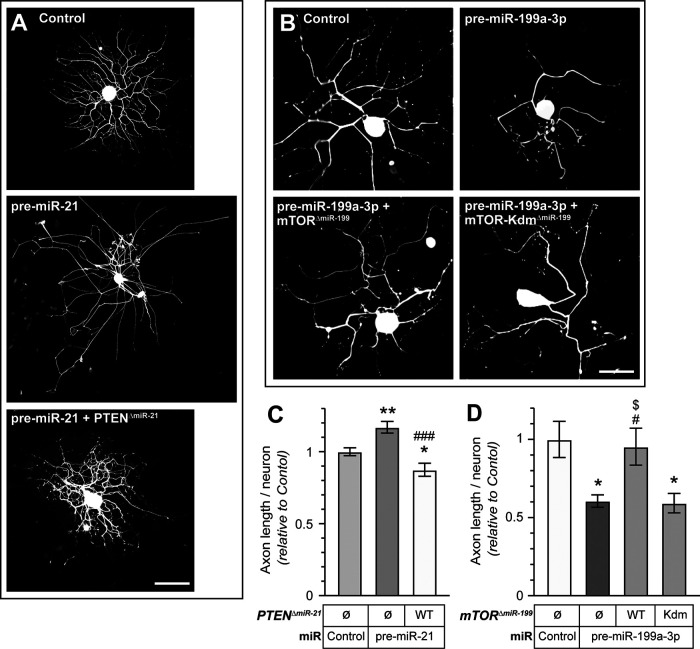
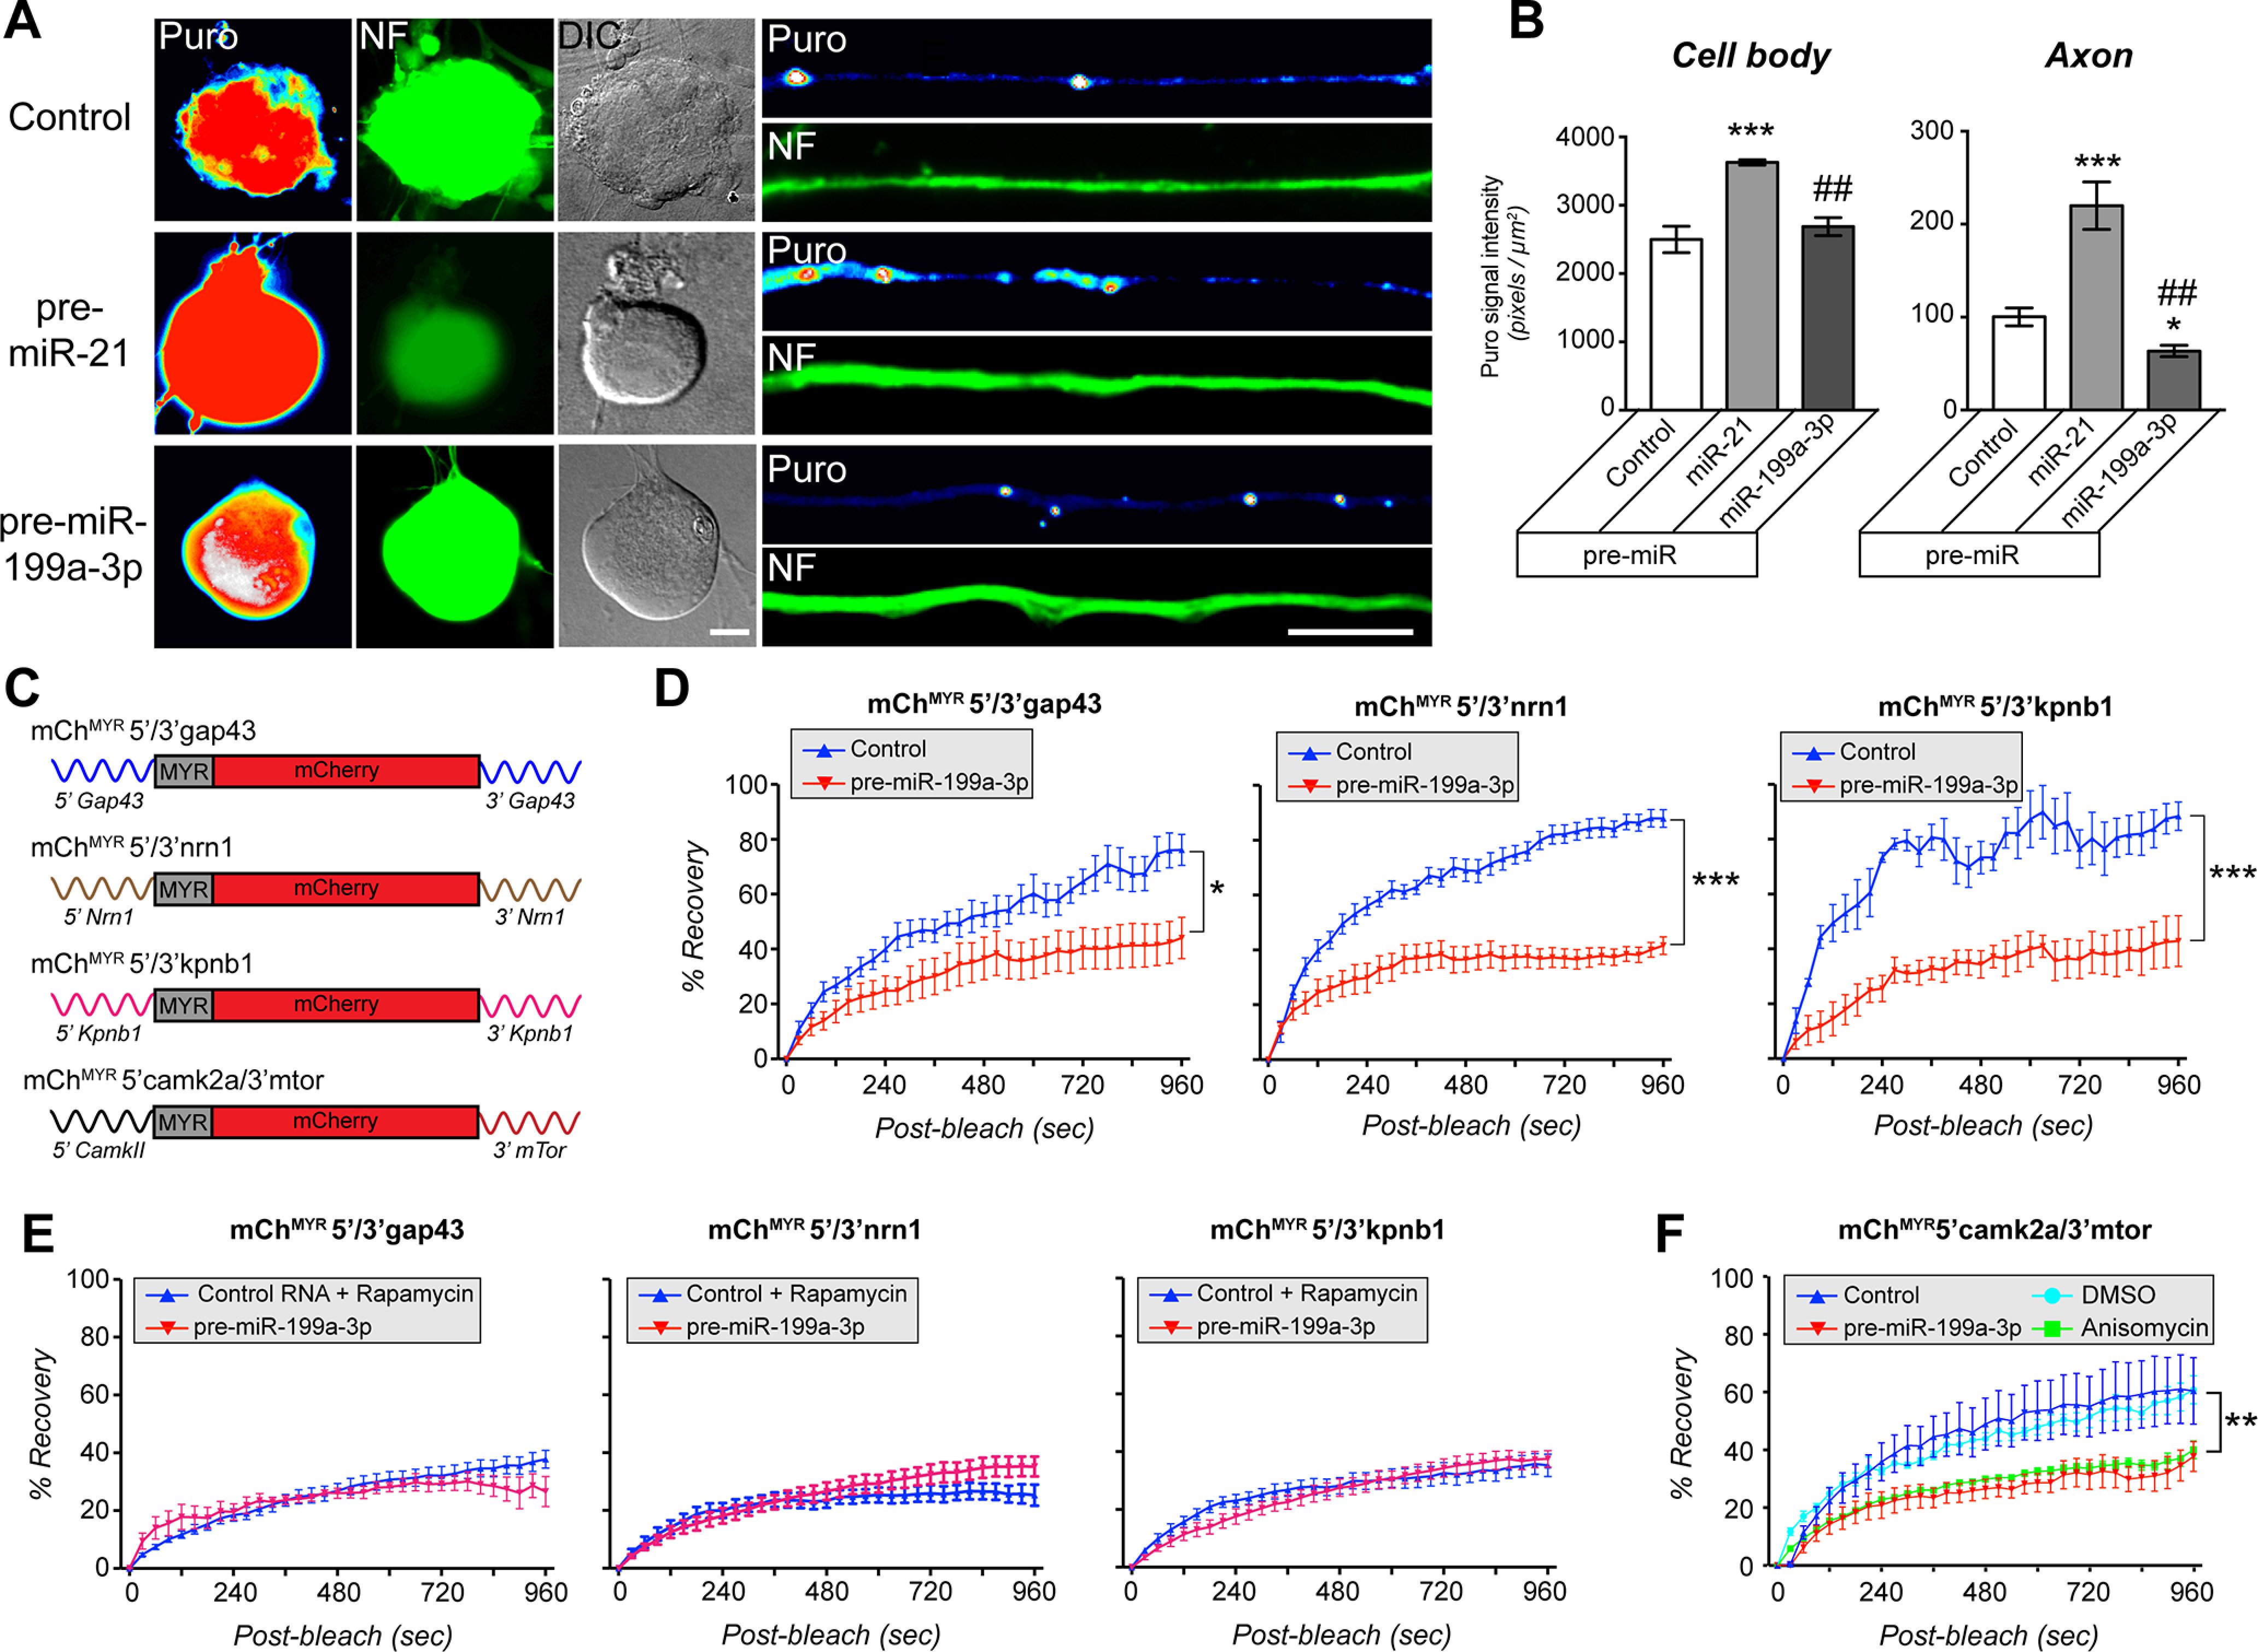
Increased mTOR activity has been shown to enhance regeneration of injured axons by increasing neuronal protein synthesis, while PTEN signaling can block mTOR activity to attenuate protein synthesis. MicroRNAs (miRs) have been implicated in regulation of PTEN and mTOR expression, and previous work in spinal cord showed an increase in miR-199a-3p after spinal cord injury (SCI) and increase in miR-21 in SCI animals that had undergone exercise. Pten mRNA is a target for miR-21 and miR-199a-3p is predicted to target mTor mRNA. Here, we show that miR-21 and miR-199a-3p are expressed in adult dorsal root ganglion (DRG) neurons, and we used culture preparations to test functions of the rat miRs in adult DRG and embryonic cortical neurons. miR-21 increases and miR-199a-3p decreases in DRG neurons after in vivo axotomy. In both the adult DRG and embryonic cortical neurons, miR-21 promotes and miR-199a-3p attenuates neurite growth. miR-21 directly bound to Pten mRNA and miR-21 overexpression decreased Pten mRNA levels. Conversely, miR-199a-3p directly bound to mTor mRNA and miR-199a-3p overexpression decreased mTor mRNA levels. Overexpressing miR-21 increased both overall and intra-axonal protein synthesis in cultured DRGs, while miR-199a-3p overexpression decreased this protein synthesis. The axon growth phenotypes seen with miR-21 and miR-199a-3p overexpression were reversed by co-transfecting PTEN and mTOR cDNA expression constructs with the predicted 3' untranslated region (UTR) miR target sequences deleted. Taken together, these studies indicate that injury-induced alterations in miR-21 and miR-199a-3p expression can alter axon growth capacity by changing overall and intra-axonal protein synthesis through regulation of the PTEN/mTOR pathway.

Keywords: PTEN; axonal mRNA; axonal translation; microRNA; regeneration; translation.


Figures

None
Graphical abstract
Figure 1.
Figure 1.
miR-21 and miR-199a-3p are expressed in adult DRG neurons. A, B, Exposure matched images for endogenous miR-21 (A) or miR-199a-3p (B) plus DAPI in DRG sections derived from adult naive rats. Arrows indicate miR-expressing DRG neurons. Scale bar: 50 μm. C, D, Quantification of mature miR-21 (C) and miR-199a-3p (D) levels in dissociated DRG neurons derived from naive (Na) and 7-d injury-conditioned (Cr) animals by RT-ddPCR analyses shown as average copies ± SEM per ng of RNA input. E, F, Quantification of miR-21 (E) and miR-199a-3p (F) levels in cell bodies and axons isolated from naive and injury conditioned DRG neurons is shown as average copies ± SEM per ng of RNA input (N ≥ 4 for C–F; *p ≤ 0.05, ****p ≤ 0.001 vs naive axon by Student’s t test vs naive axon by Student’s t test).
Figure 2.
Figure 2.
miR-21 and miR-199a-3p target mTor and Pten mRNAs. A, B, RTddPCR for Pten (A) and mTor (B) mRNAs from precipitations of 3’biotinylated miR-21, miR-199a-3p or scrambled RNA (control) transfected DRG neurons is shown as average relative to total input mRNA ± SEM (N ≥ 4; **p ≤ 0.01 vs control and ##p ≤ 0.01 vs miR-21 by one-way ANOVA with pair-wise comparison and Tukey’s post hoc tests). C, D, Transfection of precursor miR-21 and miR-199a-3p (pre-miR-21 and pre-miR-199a-3p, respectively) into DRG neurons increased levels of mature miR-21 (C) and miR-199a-3p levels (D). E–G, DRG cultures transfected with pre-miR-21 showed decrease in Pten mRNA by RTddPCR (E) and PTEN protein by immunoblotting (F, G). F, Representative immunoblot for PTEN protein, with GAPDH immunoblot showing relatively equal loading between lanes. E, K, Average ± SEM. H, Anti-miR-21 transfection in adult DRG neuron cultures increases levels of Pten mRNA. I–K, DRG cultures transfected with pre-miR-199a-3p showed decrease in mTor mRNA by RTddPCR (I) and mTOR protein by immunoblotting (J, K). F, Representative immunoblot for mTOR protein, with GAPDH immunoblot showing relatively equal loading between lanes. I, K, Average values ± SEM. L, Anti-miR-199a-3p transfection in adult DRG neuron cultures increases levels of mTor mRNA (N = 4 for E, H–J; N = 3 for G, K; **p ≤ 0.01 and ***p ≤ 0.005, vs control by Student’s t test).
Figure 3.
Figure 3.
Changing miR-21 and miR-199a-3p levels alters axon growth in DRG neurons. A, B, Representative immunofluorescent images for NF in rat DRG cultures transfected with indicated pre-miRs versus scrambled RNA (control; A) or anti-miRs versus scrambled RNA (B) are shown. C, D, Total axon length per neuron (C) and axon branching (D) are shown for DRG neurons transfected with pre-miRs as in A as average ± SEM relative to scrambled RNA transfection. E, F, Total axon length per neuron (E) and axon branching (F) are shown DRG neurons transfected with anti-miRs as in B as average ± SEM relative to control (n ≥ 100 neurons each over 3 experimental replicates for C–F; **p ≤ 0.01 vs control and ##p ≤ 0.01, ###p ≤ 0.005 comparing between pre-miRs and anti-miRs using one-way ANOVA with pair-wise comparison and Tukey’s post hoc tests). Scale bars: 100 μm (A, B).
Figure 4.
Figure 4.
Overexpressing miR-199a-3p or blocking miR-21 decrease axon growth in injury-conditioned DRG neurons. A, B, Representative immunofluorescent images for NF in rat L4-5 DRG neurons that were injury conditioned by sciatic nerve crush 7 d before culture are shown. A, DRGs transfected with indicated pre-miRs versus scrambled RNA (control). B, DRGs transfected with anti-miRs versus scrambled RNA. C, D, Total axon length per neuron is shown for the injury conditioned DRG neurons that were transfected with the indicated pre-miRs (C) or anti-miRs (D) as average ± SEM relative to control. E, F, Axon branching for injury-conditioned neurons transfected with the indicated pre-miRs (E) or anti-miRs (F) shown as average ± SEM relative to control (n ≥ 150 neurons each over 3 experimental replicates for C–F; *p ≤ 0.05 and ***p ≤ 0.005 vs control and ###p ≤ 0.005 comparing between pre-miRs and anti-miRs using one-way ANOVA with pair-wise comparison and Tukey’s post hoc tests; no significant differences were for axon branching). Scale bars: 100 μm (A, B).
Figure 5.
Figure 5.
miR-21 and miR-199a-3p levels alter neurite growth in cortical neurons. A, B, Representative immunofluorescent images for NF-stained E18 cortical neurons transfected with indicated pre-miRs versus scrambled RNA (control) are shown in A. Total neurite length per transfected neuron is shown in B as average ± SEM relative to control (n ≥ 95 each over 3 experimental replicates; ***p ≤ 0.0001 vs control and pre-miR-21 by one-way ANOVA with pair-wise comparison and Tukey’s post hoc tests). C, D, Representative NF immunofluorescent images for E18 cortical neurons transfected with indicated anti-miRs versus or scrambled RNA are shown in C. Total neurite length per transfected neuron is shown in D as average ± SEM relative to control (N ≥ 95 each over 3 experimental replicates for B, D; ***p ≤ 0.001 vs control and ##p ≤ 0.005 vs anti-miR-21 by one-way ANOVA with pair-wise comparison and Tukey’s post hoc tests). Scale bars: 50 μm (A, B).
Figure 6.
Figure 6.
miR-21 overexpression supports neurite growth on non-permissive aggrecan substrate. A, B, Representative immunofluorescent images for NF in adult DRG cultures transfected with indicated pre-miRs versus scrambled RNA (control) and plated onto aggrecan (CSPG) are shown in A. Total axon length per neuron is shown B as average ± SEM relative to control. C, D, Representative immunofluorescent images for NF in E18 cortical neuron cultures transfected with indicated pre-miRs versus scrambled RNA and plated onto aggrecan (CSPG) are shown in C. Total axon length per neuron is shown D as average ± SEM relative to control (n ≥ 95 over each over 3 experimental replicates for B, D; ***p ≤ 0.005 versus control and ##p ≤ 0.01 and ###p ≤ 0.005 versus miR-21 by one-way ANOVA with pair-wise comparison and Tukey’s post hoc tests). Scale bar: 100 μm (A) and 50 μm (C).
Figure 7.
Figure 7.
Exogenous mTor and Pten overcome the miR-199a-3p and miR-21 axon growth alterations. A, B, Representative immunofluorescent images for NF in adult DRG neurons co-transfected with indicated pre-miRs or scrambled RNA (control) plus expression constructs for plasmids encoding flag-tagged PTEN or mTOR with deletion of the predicted miR-199a-3p and miR-21 target sequences, respective (Pten△miR-21 and mTor△miR-199). Co-transfection with plasmids lacking the PTEN and mTOR coding sequences were used as control for A, B. miR-199a-3p target site deleted kinase-dead mutant mTOR with deletion of predicted miR-199a-3p target sequence (mTOR-Kdm△miR-199) was used in B. C, D, Total axon length per neuron for DRG neurons transfected as in A, B are shown as average ± SEM relative to control (N ≥ 50 neurons over 3 experimental replicates; *p ≤ 0.05 and **p ≤ 0.01 vs control, #p ≤ 0.05 and ###p ≤ 0.005 vs miR-21, and $p ≤ 0.05 vs mTOR-Kdm by one-way ANOVA with pair-wise comparison and Tukey’s post hoc tests). Scale bars: 100 μm (A, B).
Figure 8.
Figure 8.
miR-199a-3p and miR-21 modulate neuronal protein synthesis. A, B, Representative fluorescent images for puromycin (Puro) incorporation in DRG neurons transfected with indicated pre-miRs or scrambled RNA (control) and treated with OPP are shown for cell bodies (left three columns) distal axons (right column). OPP incorporation was detected by labeling with Alexa Fluor 594 using the Click chemistry. B, Average puromycin incorporation in cell bodies and axons (N ≥ 50 axons each over 3 experimental replicates; *p ≤ 0.001, ***p ≤ 0.001 vs control and ##p ≤ 0.005 vs miR-21 by one-way ANOVA with pairwise comparison and Tukey’s HSD post hoc tests). Scale bars: 10 μm. C, Schematics of intra-axonal translation reporter constructs used for FRAP experiments for panels D–F and Extended Data Figure 8-1. D, E, Quantitation of FRAP sequences for distal axons of DRGs expressing mChMYR5’/3’gap43, mChMYR5’/3’nrn1, or mChMYR5’/3’kpnb1 mRNAs that were cotransfected with pre-miR-199a-3p or scrambled RNA are shown. Axonal mCherry fluorescent recovery for each reporter was significantly attenuated by miR-199a-3p overexpression. Values shown as normalized average % recovery ± SEM; representative image sequences shown in Extended Data Figure 8-1. E, FRAP analysis for mChMYR5’/3’gap43, mChMYR5’/3’nrn1, or mChMYR5’/3’kpnb1 mRNA expressing DRG neurons that were transfected with scrambled RNA and treated with rapamycin 2 h before FRAP show diminished fluorescence recovery comparable to miR-199a-3p overexpression. Values shown as normalized average % recovery ± SEM; representative image sequences shown in Extended Data Figure 8-1. F, FRAP analyses for distal axons of mChMYR5’camkII/3’mtor mRNA expressing adult DRG transfected with either pre-miR-199a-3p or scrambled RNA are shown. Data are shown as normalized average % recovery ± SEM and representative image sequences shown in Extended Data Figure 8-1. Scrambled RNA transfected neurons were also analyzed after treatment with anisomycin or vehicle control (DMSO), with the anisomycin-treated neurons indicating translation dependence for the recovery (N ≥ 13 axons over ≥ 3 experimental replicates for D–F; *p ≤ 0.01, **p ≤ 0.005, ***p ≤ 0.001 by one-way ANOVA with pairwise comparison and Tukey’s HSD post hoc tests).

Similar articles

Cited by

References

    1. Abe N, Borson SH, Gambello MJ, Wang F, Cavalli V (2010) mTOR activation increases axonal growth capacity of injured peripheral nerves. J Biol Chem 285:28034–28043. 10.1074/jbc.M110.125336 - DOI - PMC - PubMed
    1. Al-Ali H, Ding Y, Slepak T, Wu W, Sun Y, Martinez Y, Xu XM, Lemmon VP, Bixby JL (2017) The mTOR substrate S6 kinase 1 (S6K1) is a negative regulator of axon regeneration and a potential drug target for central nervous system injury. J Neurosci 37:7079–7095. 10.1523/JNEUROSCI.0931-17.2017 - DOI - PMC - PubMed
    1. Bae B, Miura P (2020) Emerging roles for 3' UTRs in neurons. Int J Mol Sci 21:3413. 10.3390/ijms21103413 - DOI - PMC - PubMed
    1. Biever A, Valjent E, Puighermanal E (2015) Ribosomal protein S6 phosphorylation in the nervous system: from regulation to function. Front Molec Neurosci 8:75. - PMC - PubMed
    1. Cannoy J, Crowley S, Jarratt A, Werts KL, Osborne K, Park S, English AW (2016) Upslope treadmill exercise enhances motor axon regeneration but not functional recovery following peripheral nerve injury. J Neurophysiol 116:1408–1417. 10.1152/jn.00129.2016 - DOI - PMC - PubMed

Publication types