. 2021 Jul 23;12(1):4504.
doi: 10.1038/s41467-021-24461-6.

Quantitative imaging of transcription in living Drosophila embryos reveals the impact of core promoter motifs on promoter state dynamics

Affiliations

Quantitative imaging of transcription in living Drosophila embryos reveals the impact of core promoter motifs on promoter state dynamics

Virginia L Pimmett et al. Nat Commun. .

Abstract

Genes are expressed in stochastic transcriptional bursts linked to alternating active and inactive promoter states. A major challenge in transcription is understanding how promoter composition dictates bursting, particularly in multicellular organisms. We investigate two key Drosophila developmental promoter motifs, the TATA box (TATA) and the Initiator (INR). Using live imaging in Drosophila embryos and new computational methods, we demonstrate that bursting occurs on multiple timescales ranging from seconds to minutes. TATA-containing promoters and INR-containing promoters exhibit distinct dynamics, with one or two separate rate-limiting steps respectively. A TATA box is associated with long active states, high rates of polymerase initiation, and short-lived, infrequent inactive states. In contrast, the INR motif leads to two inactive states, one of which relates to promoter-proximal polymerase pausing. Surprisingly, the model suggests pausing is not obligatory, but occurs stochastically for a subset of polymerases. Overall, our results provide a rationale for promoter switching during zygotic genome activation.


Conflict of interest statement

The authors declare no competing interests.

Figures
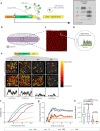
Fig. 1
Fig. 1. A synthetic transgenic platform to image promoter dynamics.
a Schematic view of transgenes used to study transcriptional dynamics of sna, kr, Ilp4, and brk core promoters. A minimal sna enhancer was placed upstream of the core promoter followed by 24xMS2 repeats and a yellow reporter gene. Core promoter motifs are indicated in the inset. b Schematic of Drosophila embryo showing spatial restriction of analysis to presumptive mesoderm (purple). c Maximum intensity projection of representative 15 µm Z-stack of snaE < snaPr < 24xMS2-y (snaE < sna) nc14 embryo showing MS2/MCP-GFP-bound transcriptional foci (GFP) and nuclei (His-RFP). Scale bar is 5 µm. d Sample single-nuclei trace showing GFP fluorescence during nc14. The surface of the green region indicates trace integral amplitude. e False-colored frames from live imaging of indicated promoters showing relative instantaneous fluorescence intensity in early and late nc14. Inactive nuclei are gray and highly active nuclei are in yellow. f Cumulative activation curves of all nuclei during the first 30 min of nc14 for sna (green), kr (purple), Ilp4 (red), and brk (blue). Time zero is from anaphase during nc13-nc14 mitosis. g Average instantaneous fluorescence of transcriptional foci of active nuclei during the first 30 min of nc14 for sna (green), kr (purple), Ilp4 (red), and brk (blue). Time zero is from anaphase during nc13-nc14 mitosis. h Distribution of individual trace integral amplitudes from first 30 min of nc14 for sna (green), kr (purple), Ilp4 (red), and brk (blue). The intensity amplitude at a given time may result from the overlap of several bursts and is a convolution of promoter active/inactive times, polymerase initiation frequency, and the duration of a single polymerase signal. The integral amplitude estimates the transcriptional activity and the total number of transcripts at a steady state; it is proportional to the probability of active state (pON) initiation rate (kINI) and to the duration of the signal. Solid lines represent median and dashed lines first and third quartiles, using a one-tailed Kruskal–Wallis test for significance with multiple comparison adjustments. Statistics: snaE < sna, 216 nuclei, 3 movies; snaE < kr, 243 nuclei, 4 movies; snaE < Ilp4, 114 nuclei, 2 movies; snaE < brk, 45 nuclei, 2 movies. See Supplementary Movies 1 and 5.
Fig. 2
Fig. 2. From live imaging of transcription to positions of initiation events, a machine-learning procedure.
a Representative trace of a single-nucleus transcriptional activity. The gray box indicates the analyzed transcriptional window, the black curve represents the signal expressed as the number of polymerases, and the red curve the reconstructed signal after the deconvolution procedure. b Fluorescence intensity at the transcription site is a function of the passage of a single polymerase as well as the number of polymerase initiation events. c A genetic algorithm is used to decompose fluorescence intensities and optimally locate polymerases within the gene body. d For each nucleus, the position of polymerases is used to extract Δt, the lag time between two successive initiation events. e Simulated representative trace (orange) and the number of polymerases after deconvolution (blue). f Known positions of polymerases (orange) and reconstructed polymerase positioning after deconvolution. g Nonparametric (green) and parametric (blue) survival function estimate for simulated data estimated using the Kaplan–Meyer method. The shaded region indicates 95% confidence interval estimated based on Greenwood’s formula. h Comparison of known parameters used to generate artificial data (real parameter) with parameters obtained by applying our analysis pipeline (estimated parameters). Red line indicates perfect concordance. i Heatmap showing the number of polymerases for the 216 snaE < sna nuclei as a function of time. Each row represents one nucleus, and the number of Pol II initiation events per 30 s bin is indicated by the bin color. j A representative population from i. k Survival function of the distribution of waiting times between polymerase initiation events (red circles) and the two-exponential fitting of the population estimated using the Kaplan–Meyer method (black line). The shaded region indicates 95% confidence interval estimated based on Greenwood’s formula (see Supplementary Table 1). A green check indicates accepted fitting. l A two-state model showing the probabilities to be in either the permissive ON state or the inactive OFF state for the snaE < sna transgene. m Representation of estimated bursting dynamics for the snaE < sna transgene. Permissive ON state durations are depicted in green and inactive OFF states in red, and probabilities of each state shown above (see also Supplementary Table 2). Statistics: snaE < sna, 216 nuclei, 3 movies; see Supplementary Movie 1.
Fig. 3
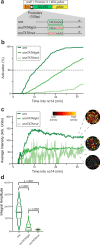
Fig. 3. Decoding the role of the TATA box on promoter dynamics.
a TATA box mutations of the sna promoter. The snaTATAlight mutation corresponds to the sequence of the non-canonical TATA box from the kr promoter. b Cumulative active nuclei percentage within the mesodermal domain for sna (dark green), snaTATAlight (green), and snaTATAmut (light green). c Average instantaneous fluorescence of transcriptional foci of active nuclei during the first 30 min of nc14 for sna (dark green), snaTATAlight (green), and snaTATAmut (light green). Time zero is from anaphase during nc13-nc14 mitosis. False-colored panels on the right are colored according to instantaneous fluorescence intensity, with inactive nuclei shown in gray and highly active nuclei in yellow. d Distribution of individual trace integral amplitudes from first 30 min of nc14. The solid line represents median and dashed lines the first and third quartiles, using a one-tailed Kruskal–Wallis test for significance with multiple comparison adjustments. Statistics: snaE < sna, 216 nuclei, 3 movies; snaE < snaTATAlight, 353 nuclei, 6 movies; snaE < snaTATAmut, 21 nuclei, 3 movies. See Supplementary Movies 1–3.
Fig. 4
Fig. 4. TATA box motif leads to long durations of a permissive promoter state.
ac Representative traces of single-nuclei transcriptional activities for the indicated genotypes. Gray boxes indicate the analyzed transcriptional windows, black curves represent the signal expressed as the number of polymerases, and red curves represent the reconstructed signal after the deconvolution procedure. df Heatmaps indicating the number of polymerases during nc14 for each genotype. gi Representation of estimated bursting parameters for sna (g), snaTATAlight (h), and snaTATAmut (i) promoters (see also Supplementary Table 1 and Supplementary Table 2). j Duration and probability of the permissive ON state. Error bars represent the smallest and largest values in optimal and close to optimal solutions (see “Methods”). k Duration and probability of the OFF state. Error bars represent the smallest and largest values in optimal and close to optimal solutions (see “Methods”). l Estimated burst size calculated as kINI/kOFF using the optimal kinetic parameters (Supplementary Table 2). Statistics: snaE < sna, 216 nuclei, 3 movies; snaE < snaTATAlight, 353 nuclei, 6 movies; snaE < snaTATAmut, 21 nuclei, 3 movies. See Supplementary Movies 1–3 and Supplementary Table 2.
Fig. 5
Fig. 5. Decoding the role of the Initiator motif on promoter dynamics.
a Schematic of the transgenes used to decipher the impact of the INR motif. The sna core promoter has the TSS region replaced with the INR of kr (sna+INR), and the kr core promoter INR motif is replaced with the TSS region of sna (kr-INR1). b Cumulative active nuclei percentage within the mesodermal domain for sna (green), sna+INR (yellow), kr (purple), and kr-INR1 (pink). c Average instantaneous fluorescence of transcriptional foci of active nuclei during the first 30 min of nc14 for sna (green), sna+INR (yellow), kr (purple), and kr-INR1 (pink). Time zero is from anaphase during nc13-nc14 mitosis. False-colored panels on right are colored according to instantaneous fluorescence intensity with inactive nuclei in gray and highly active nuclei in yellow. d Distribution of individual trace integral amplitudes from first 30 min of nc14 for sna (green), sna+INR (yellow), kr (purple), and kr-INR1 (pink). The solid line represents the median, and dashed lines represent the first and third quartiles, using a one-tailed Kruskal–Wallis test for significance with multiple comparison adjustments. Statistics: snaE < sna, 216 nuclei, 3 movies; snaE < sna+INR, 236 nuclei, 4 movies; snaE < kr, 243 nuclei, 4 movies; snaE < kr-INR1, 342 nuclei, 5 movies. See Supplementary Movies 1, 4–6.
Fig. 6
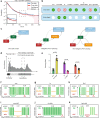
Fig. 6. The INR motif induces an extra promoter state related to pausing.
a Survival function of the distribution of waiting times between polymerase initiation events (gray circles). Two-exponential fitting of the population (blue line), and three-exponential fitting (red line) estimated using the Kaplan–Meyer method. The shaded region represents 95% confidence interval estimated based on Greenwood’s formula (see also Supplementary Table 1). b Table indicating the most parsimonious number of states required to fit each indicated genotype (see also Supplementary Table 1). A green check indicates an accepted fitting. c Schema of the two-state telegraph model, a three-state model with obligatory pausing, and a three-state model with non-obligatory pausing. d Pausing index calculation. e Pausing index of indicated transgenes measured by ChIP-qPCR (average + SD), n = 4 biological replicates with a Mann–Whitney test. fk Representation of sna, sna+INR, kr, kr-inr1, Ilp4, and Ilp4-INR estimated bursting dynamics. Permissive ON states are in green, inactive PAUSE states in orange, and inactive OFF states in red. Statistics: snaE < sna, 216 nuclei, 3 movies; snaE < sna+INR, 236 nuclei, 4 movies; snaE < kr, 243 nuclei, 4 movies; snaE < kr-INR1, 342 nuclei, 5 movies, snaE < snaTATAlight, 353 nuclei, 6 movies; snaE < snaTATAlight+INR, 193 nuclei, 3 movies; snaE < Ilp4, 114 nuclei, 2 movies; snaE < Ilp4-INR, 48 nuclei, 2 movies. See Supplementary Movies 1, 4–6, Supplementary Table 2.

Similar articles

Cited by

References

    1. Vo Ngoc L, Kassavetis GA, Kadonaga JT. The RNA polymerase II core promoter in Drosophila. Genetics. 2019;212:13–24. doi: 10.1534/genetics.119.302021. - DOI - PMC - PubMed
    1. Bhuiyan T, Timmers HTM. Promoter recognition: putting TFIID on the spot. Trends Cell Biol. 2019;29:752–763. doi: 10.1016/j.tcb.2019.06.004. - DOI - PubMed
    1. Cramer P. Organization and regulation of gene transcription. Nature. 2019;573:45–54. doi: 10.1038/s41586-019-1517-4. - DOI - PubMed
    1. Gupta K, Sari-ak D, Haffke M, Trowitzsch S, Berger I. Zooming in on transcription preinitiation. J. Mol. Biol. 2016;428:2581–2591. doi: 10.1016/j.jmb.2016.04.003. - DOI - PMC - PubMed
    1. Patel AB, Greber BJ, Nogales E. Recent insights into the structure of TFIID, its assembly, and its binding to core promoter. Curr. Opin. Struct. Biol. 2020;61:17–24. doi: 10.1016/j.sbi.2019.10.001. - DOI - PMC - PubMed

Publication types

MeSH terms

Substances

LinkOut - more resources