

Tudor staphylococcal nuclease is a docking platform for stress granule components and is essential for SnRK1 activation in Arabidopsis
- PMID: 34287990
- PMCID: PMC8447601
- DOI: 10.15252/embj.2020105043
Tudor staphylococcal nuclease is a docking platform for stress granule components and is essential for SnRK1 activation in Arabidopsis
Abstract
Tudor staphylococcal nuclease (TSN; also known as Tudor-SN, p100, or SND1) is a multifunctional, evolutionarily conserved regulator of gene expression, exhibiting cytoprotective activity in animals and plants and oncogenic activity in mammals. During stress, TSN stably associates with stress granules (SGs), in a poorly understood process. Here, we show that in the model plant Arabidopsis thaliana, TSN is an intrinsically disordered protein (IDP) acting as a scaffold for a large pool of other IDPs, enriched for conserved stress granule components as well as novel or plant-specific SG-localized proteins. While approximately 30% of TSN interactors are recruited to stress granules de novo upon stress perception, 70% form a protein-protein interaction network present before the onset of stress. Finally, we demonstrate that TSN and stress granule formation promote heat-induced activation of the evolutionarily conserved energy-sensing SNF1-related protein kinase 1 (SnRK1), the plant orthologue of mammalian AMP-activated protein kinase (AMPK). Our results establish TSN as a docking platform for stress granule proteins, with an important role in stress signalling.
Keywords: SnRK1/SNF1/AMPK; heat stress; intrinsically disordered regions; stress granules; tudor staphylococcal nuclease.
© 2021 The Authors. Published under the terms of the CC BY 4.0 license.
Conflict of interest statement
The authors declare that they have no conflict of interest.
Figures
- A
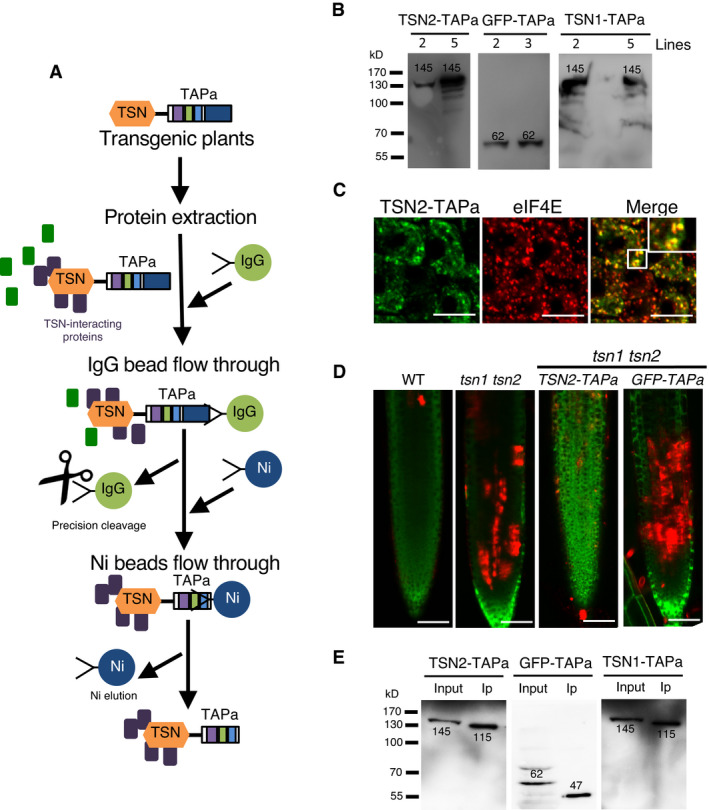
Schematic representation of the TAPa procedure. During the first affinity purification step, plant protein extracts are incubated with IgG beads followed by elution through the specific cleavage of TAPa tag with the low‐temperature active rhinovirus 3C protease. At the second affinity purification step, IgG bead eluates are incubated with Ni beads followed by the elution of proteins from beads using an imidazole‐containing buffer.
- B
Expression of TSN‐TAPa or GFP‐TAPa in 10‐day‐old Arabidopsis seedling lines was confirmed by immunoblotting with α‐Myc. Each lane was loaded with 20 μg total protein from a crude homogenate. The expected molecular weights (kD) of the expressed proteins are indicated on the blots.
- C
Immuno co‐localization analysis of TSN2‐TAPa (green, α‐Myc) and eIF4E (red, α‐eIF4E) in heat‐stressed (39°C for 60 min) root tip cells of 5‐day‐old Arabidopsis seedlings expressing Pro35S:TSN2‐TAPa. Scale bars = 10 μm.
- D
Five‐day‐old Arabidopsis seedlings expressing Pro35S:TSN2‐TAPa or Pro35S:GFP‐TAPa in the tsn1 tsn2 background were exposed to a long‐term HS treatment (39°C for 4 h), and roots were stained with both FDA (green; indicative of living cells) and SYTOX Orange (red; indicative of dead cells). WT and tsn1 tsn2 were used as controls. The experiment was repeated three times with similar results. Scale bars = 50 μm.
- E
Immunoblotting of crude protein extracts (Input) and purified protein fractions (Ip) obtained during small‐scale TAPa procedure from 10‐day‐old Arabidopsis seedlings expressing TSN‐TAPa or GFP‐TAPa. The numbers on the blots indicate expected molecular weights (kD) of the proteins detected using α‐Myc.
- A
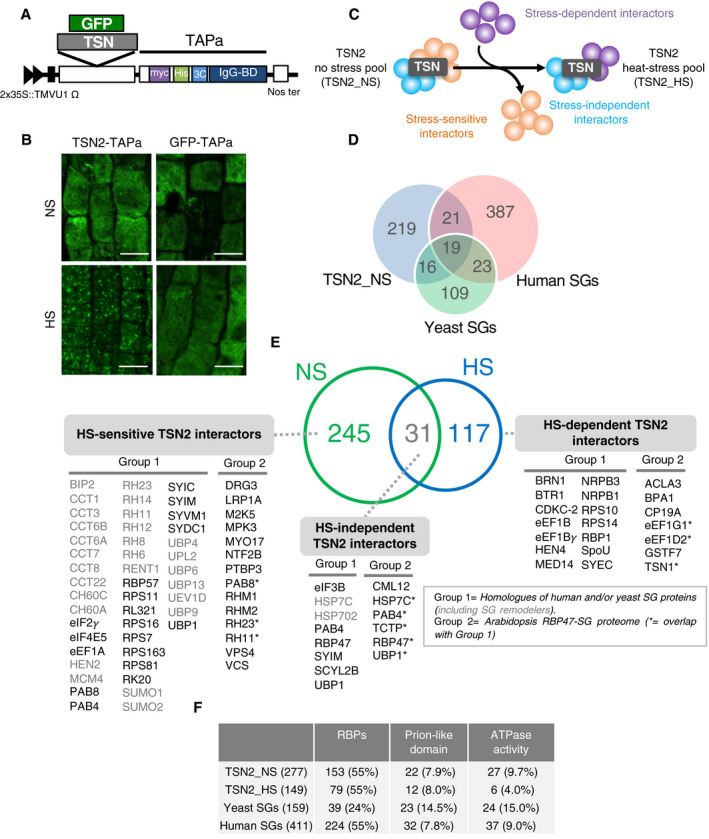
Schematic illustration of the expression cassette in TAPa vector. The vector allows translational fusion of TSN or GFP at their C termini to the TAPa tag. The expression is driven by two copies of the cauliflower mosaic virus 35S promoter (2 × 35S) and a tobacco mosaic virus (TMV) U1 X translational enhancer. The TAPa tag consists of two copies of the protein A IgG‐binding domain (IgG‐BD), an eight amino acid sequence corresponding to the 3C protease cleavage site (3C), a 6‐histidine stretch (His), and nine repeats of the Myc epitope (myc). A Nos terminator (Nos ter) sequence is located downstream of each expression cassette.
- B
Immunolocalization of TSN2‐TAPa and GFP‐TAPa fusion proteins in root cells of 5‐day‐old seedlings. The seedlings were grown under no stress (NS) conditions (23°C) or incubated for 40 min at 39°C (HS) and then immunostained with α‐Myc. Scale bars = 10 μm.
- C
Schematic representation of three classes of TSN‐interacting proteins, i.e. stress‐dependent, stress‐sensitive and stress‐independent interactors, identified upon the comparison of TSN2_NS and TSN2_HS protein pools.
- D
Venn diagram showing the comparison of TSN2_NS interactome with human and yeast SG proteomes (Jain et al, 2016).
- E
Venn diagram showing the comparison between TSN2_NS and TSN2_HS protein pools. TSN2‐interacting proteins are divided into three classes: HS‐sensitive, HS‐independent and HS‐dependent. Within each class, the proteins are further classified into two groups. Group 1 contains known human or yeast SG proteins (Jain et al, 2016), including SG remodellers (marked in grey colour), whereas group 2 represents components of recently isolated Arabidopsis RBP47‐SG proteome (Kosmacz et al, 2019). The full lists of TSN2‐interacting proteins, including previously uncharacterized and potentially novel SG components not belonging to either group 1 or group 2, are provided in Dataset EV1.
- F
Frequency of RBPs and proteins with prion‐like domains or ATPase activity found in TSN2_NS and TSN2_HS protein pools in comparison with yeast and human SG proteomes (Jain et al, 2016).

- A
Comparison between TSN2_HS interactome and both human and yeast SG proteomes (Jain et al, 2016).
- B
Comparison between TSN2_NS and TSN2_HS interactomes and Arabidopsis RBP47‐SG proteome (Kosmacz et al, 2019).
- A
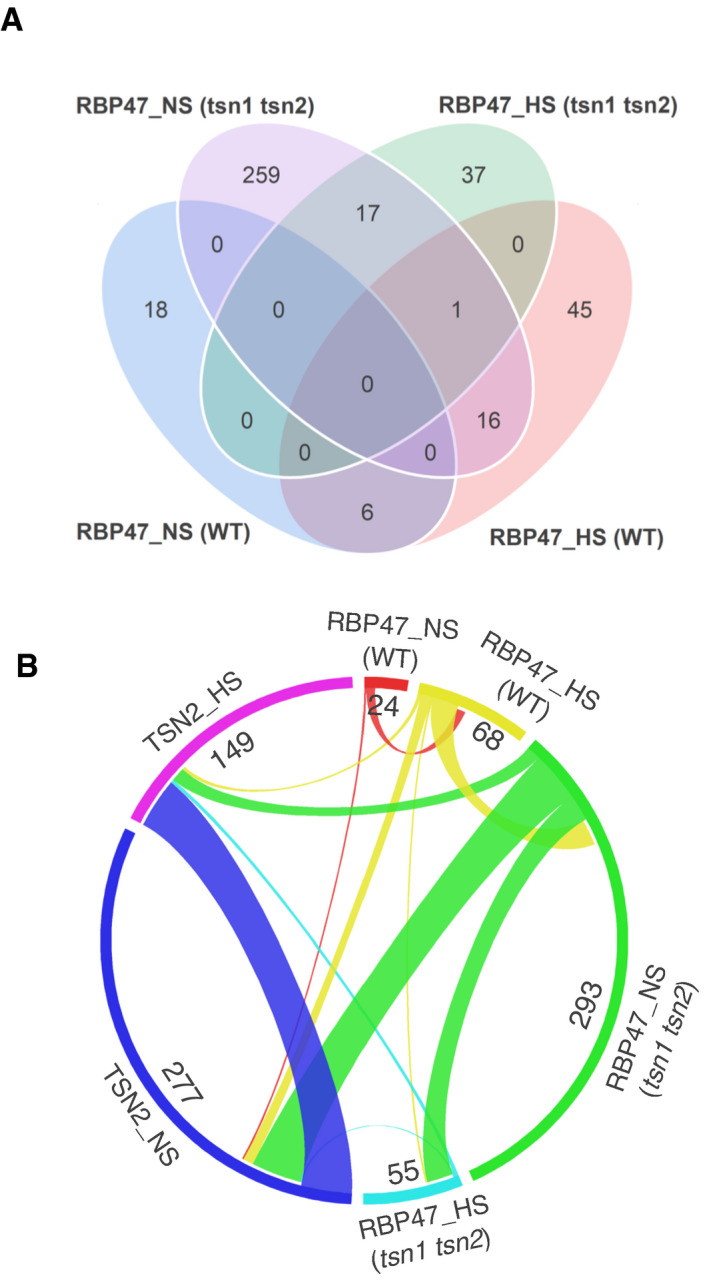
Venn diagram showing the comparison between RBP47_NS and RBP47_HS protein pools isolated from WT and tsn1 tsn2 plants.
- B
Circos plot showing the comparison between four RBP47 interactomes and two TSN2 interactomes.
- A
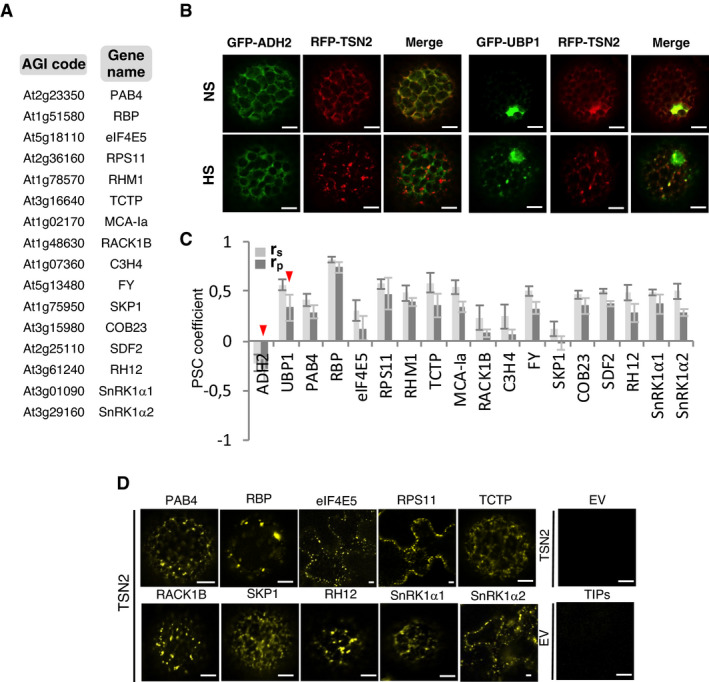
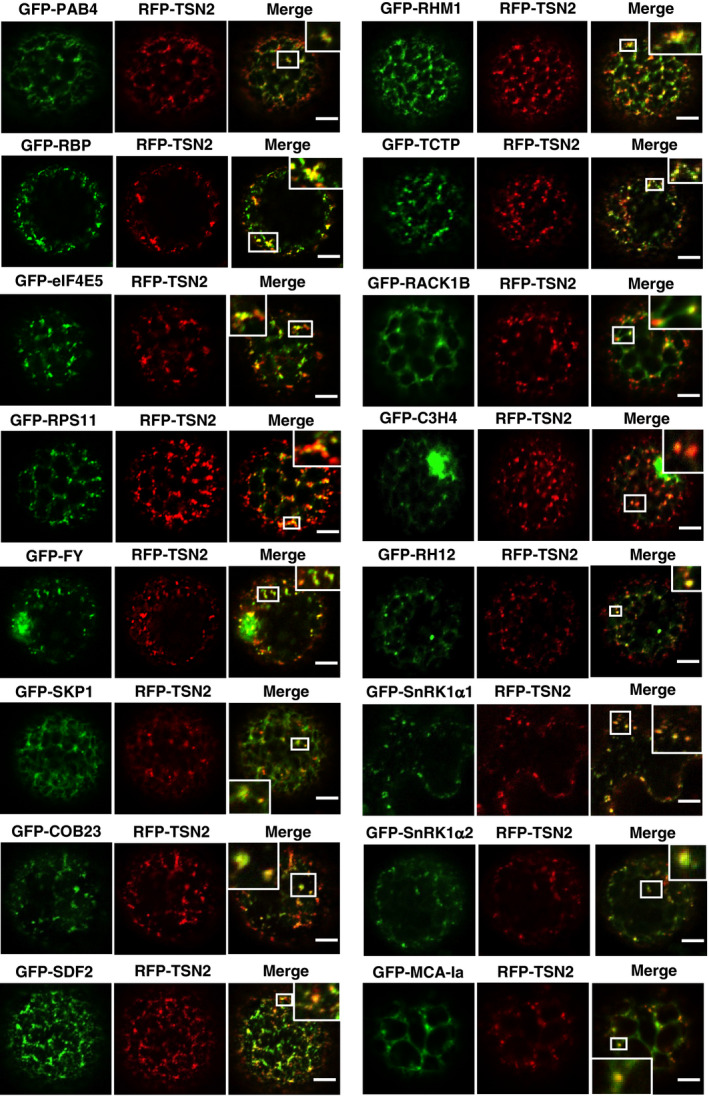
A list of TSN‐interacting proteins selected for the co‐localization analysis.
- B
Co‐localization of RFP‐TSN2 (red) with GFP‐ADH2 (negative control) and GFP‐UBP1 (positive control) in N. benthamiana protoplasts incubated under 23°C (NS) or at 39°C for 40 min (HS). Scale bars = 5 μm.
- C
Pearson and Spearman coefficients (rp and rs, respectively) of co‐localization (PSC) of RFP‐TSN2 with individual GFP‐tagged TSN‐interacting proteins listed in A and with both negative and positive control proteins (denoted by red arrowheads) under HS. Data represent means ± SD of at least five replicate measurements from three independent experiments.
- D
BiFC between cYFP‐TSN2 and nYFP‐TSN‐interacting proteins in N. benthamiana leaf cells or protoplasts after HS (39°C for 40 min). BiFC analysis of cYFP‐TSN2 and nYFP‐TSN‐interacting proteins (TIPs) with empty vectors (EV) encoding nYFP and cYFP, respectively, was used as a negative control. Only one representative example of BiFC between cYFP and nYFP‐TIP is shown. Scale bars = 5 μm.
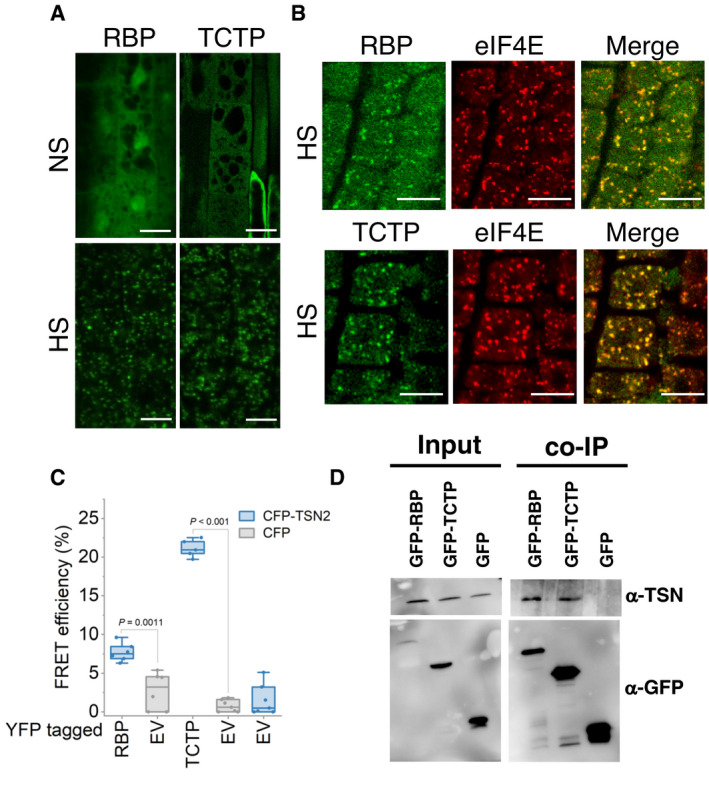
- A
Localization of GFP‐RBP and GFP‐TCTP in root cells of 5‐day‐old Arabidopsis seedlings expressing ProRBP:GFP‐RBP or Pro35S:GFP‐TCTP. The seedlings were grown under 23°C (NS) or incubated at 39°C for 60 min (HS). Scale bars = 10 μm.
- B
Co‐localization analysis of GFP‐RBP (green) or GFP‐TCTP (green) with eIF4E (red, α‐eIF4E) in heat‐stressed (39°C for 60 min) root tip cells of 5‐day‐old Arabidopsis seedlings expressing ProUBP:UBP‐GFP or Pro35S:TCTP‐GFP. Scale bars = 10 μm.
- C
FRET assay of the indicated protein combinations using CFP‐YFP pair in N. benthamiana leaves under HS (39°C for 40 min). EV, empty vector (negative control). Upper and lower box boundaries represent the first and third quantiles, respectively. Horizontal lines mark the median of at least five replicate measurements, and whiskers mark the highest and lowest values. The experiment was repeated three times with similar results. P values denote statistically significant differences for comparisons to plants expressing EV (two‐tailed t‐test).
- D
Co‐immunoprecipitation of RBP or TCTP with TSN in protein extracts prepared from 10‐day‐old Arabidopsis seedlings expressing ProRBP:GFP‐RBP or Pro35S:GFP‐TCTP. The GFP‐expressing line was used as a negative control. Endogenous TSN (107 kD) was detected in the total fractions (Input) and in the fractions co‐immunoprecipitated (Co‐Ip) with RBP and TCTP but not with free GFP. Input and Co‐Ip fractions were analysed by immunoblotting using α‐TSN and α‐GFP.
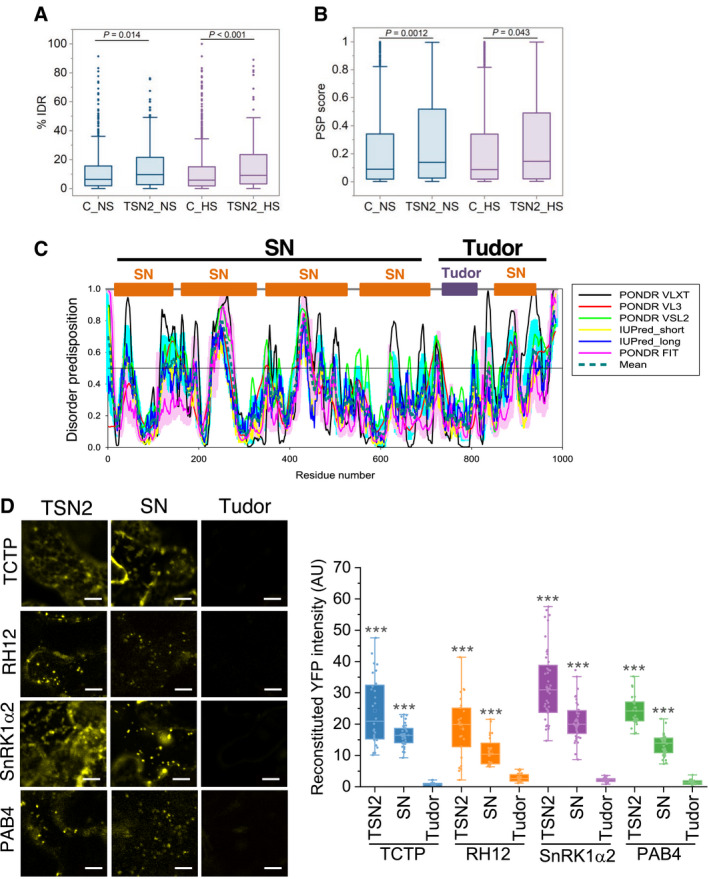
- A, B
% IDR (A) and propensity for LLPS (B) in TSN2_NS and TSN2_HS interactomes versus corresponding GFP‐TAPa controls (C_NS and C‐HS) using IUPred and PSPredictor algorithms, respectively. Upper and lower quartiles, medians and extreme points are shown. The number of protein sequences included to the analyses was 566, 277, 995 and 149 for C_NS, TSN2_NS, C_HS and TSN2_HS, respectively. P values denote statistically significant differences for comparisons to controls (two‐tailed t‐test).
- C
Disorder profiles of TSN2 generated by PONDR‐VLXT, PONDR‐VL3, PONDR‐VSL2, IUPred‐short, IUPred‐long and PONDR‐FIT and a consensus disorder profile (based on mean values of six predictors). SN, staphylococcal nuclease region composed of four N‐terminally situated SN domains. C‐terminally situated Tudor region is composed of the domain of the same name and a partial SN domain.
- D
BiFC between cYFP‐TSN2 (full‐length), cYFP‐SN or cYFP‐Tudor and nYFP‐TSN‐interacting proteins in N. benthamiana protoplasts after HS (39°C for 40 min). Scale bars = 10 μm. Boxplots show quantification of the reconstituted YFP signal. AU, arbitrary units. Upper and lower box boundaries represent the first and third quantiles, respectively, horizontal lines mark the median, and whiskers mark the highest and lowest values. Three independent experiments, each containing seven individual measurements, were performed. ***P < 0.001 versus Tudor (one‐way ANOVA).
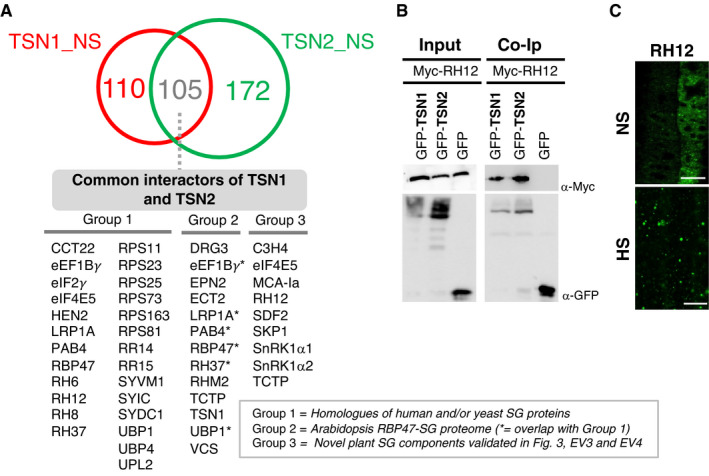
- A
Venn diagram showing the overlap between TSN1 and TSN2 interactomes isolated by TAPa from Arabidopsis plants grown under NS conditions. Common interactors of TSN1 and TSN2 are classified into three groups: (i) homologues of human and/or yeast SG proteins, (ii) proteins constituting recently isolated Arabidopsis RBP47‐SG proteome (Kosmacz et al, 2019) and (iii) novel plant SG components validated in Figs 3, EV3 and EV4. The full lists of TSN1‐ and TSN2‐interacting proteins, including as yet uncharacterized and potentially novel SG components not belonging to any of the three groups, are provided in Dataset EV1.
- B
Co‐immunoprecipitation (Co‐Ip) of the two TSN isoforms and RH12 in protein extracts prepared from N. benthamiana leaves agro‐infiltrated with GFP‐TSN1 or GFP‐TSN2 and Myc‐RH12. Free GFP was used as a negative control. Input and Co‐Ip fractions were analysed by immunoblotting using α‐Myc and α‐GFP.
- C
Localization of RH12 in root cells of 5‐day‐old Arabidopsis seedlings expressing GFP‐RH12 under control of the native promoter. The seedlings were grown under 23°C (NS) or incubated at 39°C for 60 min (HS). Scale bars = 10 μm.
- A
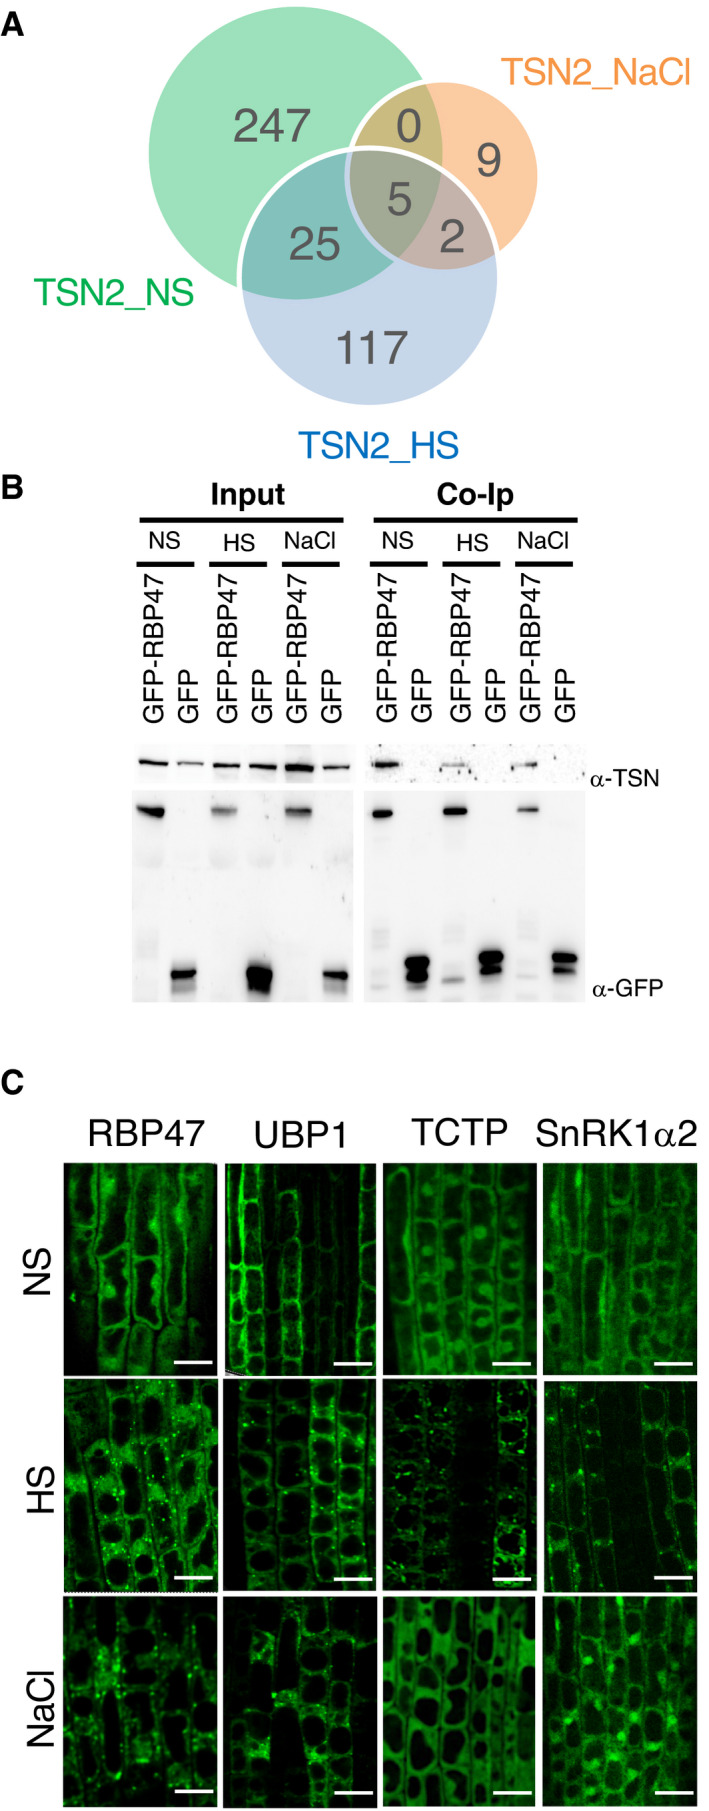
Venn diagram showing a comparison between TSN2_NS, TSN2_HS and TSN2_NaCl protein pools.
- B
Co‐immunoprecipitation (Co‐Ip) of TSN and RBP47 in protein extracts prepared from 10‐day‐old Arabidopsis seedlings expressing Pro35S:GFP‐RBP47 and grown under no stress (NS), HS (39°C for 60 min) or salt (NaCl) stress (150 mM NaCl for 60 min) conditions. The GFP‐expressing line was used as a negative control. Endogenous TSN (107 kD) was detected in total fractions (Input) and fractions co‐immunoprecipitated (Co‐Ip) with RBP47 but not with free GFP in all three conditions. Input and Co‐Ip fractions were analysed by immunoblotting using α‐TSN and α‐GFP.
- C
Localization of GFP‐tagged proteins in root cells of 5‐day‐old Arabidopsis seedlings expressing Pro35S:GFP‐RBP47, Pro35S:GFP‐UBP1, Pro35S:GFP‐TCTP and ProUBQ:GFP‐SnRK1α2. The seedlings were grown under 23°C (NS), incubated at 39°C for 60 min (HS) or treated with 200 mM NaCl at 23°C for 60 min (NaCl). Scale bars = 10 μm.
- A
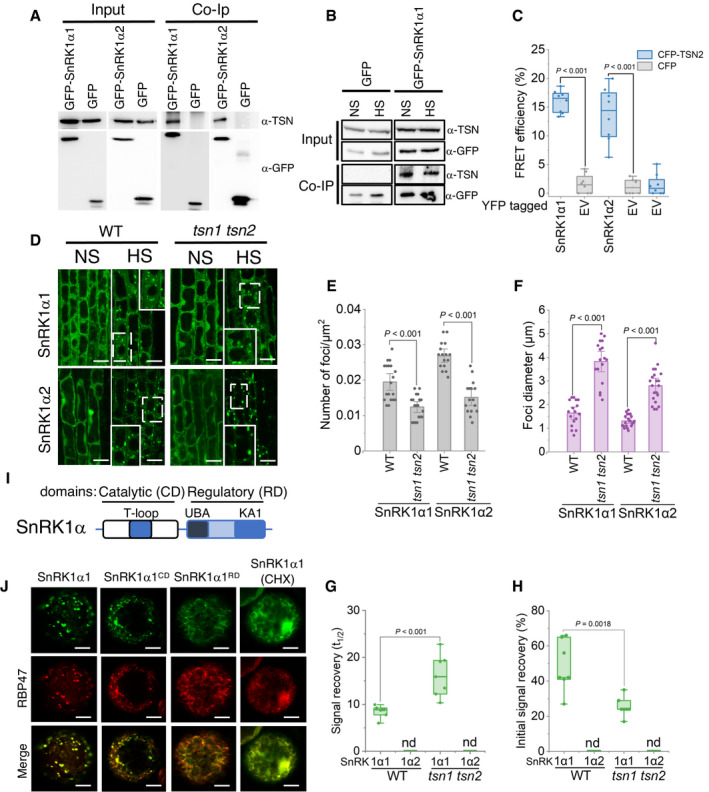
Co‐immunoprecipitation of TSN and SnRK1α1 and SnRK1α2 in protein extracts prepared from 10‐day‐old Arabidopsis seedlings expressing ProUBQ:GFP‐SnRK1α1 or ProUBQ:GFP‐SnRK1α2 and exposed to HS (39°C for 60 min). The GFP‐expressing line was used as a negative control. Endogenous TSN was detected in the total fractions (Input) and in the fractions co‐immunoprecipitated (Co‐Ip) with SnRK1α1 or SnRK1α2 but not with free GFP. Input and Co‐Ip fractions were analysed by immunoblotting using α‐TSN and α‐GFP.
- B
Co‐immunoprecipitation of TSN and SnRK1α1 in protein extracts prepared from 10‐day‐old Arabidopsis seedlings expressing ProUBQ:GFP‐SnRK1α1 and grown under NS (23°C) conditions or subjected to HS (39°C for 60 min). Endogenous TSN was detected in the total fractions (Input) and in the fractions co‐immunoprecipitated (Co‐Ip) with SnRK1α1 under both NS and HS conditions. Input and Co‐Ip fractions were analysed by immunoblotting using α‐TSN and α‐GFP.
- C
FRET assay of the indicated protein combinations using CFP‐YFP pair in N. benthamiana leaves under HS (39°C for 40 min). EV, empty vector (negative control). Upper and lower box boundaries represent the first and third quantiles, respectively; horizontal lines mark the median of at least eight replicate measurements, and whiskers mark the highest and lowest values. The experiment was repeated three times with similar results. P values denote statistically significant differences for comparisons to plants expressing EV (two‐tailed t‐test).
- D
Localization of GFP‐SnRK1α1 and GFP‐SnRK1α2 in root cells of 5‐day‐old Arabidopsis WT and tsn1 tsn2 seedlings grown under 23°C (NS) or incubated at 39°C for 60 min (HS). Insets show enlarged areas inside dashed rectangles. Scale bars = 10 μm.
- E, F
Number (E) and size (F) of SnRK1α1‐ and SnRK1α2‐foci in root tip cells of WT and tsn1 tsn2 seedling expressing ProUBQ:GFP‐SnRK1α1 or ProUBQ:GFP‐SnRK1α2, respectively, after HS (60 min at 39°C). Data represent means ± SD of at least 16 replicate measurements from three independent experiments. P values denote statistically significant differences for comparisons to WT plants (two‐tailed t‐test).
- G, H
Signal recovery rate (t 1/2; G) and proportion of the initial signal recovered (%; H) of GFP‐tagged isoforms of SnRK1α in root tip cells of WT and tsn1 tsn2 seedlings expressing ProUBQ:GFP‐SnRK1α1 and ProUBQ:GFP‐SnRK1α2 after HS (60 min at 39°C). nd, not detected. Upper and lower box boundaries represent the first and third quantiles, respectively; horizontal lines mark the median of at least seven replicate measurements, and whiskers mark the highest and lowest values. The experiment was repeated three times with similar results. P values denote statistically significant differences for comparisons to WT plants (two‐tailed t‐test).
- I
Schematic diagram of SnRK1α protein structure showing catalytic (CD) and regulatory (RD) domains. The CD includes the phosphorylated T‐loop region. RD includes both kinase‐associated 1 (KA1) and ubiquitin‐associated (UBA) subdomains.
- J
Co‐localization of GFP‐SnRK1α1, GFP‐SnRK1α1CD or GFP‐SnRK1α1RD with RFP‐RBP47 in N. benthamiana protoplasts subjected to HS (40 min at 39°C). For co‐localization analysis under NS conditions see Fig EV5B. For CHX treatment, protoplasts were incubated with 200 ng/μl CHX for 30 min at 23°C before HS. GFP and RFP fusion proteins were expressed under the control of the UBQ and 35S promoter, respectively. Scale bars = 5 μm.
- A
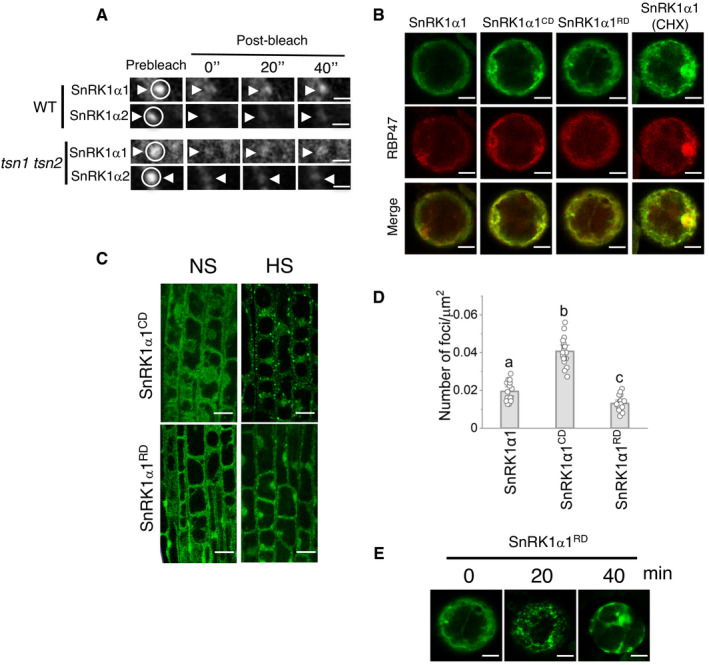
Selected time frames (0, 20 and 40 s after bleaching) from FRAP analysis of SnRK1α1 and SnRK1α2 in root tip cells of WT and tsn1 tsn2 seedlings, both expressing either ProUBQ:GFP‐SnRK1α1 or ProUBQ:GFP‐SnRK1α2 after HS (39°C for 60 min). Circles and arrowheads indicate the bleached foci. The corresponding signal recovery rate (t 1/2) and proportion of the initial signal recovered (%) of GFP‐tagged proteins are shown in Fig 7G and H, respectively. Scale bars = 3 μm.
- B
Co‐localization of GFP‐SnRK1α1 (with and without CHX treatment), GFP‐SnRK1α1CD or GFP‐SnRK1α1RD with RFP‐RBP47 in N. benthamiana protoplasts under NS conditions (23°C). Scale bars = 5 μm.
- C
Localization of GFP‐SnRK1α1CD and GFP‐SnRK1α1RD in root tip cells of 5‐day‐old Arabidopsis WT seedlings expressing ProUBQ:GFP‐SnRK1α1CD and ProUBQ:GFP‐SnRK1α1RD grown under 23°C (NS) or incubated at 39°C for 60 min (HS). Scale bars = 10 μm.
- D
Quantification of GFP foci in root tip cells of 5‐day‐old Arabidopsis WT seedlings expressing ProUBQ:GFP‐SnRK1α1, ProUBQ:GFP‐SnRK1α1CD or ProUBQ:GFP‐SnRK1α1RD after HS (39°C for 60 min). Data represent means ± SD of 15–25 measurements from three different experiments. Means with different letters are significantly different at P < 0.001 (one‐way ANOVA).
- E
Kinetics of GFP‐SnRK1α1RD in N. benthamiana protoplasts expressing ProUBQ:GFP‐SnRK1α1RD . Protoplasts were kept under control conditions (0 min) or heat‐stressed at 39°C for 20 and 40 min. Scale bars = 5 μm.
- A, B
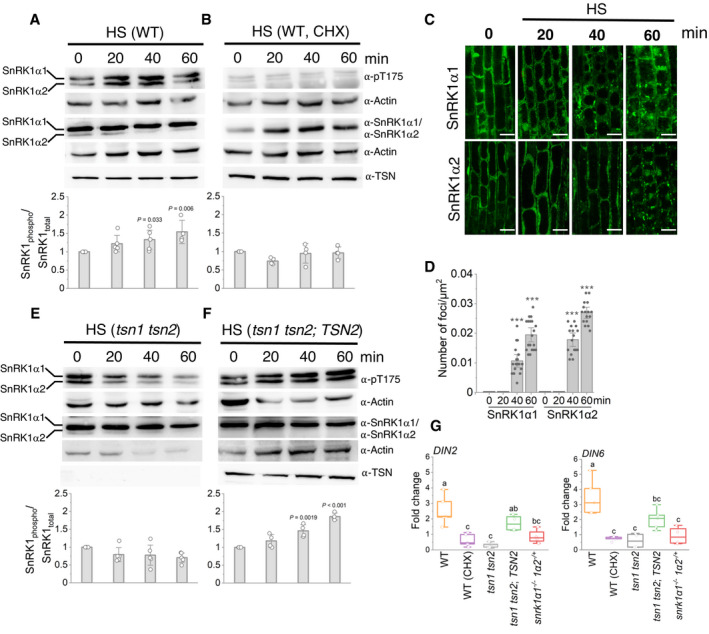
Immunoblot analysis with indicated antibodies of protein extracts prepared from root tips of 10‐day‐old Arabidopsis WT heat‐stressed seedlings (39°C) 0, 20, 40 and 60 min after the onset of HS. For CHX treatment in B, the seedlings were pre‐treated with 200 ng/μl CHX for 30 min before HS. The charts show SnRK1 activity, expressed as the ratio of phosphorylated to total SnRK1 protein. The data represent mean ratios of integrated band intensities (for both isoforms) normalized to 0 min ± SD from at least four different experiments. P values denote statistically significant differences for comparisons to 0 min (two‐tailed t‐test).
- C
Localization of GFP‐SnRK1α1 and GFP‐SnRK1α2 in root cells of 5‐day‐old Arabidopsis WT seedlings incubated at 39°C and imaged at the indicated time points. Scale bars = 10 μm.
- D
Quantification of GFP‐SnRK1α1 and GFP‐SnRK1α2 foci in the experiment shown in C. Data represent means ± SD of at least 16 replicate measurements. The experiment was repeated three times with similar results. ***P < 0.05 (two‐tailed t‐test).
- E, F
Immunoblot analysis with indicated antibodies of protein extracts prepared from root tips of 10‐day‐old Arabidopsis tsn1 tsn2 (E) or tsn1 tsn2 expressing ProTSN2:GFP‐TSN2 (F) heat‐stressed seedlings (39°C) 0, 20, 40 and 60 min after the onset of HS. The charts show SnRK1 activity, expressed as the ratio of phosphorylated to total SnRK1 protein. The data represent mean ratios of integrated band intensities (for both isoforms) normalized to 0 min ± SD from at least four different experiments. P values denote statistically significant differences for comparisons to 0 min (two‐tailed t‐test).
- G
Expression levels of DIN2 and DIN6 in Arabidopsis WT, tsn1 tsn2, tsn1 tsn2;TSN2 and snrk1α1 −/− snrk1α2 −/+ 10‐day‐old heat‐stressed seedlings relative to unstressed controls. For CHX treatment, the WT seedlings were pre‐treated with 200 ng/μl CHX for 30 min before HS. Upper and lower box boundaries represent the first and third quantiles, respectively. Horizontal lines mark the median of five replicate measurements, and whiskers mark the highest and lowest values. Means with different letters are significantly different at P < 0.05 (one‐way ANOVA).
Similar articles
-
Tudor staphylococcal nuclease links formation of stress granules and processing bodies with mRNA catabolism in Arabidopsis.Plant Cell. 2015 Mar;27(3):926-43. doi: 10.1105/tpc.114.134494. Epub 2015 Mar 3. Plant Cell. 2015. PMID: 25736060 Free PMC article.
-
The FCS-like zinc finger scaffold of the kinase SnRK1 is formed by the coordinated actions of the FLZ domain and intrinsically disordered regions.J Biol Chem. 2018 Aug 24;293(34):13134-13150. doi: 10.1074/jbc.RA118.002073. Epub 2018 Jun 26. J Biol Chem. 2018. PMID: 29945970 Free PMC article.
-
Tudor Staphylococcal Nuclease plays two antagonistic roles in RNA metabolism under stress.Plant Signal Behav. 2015;10(10):e1071005. doi: 10.1080/15592324.2015.1071005. Plant Signal Behav. 2015. PMID: 26237081 Free PMC article.
-
Tudor staphylococcal nuclease: biochemistry and functions.Cell Death Differ. 2016 Nov 1;23(11):1739-1748. doi: 10.1038/cdd.2016.93. Epub 2016 Sep 9. Cell Death Differ. 2016. PMID: 27612014 Free PMC article. Review.
-
Molecular Insights into the Enigmatic Metabolic Regulator, SnRK1.Trends Plant Sci. 2016 Apr;21(4):341-353. doi: 10.1016/j.tplants.2015.11.001. Epub 2015 Nov 28. Trends Plant Sci. 2016. PMID: 26642889 Review.
Cited by
-
Concentrating and sequestering biomolecules in condensates: impact on plant biology.J Exp Bot. 2023 Mar 13;74(5):1303-1308. doi: 10.1093/jxb/erac497. J Exp Bot. 2023. PMID: 36516452 Free PMC article. No abstract available.
-
ALBA proteins confer thermotolerance through stabilizing HSF messenger RNAs in cytoplasmic granules.Nat Plants. 2022 Jul;8(7):778-791. doi: 10.1038/s41477-022-01175-1. Epub 2022 Jul 11. Nat Plants. 2022. PMID: 35817823
-
Rapid prediction and analysis of protein intrinsic disorder.Protein Sci. 2022 Dec;31(12):e4496. doi: 10.1002/pro.4496. Protein Sci. 2022. PMID: 36334049 Free PMC article.
-
Isolation and Visualization of Plant Stress Granule-Associated Components via On-Beads Digestion and Co-localization Analysis.Methods Mol Biol. 2024;2832:57-66. doi: 10.1007/978-1-0716-3973-3_4. Methods Mol Biol. 2024. PMID: 38869787
-
Seed longevity is controlled by metacaspases.Nat Commun. 2024 Aug 8;15(1):6748. doi: 10.1038/s41467-024-50848-2. Nat Commun. 2024. PMID: 39117606 Free PMC article.
References
-
- Abe S, Sakai M, Yagi K, Hagino T, Ochi K, Shibata K, Davies E (2003) A Tudor protein with multiple SNc domains from pea seedlings: cellular localization, partial characterization, sequence analysis, and phylogenetic relationships. J Exp Bot 54: 971–983 - PubMed
-
- Arimoto K, Fukuda H, Imajoh‐Ohmi S, Saito H, Takekawa M (2008) Formation of stress granules inhibits apoptosis by suppressing stress‐responsive MAPK pathways. Nat Cell Biol 10: 1324–1332 - PubMed
-
- Baena‐Gonzalez E, Hanson J (2017) Shaping plant development through the SnRK1‐TOR metabolic regulators. Curr Opin Plant Biol 35: 152–157 - PubMed
Publication types
MeSH terms
Substances
LinkOut - more resources
Full Text Sources
Molecular Biology Databases
