. 2021 Jul;595(7869):701-706.
doi: 10.1038/s41586-021-03734-6. Epub 2021 Jul 14.

Astrocytic interleukin-3 programs microglia and limits Alzheimer's disease

Affiliations

Astrocytic interleukin-3 programs microglia and limits Alzheimer's disease

Cameron S McAlpine et al. Nature. 2021 Jul.

Abstract

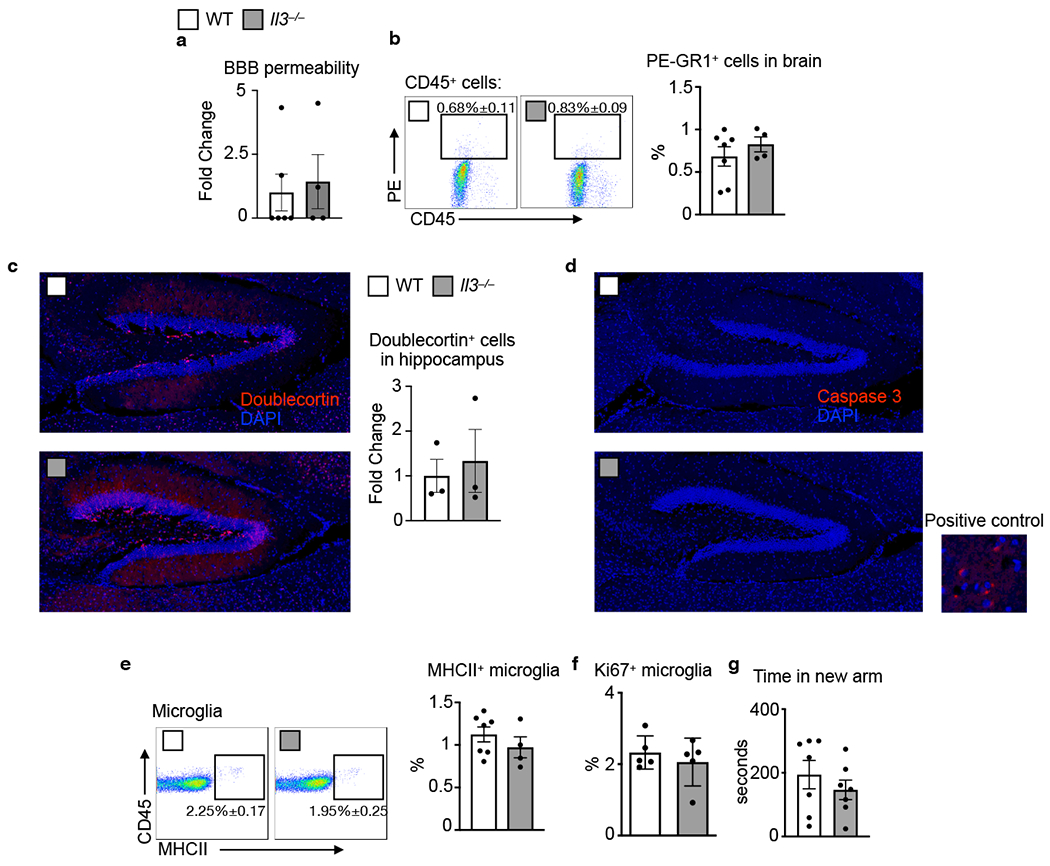
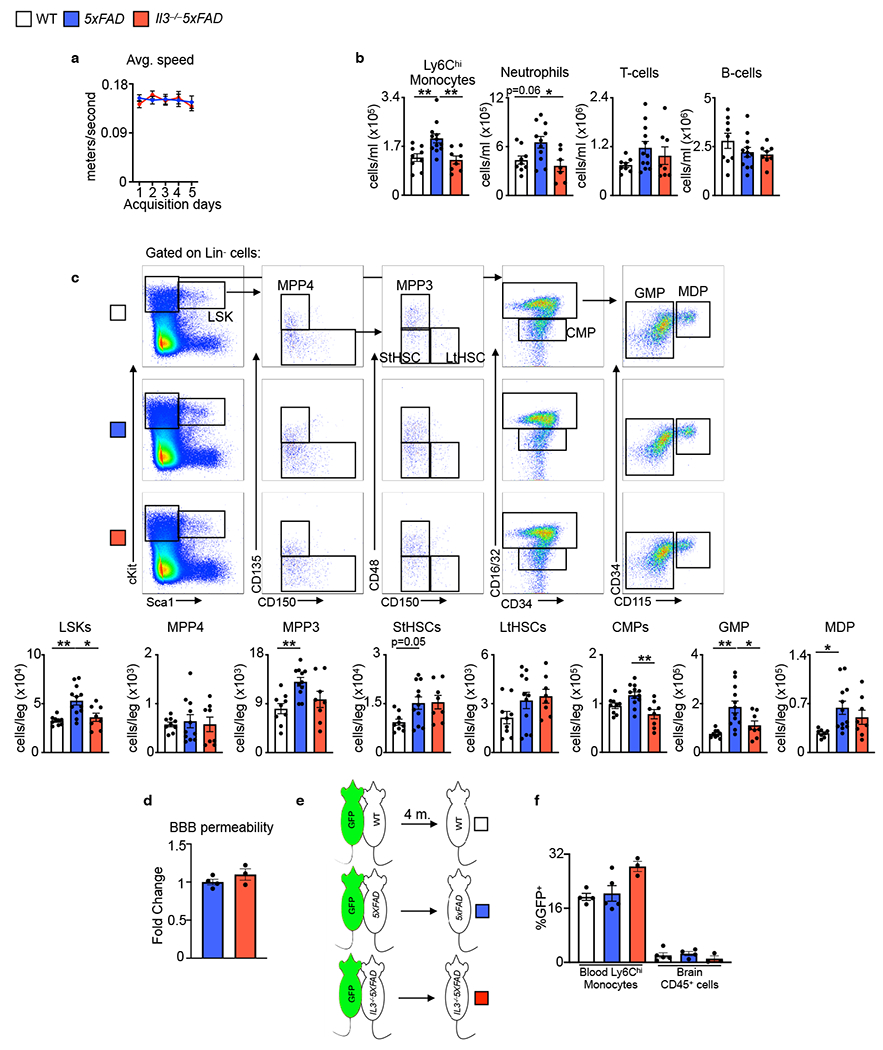
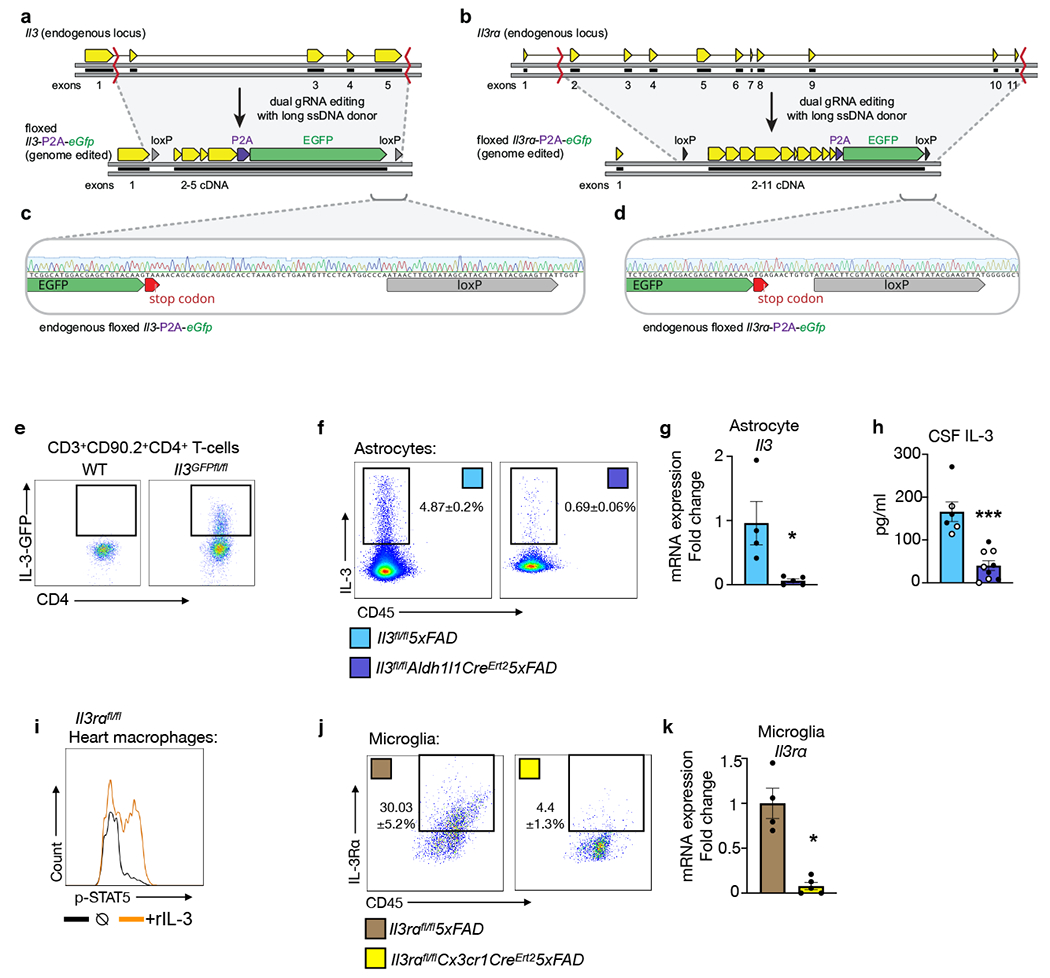
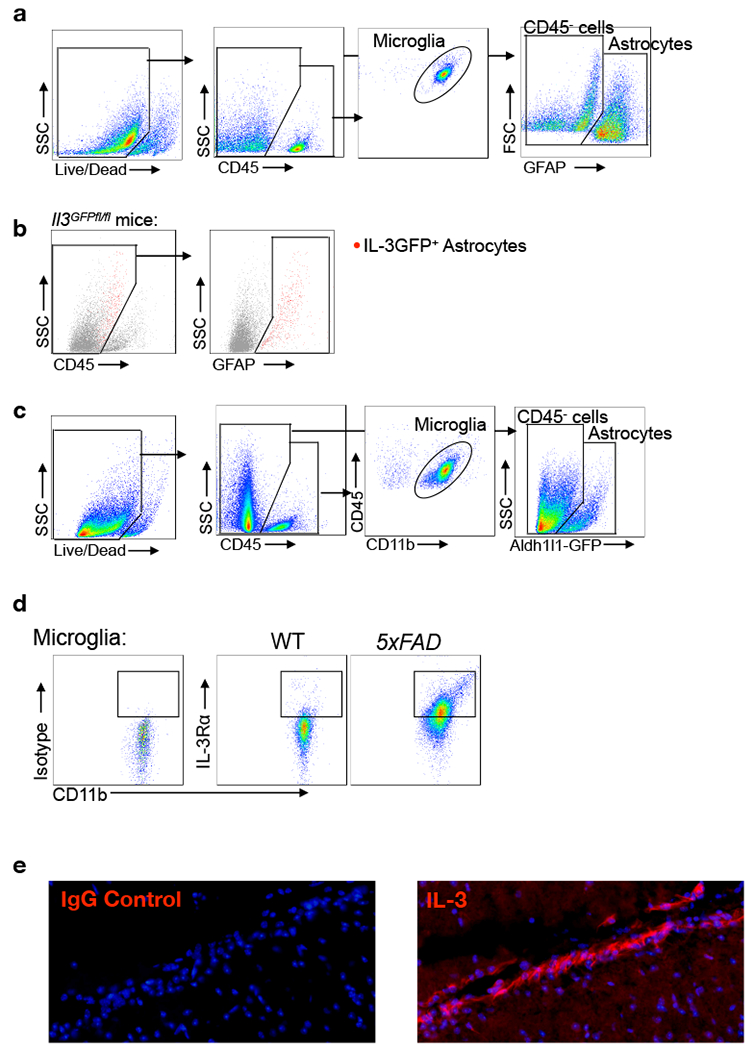
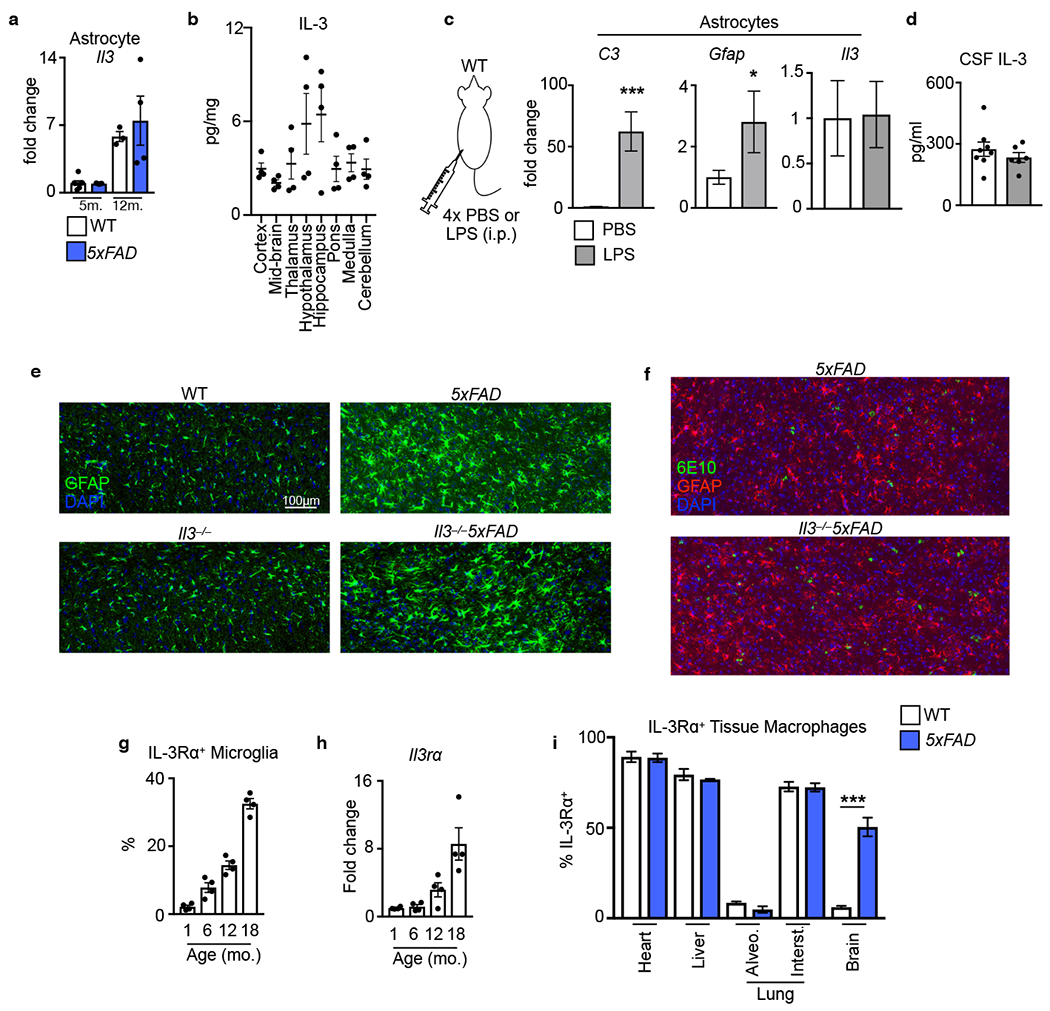
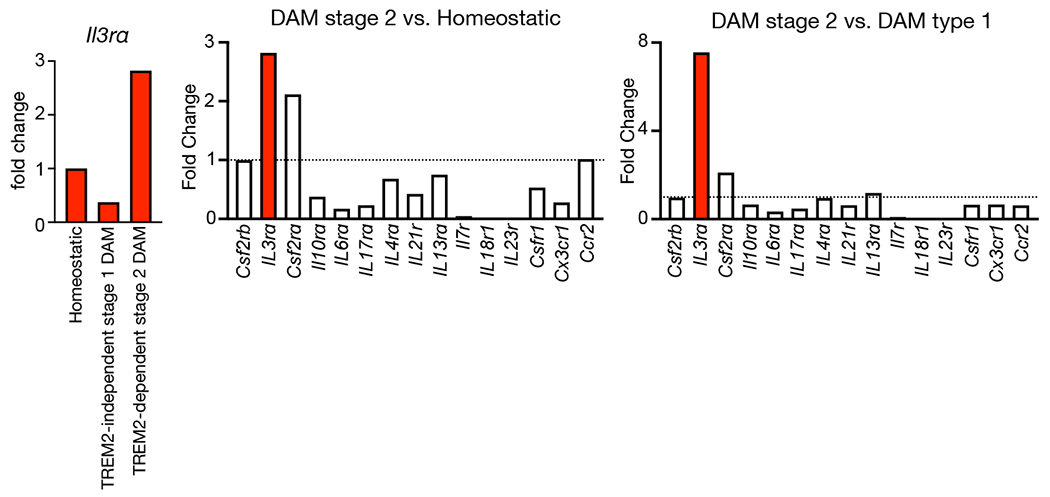
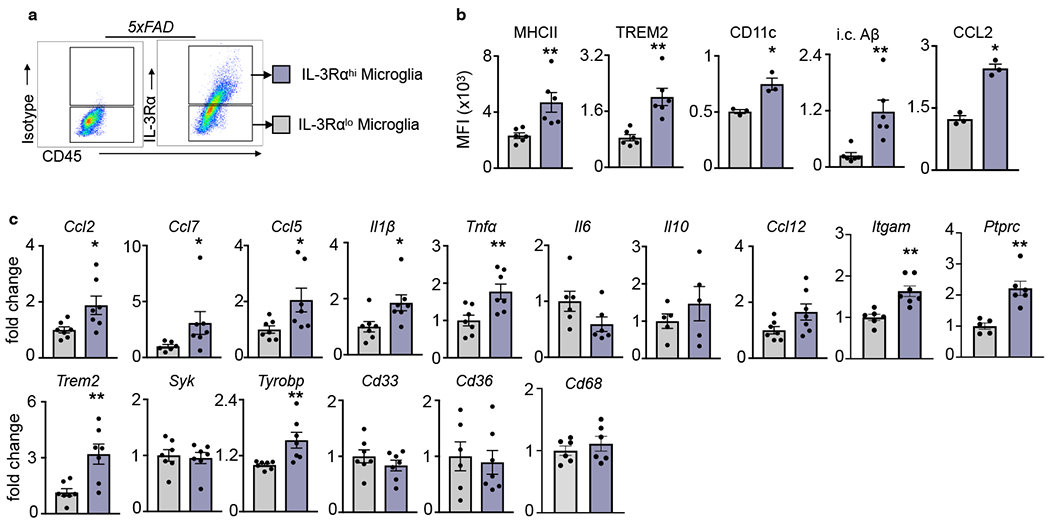
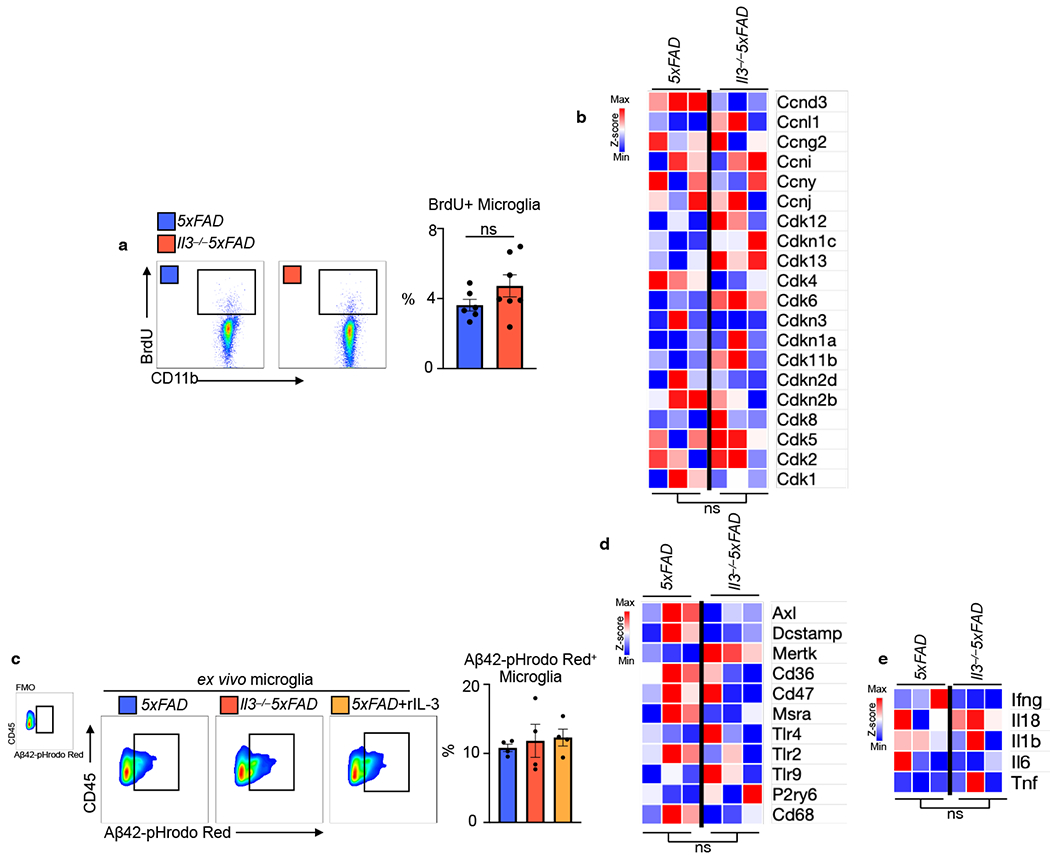
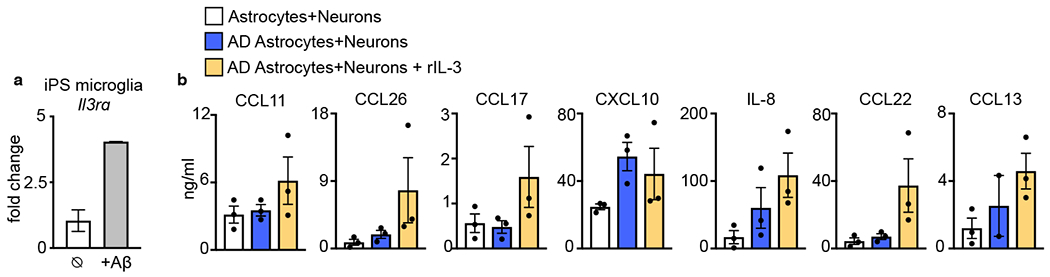
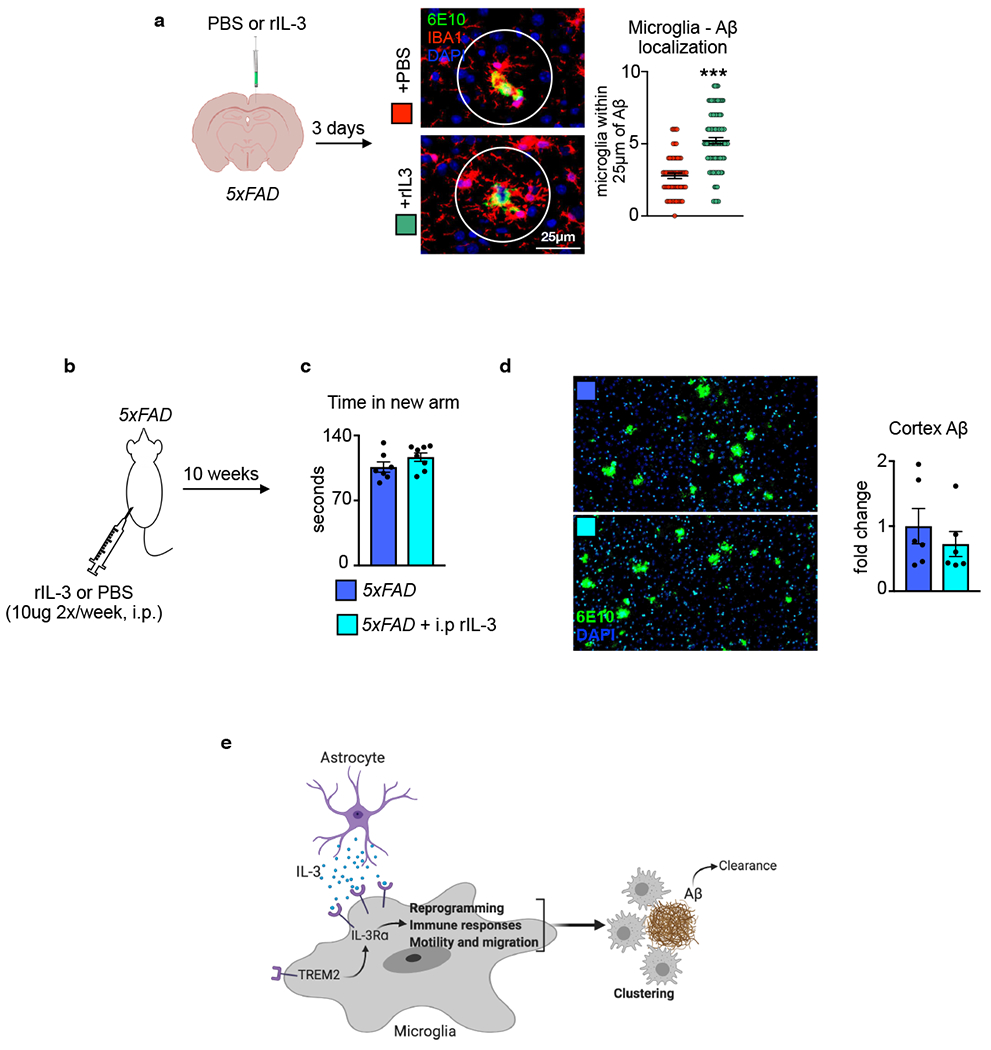
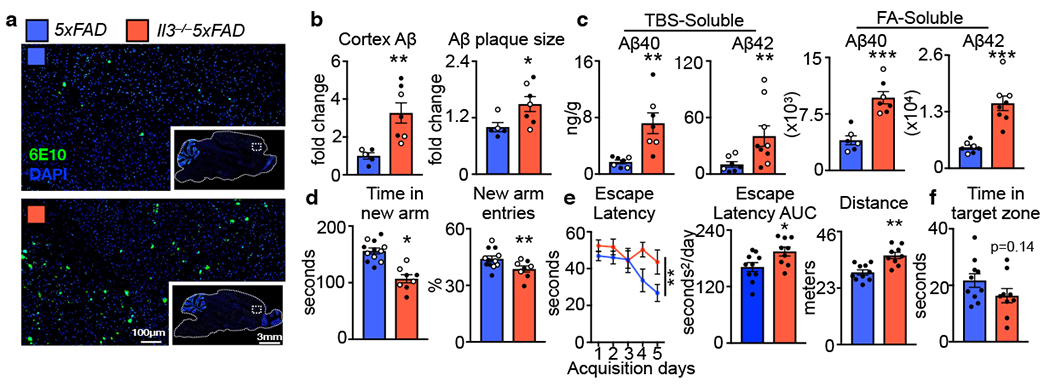
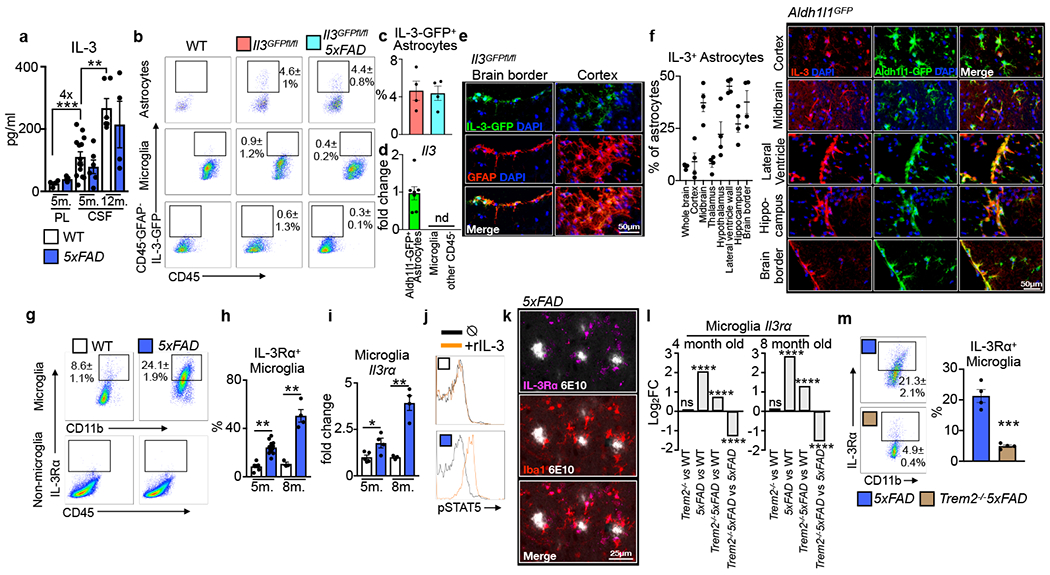
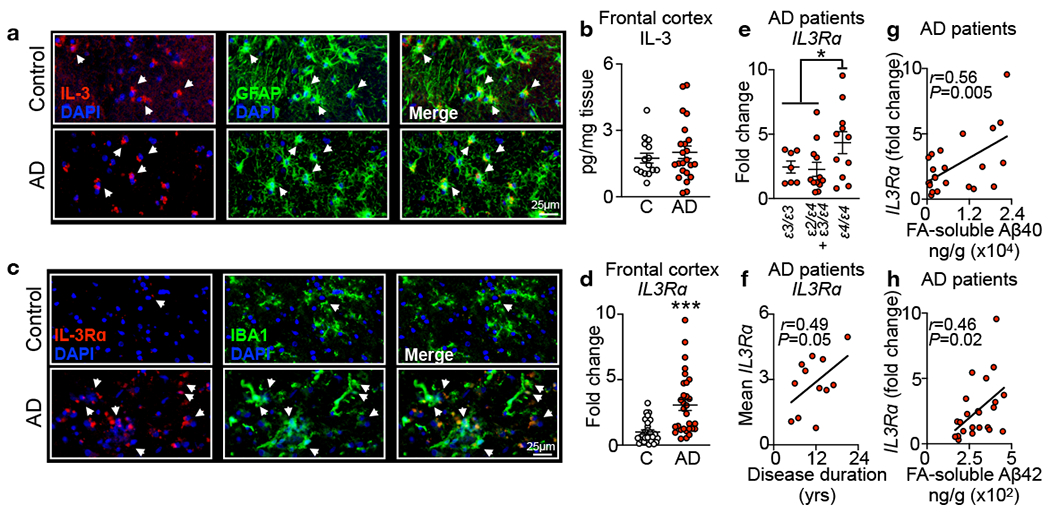
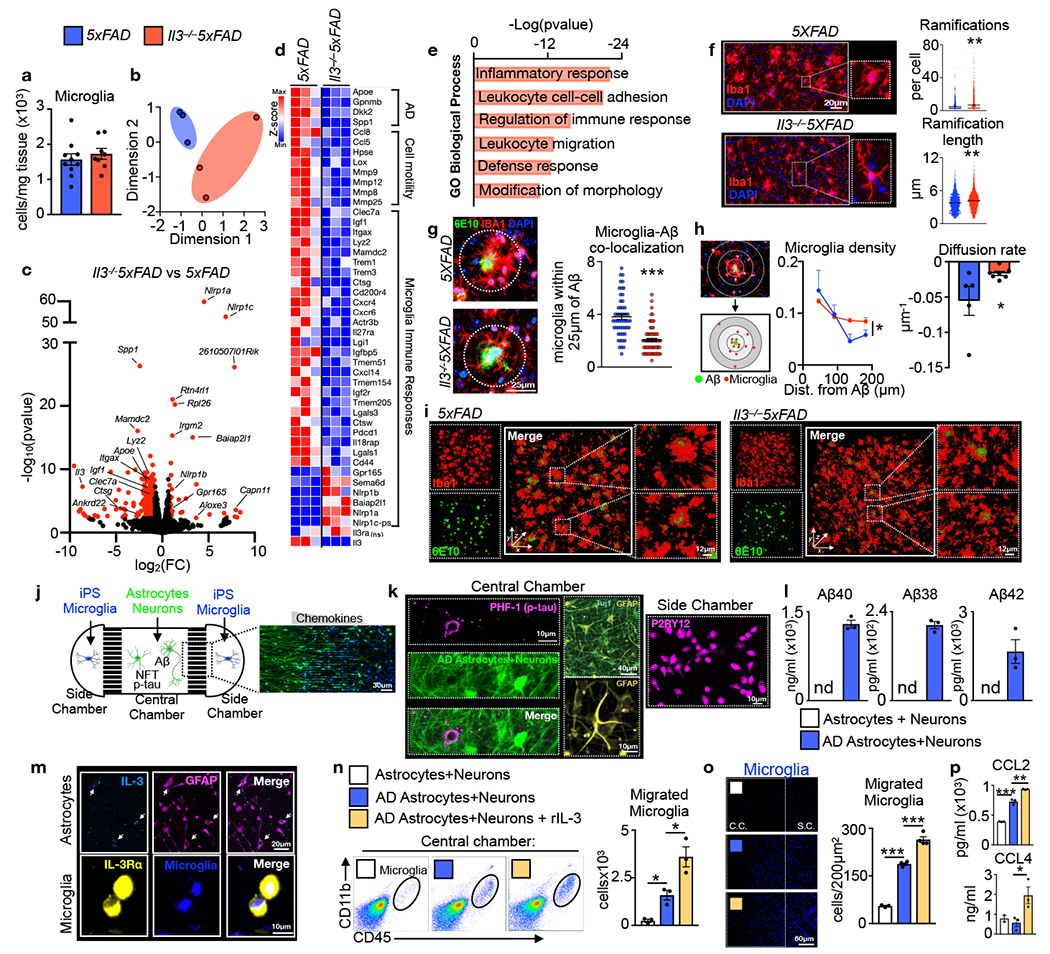
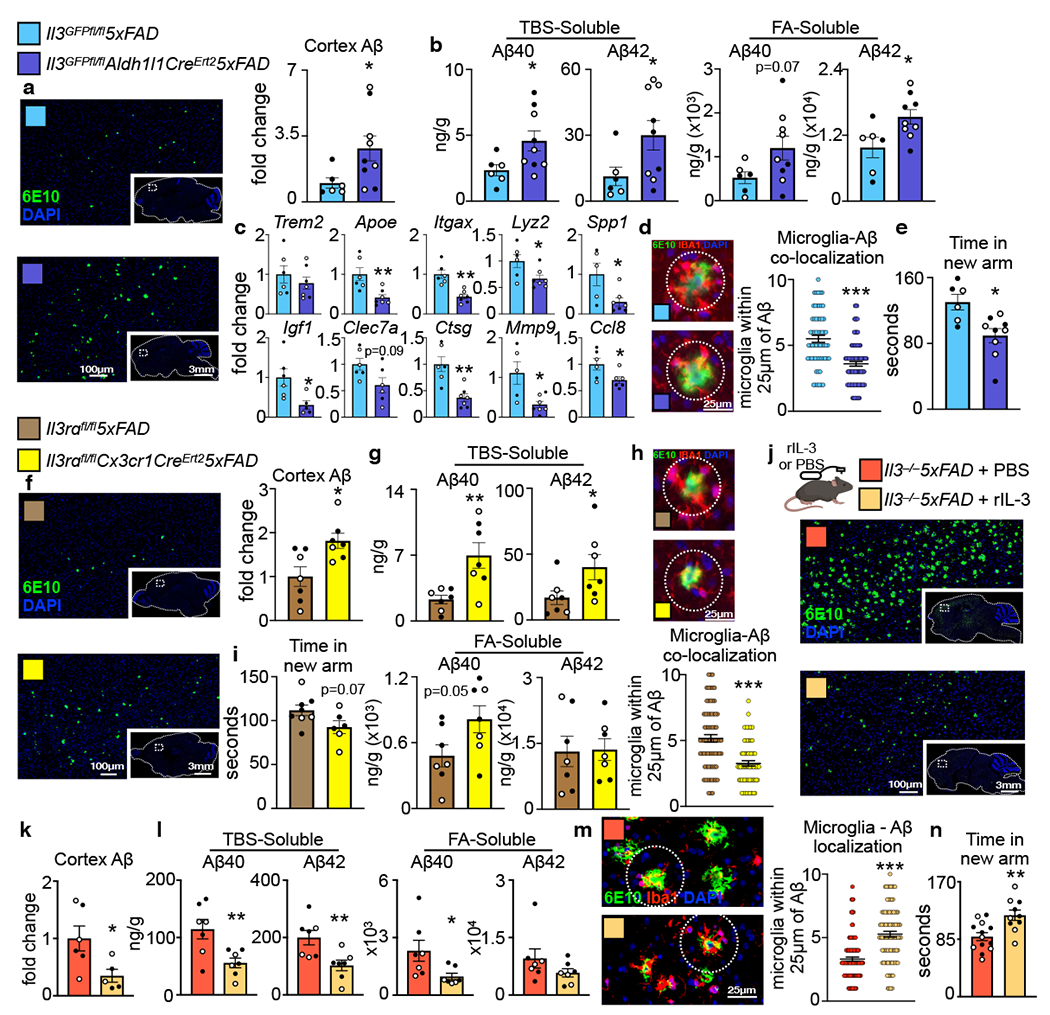
Communication within the glial cell ecosystem is essential for neuronal and brain health1-3. The influence of glial cells on the accumulation and clearance of β-amyloid (Aβ) and neurofibrillary tau in the brains of individuals with Alzheimer's disease (AD) is poorly understood, despite growing awareness that these are therapeutically important interactions4,5. Here we show, in humans and mice, that astrocyte-sourced interleukin-3 (IL-3) programs microglia to ameliorate the pathology of AD. Upon recognition of Aβ deposits, microglia increase their expression of IL-3Rα-the specific receptor for IL-3 (also known as CD123)-making them responsive to IL-3. Astrocytes constitutively produce IL-3, which elicits transcriptional, morphological, and functional programming of microglia to endow them with an acute immune response program, enhanced motility, and the capacity to cluster and clear aggregates of Aβ and tau. These changes restrict AD pathology and cognitive decline. Our findings identify IL-3 as a key mediator of astrocyte-microglia cross-talk and a node for therapeutic intervention in AD.


Conflict of interest statement

Competing interests

C.S.M., F.K.S., and R.E.T. are inventors on a patent application filed by Mass General Brigham that describes targeting IL-3 signaling in Alzheimer’s disease (invention record no. 2020-568). B.P.K. is an inventor on patent applications filed by Mass General Brigham that describe genome engineering technologies and methods, is an advisor to Acrigen Biosciences, and consults for Avectas Inc. and ElevateBio.

Figures

Extended Data Fig. 1.
Extended Data Fig. 1.. Analysis of Il3−/− mice.
a. FITC-dextran (mol. wt. 4000) was i.v. injected into WT and Il3−/− mice prior to sacrifice. Blood brain barrier integrity was determined by measuring FITC signal in brain homogenate (n=4-6). b. Prior to sacrifice WT and Il3−/− mice were i.v. injected with an anti-GR1 antibody conjugated to PE to label all circulating monocytes and neutrophils. PE signal among CD45+ cells was assessed in the brain by flow cytometry (n=4-7). c. Doublecortin staining and quantification in the hippocampus of WT and Il3−/− mice at 4 months of age (n=3). d. Absence of Caspase 3 staining in the hippocampus of WT and Il3−/− mice along with a representative image of rare positively stained cells from the thalamus (n=3). e. Assessment of MHCII+ microglia in the brain of WT and Il3−/− mice (n=4-7). f. Analysis of Ki67+ proliferating microglia (n=5). g. Time in new arm during Y-maze testing (n=6-7). Groups of mice are of evenly mixed sex. Error bars indicate mean ± SEM.
Extended Data Fig. 2.
Extended Data Fig. 2.. Hematopoiesis and peripheral immune cell dynamics in WT, 5xFAD, and Il3−/−5XFAD mice.
a. Average swim speed during acquisition days of Morris water maze (n=9-10). b. Flow cytometry assessment of blood leukocytes. c. Flow cytometry analysis of LinSca1+cKit+ (LSKs), multi-potent progenitors (MPP)-4 and -3, short-term hematopoietic stem cells (StHSCs), long-term HSCs (LtHSCs), common myeloid progenitors (CMPs), granulocyte macrophage progenitors (GMPs), and monocyte dendritic progenitors (MDPs) in the bone marrow of 5-month-old WT, 5xFAD, and Il3−/−5xFAD mice (n=7-12). d. FITC-dextran (mol. wt. 4000) was i.v. injected into 5xFAD and Il3−/−5xFAD mice prior to sacrifice. Blood brain barrier integrity was determined by measuring FITC signal in brain homogenates (n=4). e. WT, 5xFAD, Il3−/−5xFAD mice were joined by parabiosis with UbiGFP mice from the age of 2 to 6 months (4 months total). f. GFP chimerism in blood Ly6Chi monocytes and brain CD45+ cells was assessed by flow cytometry in the WT, 5xFAD, and Il3−/−5xFAD parabiont (n=4-5). Groups of mice are of evenly mixed sex. *p<0.05, **p<0.01, ***p<0.001. Error bars indicate mean ± SEM.
Extended Data Fig 3.
Extended Data Fig 3.. Generation and validation of Il3GFPfl/flAldh1/1CreERT25XFAD and Il3rɑfl/flCx3cr1CreERT25XFAD mice.
Schematics of the endogenous loci and editing strategies to generate conditional/reporter models for Il3 (a) and Il3rɑ (b). Mice were generated by excising large fragments of the endogenous loci by co-delivery of SpCas9 and two gRNAs, and in the presence of a long single stranded DNA donor encoding a loxP-cDNA-P2A-EGFP-loxP cassette. Representative Sanger sequencing traces validating insertion of the loxP-cDNA-P2A-EGFP-loxP cassettes at the endogenous loci of Il3 (c) and Il3rɑ (d). Missense mutation quench the GFP signal in Il3rɑ targeted mice. e. GFP signal in ex-vivo stimulated splenic and lymph node T-cells, known IL-3 sources, from WT and Il3GFPfl/fl mice. f. Flow cytometry analysis of astrocyte IL-3 production in 5-month-old Il3GFPfl/fl5xFAD and Il3GFPfl/flAldh1/1CreERT25xFAD mice injected with tamoxifen. g. qPCR analysis of Il3 mRNA expression in sorted astrocytes. h. CSF IL-3 levels. Filled circles represent male mice, open circles represent female mice. i. STAT5 phosphorylation in ex-vivo heart macrophages from Il3rɑfl/fl mice simulated with recombinant IL-3. j. Flow cytometry analysis of microglia IL-3Rα production in 5-month-old Il3rɑfl/fl5xFAD and Il3rɑfl/flCx3cr1CreERT25xFAD mice injected with tamoxifen. k. qPCR analysis of Il3rɑ mRNA expression in sorted microglia. All Il3GFPfl/fl5xFAD, Il3GFPfl/flAldh1/1CreERT25xFAD, Il3rafl/fl5xFAD, and Il3rɑfl/flCx3cr1CreERT25xFAD mice were injected with tamoxifen beginning at 2 months of age. **p<0.01, ***p<0.001. Error bars indicate mean ± SEM.
Extended data Fig. 4.
Extended data Fig. 4.. Flow cytometry gating strategy and histology controls.
a. Gating strategy used to identify cell populations in the brain of all mice except Aldh1/1GFP mice. b. Backgating of GFP+ astrocytes in Il3GFPfl/fl mice. c. Gating Strategy Used to identify cell populations in the brain of Aldh1/1GFP mice. d. Gating and isotype control plots for microglia IL-3Rɑ staining. e. Representative images of IgG control antibody staining and IL-3 staining in the brain.
Extended Data Fig. 5.
Extended Data Fig. 5.. Astrocyte IL-3 and microglia IL-3Rɑ production.
a. Il3 expression in astrocytes sorted from WT and 5xFAD mice at 5 and 12 months of age. b. Tissue IL-3 levels in various brain regions in WT mice at 4 months of age (n=4). c. Scheme of daily i.p. LPS injection into WT mice over 4 days and qPCR analysis of complement C3 and gfap in sorted astrocytes after LPS injection (n=6). d. Cerebrospinal fluid IL-3 levels (n=6-8). e. Representative images of GFAP+ astrocytes in the cortex of WT, Il3−/−, 5xFAD, and Il3−/−5xFAD mice. f. Representative images of Aβ deposits (6E10) and astrocytes (GFAP) in 5xFAD and Il3−/−5XFAD mice. g. Proportion of IL-3Rɑ+ microglia in the brain of WT mice at various ages (n=4). h. Il3rα transcript expression in brain homogenate of WT mice at various ages (n=4). i. Proportion of IL-3Rɑ+ macrophages in heart, liver, lung (interstitial and alveolar), and brain of WT and 5xFAD mice at 8 months of age (n=4). *p<0.05, **p<0.001. Error bars indicate mean ± SEM.
Extended Data Fig. 6.
Extended Data Fig. 6.. Il3rɑ expression in homeostatic microglia, TREM2-independent type 1 DAMs, and TREM2-dependent type 2 DAMs.
Analysis of Il3rɑ and other cytokine receptors expressed in resting microglia, DAM stage 1, and DAM stage 2 microglia. Data are published in Keren-Shaul et al. Cell, 2017.
Extended Data Fig 7.
Extended Data Fig 7.. Characterization of IL-3Rɑhi and IL-3Rɑlo microglia.
a. Gating strategy for IL-3Rɑhi and IL-3Rɑlo microglia in 5xFAD mice. b. Flow cytometry analysis of IL-3Rɑhi and IL-3Rɑlo microglia (n=3-6). c. mRNA transcript expression in sorted IL-3Rɑhi and IL-3Rɑlo microglia (n=5-7). *p<0.05, **p<0.01. Error bars indicate mean ± SEM.
Extended Data Fig. 8.
Extended Data Fig. 8.. IL-3 does not influence microglia proliferation, the recognition and phagocytosis of Aβ, or the production of inflammatory cytokines.
a. BrdU incorporation into microglia (n=6-7). b. Heatmap of microglia RNAseq expression data of genes important to cell cycle and proliferation. c. Assessment of ex vivo phagocytosis of Aβ42 conjugated to a pH-sensitive dye (PHrodo Red) in sorted microglia lacking Il3 or stimulated with recombinant IL-3 (n=4). d. Heatmap of microglia RNAseq expression data of genes important to Aβ recognition and phagocytosis. e. Heatmap of microglia RNAseq expression data of inflammatory cytokines. Groups of mice are of evenly mixed sex. Error bars indicate mean ± SEM. ns = not significant
Extended Data Fig. 9.
Extended Data Fig. 9.. Human AD iPS triculture system.
a. Il3rɑ expression in human iPS microglia exposed to Aβ (n=2). b. chemokine and cytokine levels in the media of the human AD iPS triculture system. (n=2-3). Error bars indicate mean ± SEM.
Extended Data Fig. 10.
Extended Data Fig. 10.. rIL-3 delivery to the cortex or periphery of 5xFAD mice and summary figure.
a. Recombinant IL-3 or PBS was delivered into the cortex of 5xFAD mice. Three days later microglia localization to Aβ aggregates was assessed (n=6-7). b. Scheme of recombinant IL3 delivery intraperitoneally twice a week for 10 weeks to 5xFAD mice. c. Prior to sacrifice Ymaze behavioral testing was performed and time in the new arm was quantified (n=7-8). d. The amount of Aβ in the cortex of mice was quantified by analyzing histological sections (n=6). Groups of mice are of evenly mixed sex. **p<0.01. Error bars indicate mean ± SEM. e. Model of IL-3’s role in AD. Astrocytes produce IL-3. In response to Aβ, TREM2 signaling increases microglia IL-3Rɑ, rendering microglia responsive to astrocyte-derived IL-3. IL-3 signaling instigates microglia transcriptional and functional reprogramming leading to a signature of immune regulation, motility, and migration. IL-3-dependent reprogramming promotes clustering of microglia around Aβ enabling Aβ clearance and mitigation of AD pathology.
Fig. 1.
Fig. 1.. IL-3 protects against β-amyloid accumulation and cognitive impairment in 5xFAD mice.
a. Representative immunofluorescence images of β-amyloid (Aβ) plaques (6E10) in 5-month-old 5xFAD and Il3−/−5XFAD mice. b. Quantification of Aβ area and Aβ plaque size in the cortex (n=5 5xFAD mice; n=7 Il3−/−5xFAD mice). c. Levels of tris-buffered saline (TBS)- and formic acid (FA)-soluble Aβ40 and Aβ42 in cortex homogenates of 5XFAD and Il3−/−5XFAD mice (n=6-7 5xFAD mice; n=7–9 Il3−/−5xFAD mice). d. Quantification of time in new arm and entries made into the new arm during Y-maze testing (n=8 5xFAD mice; n= 12 Il3−/−5xFAD mice). Morris water maze testing. e. Time for male mice needed to reach hidden platform plotted across training days (two-way ANOVA for groups p=0.0074) and area under the curve (AUC) of escape latency (n=10 5xFAD mice; n=9 Il3−/−5xFAD mice). f. Time in target zone on probe day (8th day) (n=10 5xFAD mice; n=9 Il3−/−5xFAD mice). Filled circles represent male mice, open circles represent female mice. *p<0.05, **p<0.01, ***p<0.001. Error bars indicate mean ± SEM.
Fig. 2.
Fig. 2.. Microglia become responsive to astrocyte-derived IL-3 in Alzheimer’s disease.
a. IL-3 levels in the plasma (PL) and cerebrospinal fluid (CSF) of WT and 5xFAD mice at 5 and 12 months (m.) of age (n=4 WT and 5xFAD 5m.plasma; n=14 WT 5m. CSF; n=6 5xFAD 5m. CSF; n=5 WT 12m. CSF; n=4 5xFAD 12m. CSF). b. Flow cytometry analysis of the brain of WT, Il3GFPfl/fl, and Il3GFPfl/fl5xFAD reporter mice. c. Quantification of IL3+ (GFP+) astrocytes in the brain of Il3GFPfl/fl and l3GFPfl/fl5xFAD mice (n=4 mice per group). d. Il3 mRNA transcript expression in Aldh1l1-GFP+ astrocytes, CD11b+CD45mid microglia, and CD45 cells sorted from Aldh1/1GFP mice (n=7 mice per group). e. Representative immunofluorescence images showing co-localization of IL-3-GFP+ with GFAP+ astrocytes in Il3GFPfl/fl mice. f. Quantification of IL3+ astrocytes (Aldh1/1-GFP+) in various brain regions and representative immunofluorescence images from numerous regions showing co-localization of IL-3 with GFP+ astrocytes in Aldh1/1GFP mice (n=4 per group). g. Flow cytometry and (h) analysis of IL-3Rɑ+ microglia in the brain of WT and 5xFAD mice (n=5 5m. WT mice; n=11 5m. 5XFAD mice; n=3 8m. WT mice; n=5 8m. 5XFAD mice). i. Il3ra mRNA expression in sorted microglia (n=5 5m. WT mice; n=4 5m. and 8m. 5xFAD mice; n=3 8m. WT mice). j. STAT5 phosphorylation in ex-vivo microglia simulated with recombinant IL-3. k. Representative immunofluorescence images showing co-localization of IL-3Rɑ with Iba1 in the cortex of 5xFAD mice. l. Il3rɑ transcript expression in sorted microglia from WT, Trem2−/−, 5xFAD, and Trem2−/−5xFAD mice displayed as Log2 fold change (FC) for indicated comparisons (for 4 month old mice p=3.45e−27 for 5xFAD vs WT, p=3.4e−06 for Trem2−/−5xFAD vs WT, p=1.82e−08 for Trem2−/−5xFAD vs 5xFAD; for 8 month old mice p=1.12e−93 for 5xFAD vs WT, p=1.4e−13 for Trem2−/−5xFAD vs WT, p=1.6e−40 for Trem2−/−5xFAD vs 5xFAD; FDR<0.0002; for WT n=13M/14F at 4 m., n=8M/8F at 8m.; for Trem2−/− n=11M/12F at 4m., 2M/2F at 8m.; for 5xFAD n=14M/14F at 4 m., 10M/9F at 8m.; and for Trem2−/−5xFAD n=11M/11F at 4m., 9M/8F at 8m.). ns=not significant. m. Flow cytometry analysis of IL3Rɑ+ on microglia from 5xFAD and Trem2−/−5xFAD mice (n=4 mice per group). Groups are of evenly mixed sex. *p<0.05, **p<0.01, ***p<0.001. Error bars indicate mean ± SEM.
Fig. 3.
Fig. 3.. IL-3 signaling correlates with disease pathology in the brain of humans with Alzheimer’s disease.
a. Representative immunofluorescence images of the cortex of control subjects (C) or Alzheimer’s disease (AD) patients stained for IL-3 and GFAR b. Measurement of IL-3 levels in cortex tissue homogenates from control and AD patients (n=15 controls, n=23 AD patients, see Extended Data Table S6 for characteristics). c. Representative immunofluorescence images of the cortex of humans with or without Alzheimer’s disease (AD) stained for IL-3Rɑ and Iba1. d. qPCR analysis of fold change in IL3Rɑ expression in the frontal cortex of control non-demented individuals and AD patients (n=28 controls, n=30 AD patients, see Extended Data Table S7 for characteristics). e. Assessment of brain IL3Rɑ expression with APOE genotype (n=30 AD patients). f. Correlation of mean IL3Rɑ expression with years (yrs) of disease duration (n=30 AD patients). Correlation of IL3Rɑ expression with formic acid (FA)-soluble Aβ40 (g) and Aβ42 (h) in the frontal cortex of AD patients (n=23 AD patients). *p<0.05, **p<0.01, ***p<0.001. Open circles represent control subjects and red circles represent AD patients. Error bars indicate mean ± SEM.
Fig. 4.
Fig. 4.. IL-3 reprograms microglia promoting motility and clustering of β-amyloid in the murine brain and in a 3D human AD iPS triculture system.
a. Enumeration, by flow cytometry, of microglia in WT, 5XFAD, Il3−/−5XFAD mice (n=10 5xFAD mice; n=8 Il3−/−5XFAD mice). b. Multidimentional scaling (MDS) plot of RNAseq data from 5 month old 5XFAD and Il3−/−5XFAD mice (n=12, each data point represents 4 pooled mice of 2M/2F). c. Volcano plot indicating differentially regulated genes (FC>1.6, FDR<0.1, p<0.005) in microglia of 5XFAD and II3−/−5XFAD mice. d. Heatmap of key differentially regulated genes (FC>1.6, FDR<0.1, p<0.005), except Il3rɑ which is not significantly different between 5xFAD and Il3−/− 5xFAD microglia (n=12, each data point represents 4 pooled mice of 2M/2F). e. Pathway analysis of significantly regulated genes. f. Representative immunofluorescence images of microglia from 5XFAD and Il3−/−5XFAD mice along with skeletal analysis of microglia morphology (n=5 5xFAD mice; n=4 Il3−/−5XFAD mice). g. Representative immunofluorescence images of cortex sections from 5XFAD and Il3−/−5XFAD mice stained for Aβ (6E10), Iba1 and DAPI and quantification of the number of microglia within 25μm of Aβ plaques (n=5 5xFAD mice; n=7 Il3−/−5XFAD mice). h. Schematic depicting segmentation and spatial analysis along with computed density gradient and diffusion rate of microglia surrounding Aβ (n=5 5xFAD mice; n=7 Il3−/−5XFAD mice). i. Three dimensional confocal images of mouse cortex (634x250x634μm) stained for Aβ (6E10) and microglia (Iba1). All mouse data are of groups of 5 month old animals of evenly mixed sex. j. Scheme of 3D human AD triculture microfluidic system where human neuron ReNcell VM progenitor derived astrocytes and neuronal cells, with or without the K670N/M671L (Swedish) and V717I (London) familial AD mutations resulting overproduction of Aβ and neurofibrillary tangle (NFT) p-tau (AD), are plated in the central chamber while human iPS-derived microglia labeled with CellTracker are plated in side chambers. k. Confocal images demonstrated p-tau (PHF1) localization with neurons (Tuj1) and the presence of astrocytes (GFAP) in the central chamber and microglia (P2RY12) in the side chamber. l. ELISA quantification of Aβ40, Aβ38, and Aβ42 in media of central chamber in 3D microfluidic system plated with control or AD cells (n=3 per group). m. Confocal imaging of IL-3 localization to GFAP+ human astrocytes and IL-3Rɑ localization to CellTracker labeled human iPS-derived microglia in 3D microfluidics system. n. Flow cytometry quantification of iPS-derived microglia that have migrated to the central chamber of the 3D microfluidics system with or without addition of human recombinant IL-3 (n=3 per group). o. Representative confocal images and image quantification of iPS microglia migration to central chamber (n=3 per group for astrocytes+neurons and AD astrocytes+neurons; n=4 AD astrocytes+neurons+rlL3). p. CCL2 and CCL4 levels in media of 3D microfluidics system (n=3 per group). *p<0.05, **p<0.01, ***p<0.001. Error bars indicate mean ± SEM.
Fig. 5.
Fig. 5.. Astrocyte IL-3 or microglia IL-3Rɑ deletion instigate while IL-3 infusion resolves β-amyloid burden and cognitive decline.
a. Representative immunofluorescent images and Aβ quantification of brain sections probed for Aβ (6E10) and DAPI of 5-month-old Il3GFPfl/fl5xFAD and Il3GFPfl/flAldh1/1CreErt25xFAD mice injected with tamoxifen (n=6 Il3GFPfl/fl5xFAD mice; n=9 Il3GFPfl/flAldh1/1CreErt25xFAD mice). b. Levels of TBS- and FA-soluble Aβ40 and Aβ42 in cortex homogenates (n=6 Il3GFPfl/fl5xFAD mice; n=9 Il3GFPfl/flAldh1/1CreErt25xFAD mice). c. Gene expression in sorted microglia (n=6 Il3GFPfl/fl5xFAD mice; n=9 Il3GFPfl/flAldh1/1CreErt25xFAD mice). d. Representative immunofluorescent images and quantification of microglia-Aβ co-localization (n=6 Il3GFPfl/fl5xFAD mice; n=9 Il3GFPfl/flAldh1/1CreErt25xFAD mice). e.Y-maze testing time in new arm (n=6 Il3GFPfl/fl5xFAD mice; n=9 Il3GFPfl/flAldh1/1CreErt25xFAD mice). f. Representative immunofluorescent images and Aβ quantification of brain sections probed for Aβ (6E10) and DAPI of 5-month-old Il3rɑfl/fl5xFAD and Il3rɑfl/flCx3cr1CreErt25xFAD mice injected with tamoxifen. (n=7 per group). g. Levels of TBS- and FA-soluble Aβ40 and Aβ42 in cortex homogenates (n=7 per group). h. Representative immunofluorescent images and quantification of microglia-Aβ co-localization (n= per group). i. Y-maze testing time in new arm (n=8 Il3rɑfl/fl5xFAD mice; n=6 Il3rɑfl/flCx3cr1CreErt25xFAD). j. Experimental approach and representative immunofluorescent images of brain sections probed for Aβ (6E10) and DAPI from mice receiving brain infusion of PBS or recombinant IL-3. k. Quantification of cortex Aβ (n=6 Il3−/−5xFAD+PBS; n=5 Il3−/−5xFAD+rIL-3). l. Levels of TBS- and FA-soluble Aβ40 and Aβ42 in cortex homogenates (n=7 per group). m. Representative Immunofluorescence images and co-localization quantification of microglia within 25μm of Aβ in the cortex of mice receiving PBS or rIL-3 (n=6 Il3−/−5xFAD+PBS; n=5 Il3−/−5xFAD+rIL-3). n. Y-maze testing time in new arm (n=13 Il3−/−5xFAD+PBS; n=10 Il3−/−5xFAD+rIL-3). Filled circles represent male mice, open circles represent female mice. *p<0.05, **p<0.01, ***p<0.001. Error bars indicate mean ± SEM.

Comment in

Similar articles

Cited by

References

    1. Linnerbauer M, Wheeler MA & Quintana FJ Astrocyte Crosstalk in CNS Inflammation. Neuron 1–15 (2020) doi:10.1016/j.neuron.2020.08.012. - DOI - PMC - PubMed
    1. Vainchtein ID & Molofsky AV Astrocytes and Microglia: In Sickness and in Health. Trends Neurosci. 43, 144–154 (2020). - PMC - PubMed
    1. Castellani G & Schwartz M Immunological Features of Non-neuronal Brain Cells: Implications for Alzheimer’s Disease Immunotherapy. Trends in Immunology (2020) doi:10.1016/j.it.2020.07.005. - DOI - PubMed
    1. Fakhoury M Microglia and astrocytes in Alzheimer’s disease: implications for therapy. Curr. Neuropharmacol (2017) doi:10.2174/1570159x15666170720095240. - DOI - PMC - PubMed
    1. Long JM & Holtzman DM Alzheimer Disease: An Update on Pathobiology and Treatment Strategies. Cell (2019) doi:10.1016/j.cell.2019.09.001. - DOI - PMC - PubMed

Publication types