. 2021 Jul;28(7):554-563.
doi: 10.1038/s41594-021-00616-3. Epub 2021 Jul 8.

Heat-dependent opening of TRPV1 in the presence of capsaicin

Affiliations

Heat-dependent opening of TRPV1 in the presence of capsaicin

Do Hoon Kwon et al. Nat Struct Mol Biol. 2021 Jul.

Abstract

Transient receptor potential vanilloid member 1 (TRPV1) is a Ca2+-permeable cation channel that serves as the primary heat and capsaicin sensor in humans. Using cryo-EM, we have determined the structures of apo and capsaicin-bound full-length rat TRPV1 reconstituted into lipid nanodiscs over a range of temperatures. This has allowed us to visualize the noxious heat-induced opening of TRPV1 in the presence of capsaicin. Notably, noxious heat-dependent TRPV1 opening comprises stepwise conformational transitions. Global conformational changes across multiple subdomains of TRPV1 are followed by the rearrangement of the outer pore, leading to gate opening. Solvent-accessible surface area analyses and functional studies suggest that a subset of residues form an interaction network that is directly involved in heat sensing. Our study provides a glimpse of the molecular principles underlying noxious physical and chemical stimuli sensing by TRPV1, which can be extended to other thermal sensing ion channels.


Figures

Extended Data Fig. 1
Extended Data Fig. 1. TRPV1 data collection and processing.
Data processing procedures, a, Data processing flow chart for TRPV14C,APO, TRPV14C,CAP, TRPV125C,CAP, TRPV148C,APO. b, representative micrographs, see Table 1 for details. c, 2D classification images, d, 3D reconstructions, e, local resolution estimation, f, the Euler distribution plot, g, FSC curves for TRPV14C,APO, TRPV14C,CAP, TRPV125C,CAP, TRPV148C,APO, TRPV148C,CAP,OPEN and TRPV148C,CAP,INT, respectively. h, Data processing flow chart for TRPV148C,CAP,INT and TRPV148C,CAP,OPEN.
Extended Data Fig. 2
Extended Data Fig. 2. Representative Cryo-EM density of the TRPV1 structures.
a-f, cryo-EM density for subdomains in TRPV14C,APO (a, thresholding 0.014), TRPV14C,CAP (b, thresholding 0.014), TRPV125C,CAP (c, thresholding 0.025), TRPV148C,APO (d, thresholding 0.019), TRPV148C,CAP,INT (e, thresholding 0.28), TRPV148C,CAP,OPEN (f, thresholding 0.3). Structural elements are shown as sticks and EM density as gray mesh.
Extended Data Fig. 3
Extended Data Fig. 3. Structural features of the full-length TRPV1.
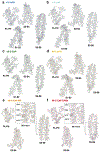
a, Architecture of the TRPV1 protomer with subdomains indicated: ankyrin repeat domain (ARD), coupling domain (CD), transmembrane helices S1-S6, TRP helix, and C-terminal domain (CTD). b, Cryo-EM density (half-map without symmetry) for the selectivity filter of TRPV14C,APO corresponding to putative sodium ions at 0.04 thresholding. c, Cryo-EM density of the turret and turret junction (0.012 thresholding). d, Close-up view of the outer pore and turret junction (0.012 thresholding). e, Interaction networks spanning the outer pore region and the S1-S4 domain (0.03 thresholding). Key residues interacting with E600 and E648 are shown as sticks with surrounding cryo-EM density. f, g, Cryo-EM density of the CD, TRP, ARD (f), and CTD (g). The ARD is colored in gold, the CD and its individual elements (HTHCD, βCD,) in sky blue, the TRP domain in dark green, and the CTD in orange. The cryo-EM density (gray) is shown at 0.012 thresholding. h, Superposition of a single protomer from TRPV14C,APO (blue) and TRPV148C,APO (gold). i, Superposition of a single protomer from TRPV14C,APO (blue) and TRPV14C,CAP (cyan).
Extended Data Fig. 4
Extended Data Fig. 4. Comparison of TRPV14C,APO and TRPV148C,APO.
a, b, Cryo-EM 3D reconstructions of TRPV14C,APO (a, blue) and TRPV148C,APO (b, gold), respectively. Outlines indicate AR1-AR4. c, Close-up comparison of the cytoplasmic domains between TRPV14C,APO (blue) and TRPV148C,APO (gold).
Extended Data Fig. 5
Extended Data Fig. 5. Comparison of TRPV14C,APO, TRPV14C,CAP, TRPV125C,CAP and the published structure of TRPV1 in the presence of capsaicin.
a, Close-up view of the S1-S4 domain of TRPV14C,APO (blue) and TRPV14C,CAP (cyan). Capsaicin (red) and phosphatidyl inositol (blue) molecules are shown as sticks. b, Close-up view of capsaicin in the vanilloid pocket of TRPV14C,CAP. The cryo-EM density is shown at 0.025 thresholding. c, Side view comparison of TRPV14C,CAP (cyan) and TRPV125C,CAP (green). d, Side view comparison of TRPV14C,CAP (green) and the published TRPV1 structure in the presence of capsaicin (PDB ID: 3J5R, brown).
Extended Data Fig. 6
Extended Data Fig. 6. Comparison between the overall structures of TRPV14C,APO, TRPV148C,CAP,OPEN and DkTx/RTx-bound TRPV1.
a, Comparison of TRPV14C,APO (silver), TRPV148C,CAP,OPEN (red), and DkTx/RTx-TRPV1 (blue) viewed from the intracellular side. ARD/CD movement occurs at an individual protomer level. b, Comparison of the S6b and TRP domain of TRPV14C,APO, TRPV148C,CAP,OPEN, and DkTx/RTx-TRPV1. c, Close-up view of TRPV14C,APO, TRPV148C,CAP,OPEN, and DkTx/RTx-TRPV1 in the cytoplasmic domains. d, Alternate angle and close-up view of TRPV14C,APO, TRPV148C,CAP,OPEN, and DkTx/ RTx-TRPV1 in the cytoplasmic domains.
Extended Data Fig. 7
Extended Data Fig. 7. Comparison of TRPV148C,CAP,OPEN and DkTx/RTx-bound TRPV1 structures.
a, The overlapping locations of phospholipid (TRPV148C,CAP,OPEN, red) and DkTx (DkTx/RTx-TRPV1, blue), shown as sticks and spheres, between the pore loop and pore helix. Several side chains are shown as sticks to illustrate the differences in the outer pore of the two structures. b, Structural differences between TRPV148C,CAP,OPEN and DkTx/RTx-TRPV1 at S6, the S4-S5 linker, and the TRP helix.
Extended Data Fig. 8
Extended Data Fig. 8. Solvent accessible surface area-based heat capacity change plots for the first and the second transitions.
a, b, ΔCPpred plots for the first (a) and second (b) transitions. For each transition, residues exhibiting positive ΔCPpred are plotted in the upper graph using log10(ΔCPpred), and residues exhibiting negative ΔCPpred are plotted in the lower graph using −log10(−ΔCPpred). The dotted line denotes the 15 J mol−1 K−1 threshold. ΔCPpred was calculated as described in the Methods. Residues for which the side chains were not resolved were not included in the calculation.
Extended Data Fig. 9
Extended Data Fig. 9. Rearrangement in the vanilloid pocket during the heat-dependent transitions.
a, Close-up view of the vanilloid binding sitein TRPV125C,CAP (green), TRPV148C,CAP,INT (orange), and TRPV148C,CAP,OPEN (red). Several key residues in capsaicin are shown as sticks. Dotted lines denote either H-bond or salt bridge interactions. The 310 helical region of S4 is indicated as 310. b, Close-up view of S5 and S6 in TRPV148C,CAP,INT (orange), and TRPV148C,CAP,OPEN (red). The π helical turn in S6 is denoted by π. c, Comparison of TRPV148C,CAP,OPEN (red) and DkTx/RTx-bound TRPV1 (PDB ID: 5IRX, blue). DkTx is shown as sticks and gray spheres; capsaicin is depicted as sticks only.
Fig. 1.
Fig. 1.. Structures of the full-length TRPV1 at six conditions.
a, Structures of TRPV1 determined at 4°C (TRPV14C,APO, blue), at 4°C with capsaicin (TRPV14C,CAP, sky blue), 25°C with capsaicin (TRPV125C,CAP, green), 48°C (TRPV148C,APO, gold), 48°C with capsaicin in the intermediate state (TRPV148C,CAP,INT, orange), and 48°C with capsaicin in the open state (TRPV148C,CAP,OPEN, red). b, Comparison of the pore domain structures. Only two subunits are shown for clarity with pore loop (PL) and pore helix (PH) as indicated. Diagonal distances at the two narrowest restriction points are shown. c, Pore radii calculated using the HOLE program for the TRPV1 structures as color coded in panel a and DkTx/RTx-TRPV1 (PDB 5IRX, gray). d,e, Superposition of the TRPV14C,APO (blue) and the TRPV14C,CAP,OPEN (red) structures (d) and cryo-EM maps (e), highlighting global conformational changes (d) and S6 gate conformation (e), respectively.
Fig. 2.
Fig. 2.. TRPV1 retains sensitivity to noxious heat after capsaicin sensitization and opens in a stepwise manner
a, b, Representative time course current traces of TRPV1-expressing oocytes with heat ramp and 100 nM capsaicin (CAP, turquoise) pre-treatment (a) or heat ramp (red) alone (b). Subsequent applications of 30 μM capsaicin (purple) then 30 μM ruthenium red (RR, black) were performed in both cases. The dotted line indicates zero current. The recorded temperature is shown in the bottom panel. c, Ratios of TRPV1 current responses to heat (49°C) relative to saturating capsaicin (30 μM) at room temperature for both protocols. Values for individual oocytes (open diamonds) with mean ±S.E.M. for control (0.54±0.06, n = 4 biological replicates) and 100 nM capsaicin treated (1.40±0.06, n = 6 biological replicates). d, Q10 values for TRPV1 expressing oocytes activated by heat alone or along with 100 nM capsaicin. Values for individual oocytes (open circles) with mean ±S.E.M. for control (21.90±4.50, n = 9 biological replicates) and 100 nM capsaicin treated (16.40±2.76, n = 8 biological replicates). Comparison between pores of TRPV125C,CAP, TRPV148C,CAP,10sec, TRPV148C,CAP,INT and TRPV148C,CAP,OPEN (e-h). Top-down view of the selectivity filter (SF, top) and bottom-up view of the S6 gate (S6, bottom) with cryo-EM density (gray) for: e. TRPV125C,CAP (green), 0.022 thresholding. f. TRPV148C,CAP,10s (pink), 0.045 thresholding. g. TRPV148C,CAP,INT (orange), 0.035 thresholding. h. TRPV148C,CAP,OPEN (red), 0.028 thresholding. Source data for c and d are available online.
Fig. 3.
Fig. 3.. Global conformational changes of the first noxious heat-induced transition.
a, Comparison of TRPV125C,CAP (green) and TRPV148C,CAP,INT (orange) viewed from the membrane. Arrows indicate movements of the ARD, CD, S1-S4 domain, and TRP helix. b, The same as (a), viewed from the intracellular side. ARD/CD movement occurs at an individual protomer level. c, TRPV148C,CAP,INT and TRPV148C,CAP,OPEN adopt similar overall conformations. d, Close-up view of TRPV125C,CAP and TRPV148C,CAP,INT cytoplasmic domains. e, Close-up view of TRPV125C,CAP and TRPV148C,CAP,INT S1-S4 domain. f, Close-up view of the S6b and TRP helix of TRPV125C,CAP, TRPV148C,CAP,INT, and TRPV148C,CAP,OPEN . The arrows indicate TRP helix and S6b movements.
Fig. 4.
Fig. 4.. Conformational changes in the outer pore during the second transition.
a, Extracellular view comparing the pore region in TRPV148C,CAP,INT (orange) and TRPV148C,CAP,OPEN (red). b, Close-up view of the outer pore. c, Close-up view of the pore loop and pore helix interface of adjacent subunits. Phospholipids are shown as spheres and sticks. d, Rearrangement of the interface between S6 and the outer pore, where +1 and −1 indicate features from neighboring subunits. Indicated residues are shown as sticks. Key regions abbreviated as turret junction (TJ), pore helix (PH) and pore loop (PL).
Fig. 5.
Fig. 5.. Conformational changes in the S6 gate during the second transition.
a, Rearrangement of the S6 π bulge (π) between TRPV148C,CAP,INT (orange) and TRPV148C,CAP,OPEN (red). b, Side chain rearrangements between S6 and the S4-S5 linker of the neighboring subunit. c, Temperature-dependent conformational change of M572 and M677: 25°C (green); 48°C, intermediate (orange); 48°C, open (red). Cryo-EM density thresholdings are 0.022, 0.019, and 0.018 respectively. d, e, Representative time-course whole cell current traces for wild type (WT) TRPV1 (d) and TRPV1 M572A (e). Currents elicited by heat (red) at −60 mV followed by application of 10 μM capsaicin (CAP, purple) then 50μM ruthenium red (black). The dotted blue line indicates zero current. The measured temperature is shown in the lower panel in red. f, Summary of current responses to heat (50°C) relative to saturating capsaicin (10 μM) at room temperature. Values for individual cells with mean ±S.E.M. (red lines) for WT TRPV1 (closed circles, 0.86±0.11, n = 4 biological replicates) and TRPV1 M572A (open squares, 0.11±0.02, n = 7 biological replicates). g, Q10 values obtained from WT TRPV1 and TRPV1 M572A expressing cells activated by heat. Values for individual cells are shown with mean ± S.E.M. for wild type (close circles, Q10 = 28.2 ±7.5, n = 4 biological replicates) and M572A (open squares, Q10 = 1.7±0.1, n = 6 biological replicates). Source data for f and g are available online.
Fig. 6.
Fig. 6.. Structure mapping of SASA-based heat capacity changes
a, Amino acid residues with relatively large heat capacity change (ΔCPpred > 15 J mol−1 K−1) during the first transition are highlighted as sticks and surfaces on the TRPV14C,APO structure. b, High ΔCPpred residues for the second transition mapped on the TRPV148C,CAP,INT structure. c, Zoomed in view of the outer pore region in b. High ΔCPpred residues for the second transition form a contiguous network encompassing interfaces between neighboring subunits comprising the pore loop (PL), pore helix(PH), S4, S5, and S6. d, The interaction network formed by high ΔCPpred residues for the first and second transitions are shown as surface representations in red (one subunit) and gray (the rest of the channel). e, f, Representative time-course of TRPV1-mediated currents for N628L (e) and N628D (f). Currents elicited by heat (red) at −60 mV followed by application of 10μM capsaicin (purple) and 50μM ruthenium red (black). The dotted blue line indicates zero current. The recorded temperature is shown in the lower panels in red. g, Q10 values obtained from WT, N628L and N628D TRPV1-expressing cells activated by heat. Data for individual cells are shown with mean ± S.E.M. (red lines) for wild type (solid circles, Q10 = 28.2 ±7.5, n=4 biological replicates N628L (open circles, Q10 = 2.6 ±1.5, n = 3 biological replicates) and N628D (open diamonds, Q10=86.0±18.2, n = 7 biological replicates). Source data for g are available online.
Fig 7.
Fig 7.. Working model of TRPV1 heat-activation.
In the 1st transition, all subdomains (ARD/CD, S1-S4, and TRP) become contracted. In the 2nd transition, local conformational changes of the outer pore and S6 result in dilation of the selectivity filter and S6 gate, opening the channel.

Similar articles

Cited by

References

    1. Caterina MJ & Julius D The vanilloid receptor: a molecular gateway to the pain pathway. Annu Rev Neurosci 24, 487–517 (2001). - PubMed
    1. Ramsey IS, Delling M & Clapham DE An introduction to TRP channels. Annu Rev Physiol 68, 619–47 (2006). - PubMed
    1. Vriens J & Voets T Heat sensing involves a TRiPlet of ion channels. Br J Pharmacol 176, 3893–3898 (2019). - PMC - PubMed
    1. Vay L, Gu C & McNaughton PA The thermo-TRP ion channel family: properties and therapeutic implications. Br J Pharmacol 165, 787–801 (2012). - PMC - PubMed
    1. Bandell M, Macpherson LJ & Patapoutian A From chills to chilis: mechanisms for thermosensation and chemesthesis via thermoTRPs. Curr Opin Neurobiol 17, 490–7 (2007). - PMC - PubMed

Methods-only references

    1. Goehring A et al. Screening and large-scale expression of membrane proteins in mammalian cells for structural studies. Nat Protoc 9, 2574–85 (2014). - PMC - PubMed
    1. Ritchie TK et al. Chapter 11 - Reconstitution of membrane proteins in phospholipid bilayer nanodiscs. Methods Enzymol 464, 211–31 (2009). - PMC - PubMed
    1. Zheng SQ et al. MotionCor2: anisotropic correction of beam-induced motion for improved cryo-electron microscopy. Nat Methods 14, 331–332 (2017). - PMC - PubMed
    1. Zhang K Gctf: Real-time CTF determination and correction. J Struct Biol 193, 1–12 (2016). - PMC - PubMed
    1. Zivanov J et al. New tools for automated high-resolution cryo-EM structure determination in RELION-3. Elife 7(2018). - PMC - PubMed

Publication types