. 2021 Jul 5;12(1):4127.
doi: 10.1038/s41467-021-24347-7.

Agonistic CD40 therapy induces tertiary lymphoid structures but impairs responses to checkpoint blockade in glioma

Affiliations

Agonistic CD40 therapy induces tertiary lymphoid structures but impairs responses to checkpoint blockade in glioma

Luuk van Hooren et al. Nat Commun. .

Abstract

Gliomas are brain tumors characterized by an immunosuppressive microenvironment. Immunostimulatory agonistic CD40 antibodies (αCD40) are in clinical development for solid tumors, but are yet to be evaluated for glioma. Here, we demonstrate that systemic delivery of αCD40 in preclinical glioma models induces the formation of tertiary lymphoid structures (TLS) in proximity of meningeal tissue. In treatment-naïve glioma patients, the presence of TLS correlates with increased T cell infiltration. However, systemic delivery of αCD40 induces hypofunctional T cells and impairs the response to immune checkpoint inhibitors in pre-clinical glioma models. This is associated with a systemic induction of suppressive CD11b+ B cells post-αCD40 treatment, which accumulate in the tumor microenvironment. Our work unveils the pleiotropic effects of αCD40 therapy in glioma and reveals that immunotherapies can modulate TLS formation in the brain, opening up for future opportunities to regulate the immune response.


Conflict of interest statement

S.M.M. is the founder and shareholder of Immuneed AB and Vivologica AB and is the Chief Development Officer and shareholder of Ultimovacs ASA/AB. None of the mentioned companies have taken part in the study nor do they have a financial gain of the specific subject matter described herein. The other authors declare no competing interests.

Figures
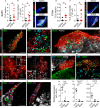
Fig. 1
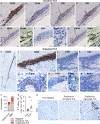
Fig. 1. αCD40 induced formation of tertiary lymphoid structures (TLS) in the brain of GL261 and CT-2A glioma-bearing mice.
Quantification of (a, d) the number (p = 0.0166; p = 0.0106 respectively) and (b, e) the total CD45+ surface area (p = 0.0415; p = 0.0216, respectively) of dense CD45+B220+ clusters per 80µm-thick section, in the brain of GL261 and CT-2A tumor-bearing mice. In a, b, n = 10mice/group. In d, e, n(rIgG2a) = 9 mice, n(αCD40) = 10 mice. Two-tailed Mann–Whitney test. c, f Representative immunofluorescent stainings of the quantified CD45+B220+ clusters in the GL261 and CT-2A models. Scale bars: 50 µm. go Immunofluorescent stainings of αCD40-induced TLS in the GL261 model showing TLS composition and organization. All images are representative of four independent experiments and 8 mice, and were taken from samples collected at the survival endpoint, between day 23 and day 35 post-tumor implantation (4–16 days after the last αCD40 treatment). Arrows in h indicate Ki67+ T cells. Arrows in j indicate dendrites of a CD35+ FDC interacting with surrounding B cells. Arrows in k indicate a CD21+ FDC interacting with surrounding B cells. Scale bars: 50 µm. pr Gene expression of TLS-inducing cytokines in laser capture micro-dissected CD45+B220+ clusters, compared with laser capture micro-dissected tumor tissue and normal brain tissue. arb. units = arbitrary units. n(TLS) = 6 LMD areas, n(tumor) = 4 LMD areas, n(brain) = 4 LMD areas. p p(TLS vs. tumor) = 0.0009, p(TLS vs. brain) = 0.0001. q p(TLS vs. tumor) = 0.0007, p(TLS vs. brain) = 0.0005. r p(TLS vs. tumor) = 0.0115, p(TLS vs. brain) = 0.0077. One-way ANOVA with Tukey’s multiple comparison correction. In a, b, d, e, black circle indicates rat IgG2a (rIgG2a) and red square indicates agonistic CD40 antibodies (αCD40). In pr, black circle indicates TLS, black square indicates Tumor and black triangle indicates Healthy brain tissue. For all graphs in this figure, *p < 0.05, **p < 0.01, ***p < 0.001. Bars: mean ± SEM. Source data are provided as a Source Data file.
Fig. 2
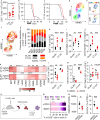
Fig. 2. B cells expressed LTα upon αCD40 stimulation and were required for TLS formation.
All panels except (dg) show data from GL261 tumor-bearing mice treated with rIgG2a or αCD40. ac Immunofluorescent staining of therapeutic rat antibodies (αRat) in TLS co-stained for a, b B220 and c CD11b and CD11c. Images are representative of three mice. Arrows: cells positive for αRat. White square areas are magnified to the right in b, c. Scale bars: 50 µm. d Representative images of murine CD19+ splenic B cells stimulated in vitro with rIgG2a or αCD40 antibodies at indicated time points. eg Gene expression of Lta, Ltb, and Tnfsf14 in B cells shown in d. n = 4 independent experiments. One-way ANOVA with Dunnett’s correction for multiple comparison. In e p(rIgG2a 6h vs. αCD40 48h) = 0.0017, p(rIgG2a 6h vs. αCD40 72h) = 0.005, p(αCD40 6h vs. αCD40 48h) = 0.0012, p(αCD40 6h vs. αCD40 72h) = 0.0035. In f p(αCD40 6h vs. αCD40 72h) = 0.0223. In g p(rIgG2a 6h vs. αCD40 48h) = 0.0439, p(αCD40 6h vs. αCD40 48h) = 0.0105, p(αCD40 6h vs. αCD40 72h) = 0.0169. hk Gene expression of Lta and Ltb in CD19+B220+ B cells sorted from h, i spleen and j, k cranial lymph nodes. h, i n(rIgG2a) = 4 mice, n(αCD40) = 5 mice. j, k n = 7 mice/group. h p = 0.0285, j p = 0.0452. Two-tailed t-test, *p < 0.05. l Representative plot of quantifications shown in m, n. m Quantification of CD19+B220+ brain-infiltrating B cells as a percentage of CD45+ cells at day 20. n(rIgG2a) = 8 mice; n(αCD40) = 7 mice. n Quantification of CD19+B220+ brain-infiltrating B cells as a percentage of CD45+ cells at day 25. n = 8 mice/group. p = 0.0003. m, n Two-tailed t-test. o Quantification of CD19+B220+ B cells as a percentage of CD45+ cells in the blood of tumor-bearing mice treated with rIgG2a or αCD40 antibodies, with (+) or without (−) B cell depletion with an αCD20 antibody. n = 4 mice/group. All indicated p-values are p < 0.0001. One-way ANOVA with Tukey’s correction for multiple comparison. p Quantification of the number of dense CD45+B220+ clusters per 80 µm-thick section in αCD40-treated tumor-bearing brains with (+) or without (−) B cell depletion with an αCD20 antibody. n(αCD40) = 8 mice, n(αCD20 + αCD40) = 5 mice. *p = 0.0234. Two-tailed t-test. hn Black circle indicates rat IgG2a (rIgG2a), red square indicates agonistic CD40 antibodies (αCD40). o, p Black circle indicates rIgG2a, black square indicates rIgG2a + αCD20, red circle indicates αCD40, red square indicates αCD40 + αCD20. For all graphs in this figure, *p < 0.05, **p < 0.01, ***p < 0.001, ****p < 0.0001. Bars: mean ± SEM. arb. units = arbitrary units. Source data are provided as a Source Data file.
Fig. 3
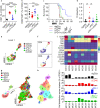
Fig. 3. Tertiary lymphoid structures were present in the brain of glioma patients and were associated with increased T cell abundance.
Immunohistochemical stainings of human glioma sections showing the composition of (ag) immature TLS characterized by a loose B cell core and (hn) organized TLS characterized by a compact core of B cells. Black square areas in eg and m are magnified to the right of each image. Scale bars: 50 µm. a, b Representative of 21 immature TLS. h, i Representative of 16 organized TLS. Stainings in cg and jn were performed on one representative immature TLS and one representative organized TLS. o Number of grade II/grade III glioma patients and glioblastoma (GBM) patients included in our cohort that stained negative for TLS (gray), positive for immature TLS (orange) or positive for organized TLS (red). n(Grade II + III, negative) = 7, n(Grade II + III, immature TLS) = 1, n(Grade II + III, organized TLS) = 2, n(GBM, negative) = 8, n(GBM, immature TLS) = 3, n(GBM, organized TLS) = 5. p Number of T cells infiltrating the tumor area in GBM patients negative for TLS (gray circle) versus GBM patients positive for TLS (orange triangle: immature TLS; red triangle: organized TLS). n = 7 patients/group. p = 0.0142. Two-tailed t-test. Bars: mean ± SEM. q Representative images of T cell infiltration in GBMs that were negative for TLS, positive for immature TLS or positive for organized TLS. Scale bars: 50 µm. For all graphs in this figure, *p < 0.05. Source data are provided as a Source Data file.
Fig. 4
Fig. 4. αCD40 therapy resulted in suppressed cytotoxic T cell responses in preclinical glioma models.
a Quantification of CD3+ T cells in the tumor area of αCD40-treated GL261 glioma-bearing brains that were positive (red square) or negative (red circle) for TLS. n(TLS−) = 7 mice, n(TLS+) = 10 mice. Two-tailed t-test. b, c Kaplan–Meier survival curve of GL261 (n = 19 mice for rIgG2a, n = 20 mice for αCD40 group) and CT-2A (n = 10 mice/group) tumor-bearing mice treated with αCD40 or rIgG2a on days 10, 13, 16, and 19 (as indicated by arrows). Black line: rIgG2a; Red line: αCD40. Log-rank test. dg HSNE analysis of multicolor flow cytometry data showing spatial clustering of tumor-infiltrating CD3+ cells in GL261 and CT-2A tumor-bearing mice treated with rIgG2a or αCD40. n(rIgG2a) = 5 mice, n(αCD40) = 7 mice. d HSNE analysis identified six meta-clusters (MC) of CD3+ T cells, expressing different levels of CD4 and CD8 (e). f Spatial distribution of CD3+ T cells from GL261 and CT-2A tumor-bearing brains, in rIgG2a-treated vs. αCD40-treated mice. g Frequency distribution of CD3+ T cells from each model and treatment group in each MC. hn Data was obtained from GL261 and CT-2A tumor-bearing mice treated with rIgG2a or αCD40. h CD8+ T cells as a percentage of CD45+ cells. n(GL261) = 8 mice/group, n(CT-2A) = 5 mice/group. p(GL261) < 0.0001, p(CT-2A) < 0.0001. in show data on CD8+ T cells. i CD44+CD62L cells, n(GL261-rIgG2a)&(CT-2A) = 5 mice/group; n(GL261-αCD40) = 7 mice. p(GL261) = 0.0031, p(CT-2A) < 0.0001. j CD127-KLRG1+ cells, n(GL261-rIgG2a)&(CT-2A) = 5 mice/group, n(GL261 αCD40) = 7 mice. p(GL261) = 0.003, p(CT-2A) = 0.0004. l CD69+ cells, n(GL261 rIgG2a) = 7 mice, n(GL261 αCD40) = 8 mice, n(CT-2A) = 5 mice/group. p(GL261) = 0.0024, p(CT-2A) = 0.0005. m CD107a+ cells, n(GL261) = 6 mice/group; n(CT-2A) = 5 mice/group. p(GL261) = 0.01, p(CT-2A) < 0.0001. n PD1+TIM3+LAG3+ cells n(GL261 rIgG2a) = 5 mice, n(GL261 αCD40) = 7 mice, n(CT-2A) = 5 mice/group. p(GL261) = 0.0462. hj and lm Two-tailed t-test. k Heat map showing the mean fluorescence intensity (MFI) of proliferation, exhaustion and memory markers on CD8+ T cells. n(GL261 rIgG2a) = 5 mice, n(GL261 αCD40) = 7 mice, n(CT-2A) = 5 mice/group. o Experimental layout used to obtain data shown in panels (pr). In brief, GL261 glioma-bearing mice were treated with rIgG2a or αCD40 on days 10, 13, 16, and 19 post-tumor implantation. On day 22 splenocytes were isolated, stained with cell trace violet (CTV) and re-stimulated in vitro with concanavalin A (ConA) for 24 h. p Percentage of CD8+ splenocytes in different generations (G), where cells in G0 did not proliferate and cells in G6 underwent six cycles of proliferation. An example of how generations were defined is shown in Supplementary Fig. 6a. p(G0) = 0.0464, p(G6) = 0.0069. Multiple t-test with Sidak-Bonferroni correction. q Mean fluorescence intensity (MFI) of CD69 on CD8+ splenocytes. p = 0.0248. r CD107a+ T cells as a percentage of CD8+ splenocytes. p = 0.0007. q, r Two-tailed t-test. pr n = 5 mice/group. For all graphs: *p < 0.05, **p < 0.01, ***p < 0.001, ****p < 0.0001. Bars: mean ± SEM. In all graphs except (a): black circle indicates rat IgG2a (rIgG2a), red square indicates agonistic CD40 antibodies (αCD40). Source data are provided as a Source Data file.
Fig. 5
Fig. 5. αCD40-induced T cell hypofunction impaired the efficacy of checkpoint blockade.
All panels show data from GL261 tumor-bearing mice treated with rIgG2a, αCD40, and/or αPD1. a, b Quantification of a CD8+ T cells as a percentage of CD45+ cells and b CD69+Ki67+ CD8 T cells in the brain in the indicated treatment groups. One-way ANOVA with Tukey’s correction for multiple comparisons. a All indicated p-values are p < 0.0001. b p(rIgG2a vs. αCD40+αPD1) = 0.0073, p(αCD40 vs. αPD1) = 0.0064, p(αPD1 vs. αCD40+αPD1)<0.0001. c Kaplan–Meier survival curves of mice treated as indicated on days 10, 13, 16, and 19 (as shown by arrows). n = 10 mice/group. p(rIgG2a vs. αPD1) = 0.0008, p(rIgG2a vs. αCD40+αPD1) = 0.0211, p(αCD40 vs. αPD1) = 0.0006, p(αPD1 vs. αCD40+αPD1) = 0.0025, p(αCD40 vs. αCD40+αPD1) = 0.037. Log-rank test. d Number of dense CD45+B220+ clusters per section identified in the indicated treatment groups. n(rIgG2a) = 8 mice, n(αCD40) = 10 mice, n(αPD1) = 11 mice, n(αPD1 + αCD40) = 17 mice. p(rIgG2a vs. αCD40) = 0.0139, p(αCD40 vs. αPD1) = 0.0101. One-way ANOVA with Tukey’s correction for multiple comparisons. e Spatial clustering of tumor-infiltrating CD3+ cells in GL261 tumors in different treatment groups, determined by Level-1 Hierarchical Stochastic Neighbor Embedding (HSNE) analysis of flow cytometry data. f Expression of CD4 and CD8 across the HSNE plot shown in e. g Three meta-clusters (MC) of CD3+ T cells were identified by Level-1 HSNE analysis. Two MC were classified as mainly CD4+ or CD8+. The latter was submitted to Level-2 HSNE analysis, revealing spatial clustering of tumor-infiltrating CD8+ cells in GL261 tumors in different treatment groups. h MCs of T cells identified in the HSNE plot in g. i Heat map showing the expression levels of proliferation, exhaustion, and memory markers on T cells in each MC. j Distribution of T cells from the indicated treatment group across each MC. a, b and ej n(rIgG2a) = 5 mice, n(αCD40)&(αPD1 + αCD40) = 7 mice, n(αPD1) = 8 mice. For all graphs in this figure, *p < 0.05, **p < 0.01, ***p < 0.001, ****p < 0.0001. Bars: mean ± SEM. Black circle indicates rat IgG2a (rIgG2a), red square or diamond indicate agonistic CD40 antibodies (αCD40), blue triangle (pointing up) indicates PD1 blocking antibodies (αPD1), green triangle (pointing down) indicates αPD1 + αCD40. Source data are provided as a Source Data file.
Fig. 6
Fig. 6. Systemic delivery of αCD40 was associated with a CD11b+ regulatory phenotype of B cells.
All panels besides panel g show data from GL261 tumor-bearing mice. a Heatmap showing the expression levels of activation and immunosuppression markers on B cells in the brain, in the indicated treatment groups. b, c Quantification of b IL-12+ and c IL-10+ cells as a percentage of B cells in the brain, in the indicated treatment groups. b p(rIgG2a vs. αCD40) = 0.0175, p(αCD40 vs. αPD1) = 0.0005, p(αPD1 vs. αPD1+αCD40) = 0.0140. c p(rIgG2a vs. αCD40) = 0.0081, p(rIgG2a vs. αPD1) = 0.0031, p(αCD40 vs. αPD1+αCD40) = 0.0047, p(αPD1 vs. αPD1+αCD40) = 0.0018. d CD11b+ cells as a percentage of B cells in the brain, in the indicated treatment groups. p(rIgG2a vs. αCD40) = 0.0453; p(rIgG2a vs. αPD1+αCD40) = 0.0391¸ p(αCD40 vs. αPD1) = 0.0236; p(αPD1 vs. αPD1+αCD40) = 0.0201. ad n(rIgG2a) = 4 mice, n(αCD40) = 7 mice, n(αPD1) = 5 mice, n(αPD1 + αCD40) = 7 mice. bd One-way ANOVA with Tukey’s correction for multiple comparisons. e, f Immunofluorescent stainings showing CD11b+ B cells e in the TLS and f in the tumor area. Scale bars: 50 µm. g Quantification of CD11b+ cells as a percentage of wt murine splenic B cells after in vitro stimulation with the indicated agents. n(LPS) = 7 mice, n(LPS + rIgG2a) = 4 mice, n(LPS + αCD40) = 4 mice, n(LPS + IL-10) = 3 mice. One way ANOVA with Tukey’s correction for multiple comparisons. p(LPS vs. LPS+αCD40) = 0.0002, all other indicated p-values are p < 0.0001. h Mean fluorescence intensity (MFI) of MHC-II on CD11b+ vs CD11b B cells in the brain, in the indicated treatment groups. n(rIgG2a) = 4 mice, n(αCD40) = 7 mice, n(αPD1) = 5 mice, n(αPD1 + αCD40) = 7 mice. p(αCD40) = 0.0002; p(αPD1+αCD40) = 0.0017. Multiple t-test with Sidak-Bonferroni correction. i, j MFI of CD3 on i CD8+ and j CD4+ T cells in the indicated treatment groups. One-way ANOVA with Tukey’s correction for multiple comparisons. i n(rIgG2a) = 6 mice, n(αCD40)&(αPD1 + αCD40) = 7 mice, n(αPD1) = 8 mice. All indicated p-values are p < 0.0001. j n(rIgG2a) = 5 mice, n(αCD40)&(αPD1 + αCD40) = 7 mice, n(αPD1) = 8 mice. p(rIgG2a vs. αCD40) = 0.0002, p(rIgG2a vs. αPD1+αCD40) = 0.0004. All indicated p-values are p < 0.0001. k Quantification of the number of CD3+ T cells in the tumor area in rIgG2a- or αCD40-treated mice with or without B cell depletion. n(rIgG2a)&(rIgG2a + αCD20) = 6 mice, n(αCD40) = 17 mice, n(αCD40 + αCD20) = 5 mice. p(αCD40 vs. αCD40-B) = 0.0442. One-way ANOVA with Tukey’s correction for multiple comparisons. bd, i, j Black circle indicates rat IgG2a (rIgG2a), red square indicates agonistic CD40 antibodies (αCD40), blue triangle (pointing up) indicates PD1 blocking antibodies (αPD1), green triangle (pointing down) indicates αPD1 + αCD40. g Empty circle indicates lipopolysaccharide (LPS), black circle indicates LPS + rat IgG2a (rIgG2a), red square indicates LPS + agonistic CD40 antibodies (αCD40), pink triangle (pointing up) indicates LPS + interleukin 10 (IL-10). h Black circle indicates CD19+CD11b B cells, pink circle indicated CD19+CD11b+. k Black circle indicates rIgG2a, empty circle indicates rIgG2a + αCD20, red square indicates αCD40, empty square indicates αCD40 + αCD20. For all graphs in this figure, *p < 0.05, **p < 0.01, ***p < 0.001, ****p < 0.0001. Bars: mean ± SEM. Source data are provided as a Source Data file.

Similar articles

Cited by

References

    1. Fabian, D. et al. Treatment of glioblastoma (GBM) with the addition of tumor-treating fields (TTF): a review. Cancers11, 174 (2019). - PMC - PubMed
    1. Wilson, R. A. M., Evans, T. R. J., Fraser, A. R. & Nibbs, R. J. B. Immune checkpoint inhibitors: new strategies to checkmate cancer. Clin. Exp. Immunol.191, 133–148 (2017). - PMC - PubMed
    1. Wainwright DA, et al. Durable therapeutic efficacy utilizing combinatorial blockade against IDO, CTLA-4, and PD-L1 in mice with brain tumors. Clin. Cancer Res. 2014;20:5290–5301. doi: 10.1158/1078-0432.CCR-14-0514. - DOI - PMC - PubMed
    1. Brahm, C. G. et al. The current status of immune checkpoint inhibitors in neuro-oncology: a systematic review. Cancers12, 586 (2020). - PMC - PubMed
    1. Hambardzumyan D, Gutmann DH, Kettenmann H. The role of microglia and macrophages in glioma maintenance and progression. Nat. Neurosci. 2016;19:20–27. doi: 10.1038/nn.4185. - DOI - PMC - PubMed

Publication types

MeSH terms