. 2021 Jul;53(7):1036-1049.
doi: 10.1038/s41588-021-00888-x. Epub 2021 Jun 28.

Orphan CpG islands amplify poised enhancer regulatory activity and determine target gene responsiveness

Affiliations

Orphan CpG islands amplify poised enhancer regulatory activity and determine target gene responsiveness

Tomas Pachano et al. Nat Genet. 2021 Jul.

Abstract

CpG islands (CGIs) represent a widespread feature of vertebrate genomes, being associated with ~70% of all gene promoters. CGIs control transcription initiation by conferring nearby promoters with unique chromatin properties. In addition, there are thousands of distal or orphan CGIs (oCGIs) whose functional relevance is barely known. Here we show that oCGIs are an essential component of poised enhancers that augment their long-range regulatory activity and control the responsiveness of their target genes. Using a knock-in strategy in mouse embryonic stem cells, we introduced poised enhancers with or without oCGIs within topologically associating domains harboring genes with different types of promoters. Analysis of the resulting cell lines revealed that oCGIs act as tethering elements that promote the physical and functional communication between poised enhancers and distally located genes, particularly those with large CGI clusters in their promoters. Therefore, by acting as genetic determinants of gene-enhancer compatibility, CGIs can contribute to gene expression control under both physiological and potentially pathological conditions.


Conflict of interest statement

Competing Interests

The authors declare no competing interests.

Figures
Extended Data Fig. 1
Extended Data Fig. 1. Genetic and epigenetic features of the oCGIs associated with PEs.
a, Comparison of CpG%, observed/expected CpG ratio, GC% and sequence length between random regions (n=436000), NMIs associated to PE-distal (PE-NMIs; n=345) and NMIs associated to the devTSS (devTSS-NMIs; n=1476) (Methods). The p-values were calculated using two-sided unpaired Wilcoxon tests with Bonferroni correction for multiple testing; black numbers indicate median fold-changes; green numbers indicate non-negligible Cliff Delta effect sizes. The coloured area of the violin plot represents the expression values distribution and the center line represents the median. b, H3K27me3 ChIP-seq levels, around: PE-distal with overlapping TFBS/p300 peaks and CAP-CGIs (n=135), PE-distal with TFBS/p300 peaks separated by 1bp-1kb from CAP-CGIs (n=65), PE-distal with TFBS/p300 peaks separated by 1-3kb from CAP-CGIs (n=53), PE-distal without CAP-CGIs within 3kb (n=254) and AEs without CAP-CGI within 3kb (n=8115). c, % of CpG methylation at CAP-CGI associated with PE-distal (PE-CAP-CGI; n=276) and CAP-CGI associated with the TSS of developmental genes (devTSS-CAP-CGI; n=1926) in the indicated cell types (Methods). d, For the identification of the PE Sox1(+35)CGI deletion, primer pairs flanking each of the deletion breakpoints (1+3 and 4+2), located within the deleted region (5+6) or amplifying a large or small fragment depending on the absence or presence of the deletion (1+2) were used. e, H3K27me3 levels at PE Sox1(+35) were measured by ChIP-qPCR in WT ESCs and in n=2 independent PE Sox1(+35)CGI -/- ESCs clones using primers adjacent to the deleted region. The bars display the mean of n=3 technical replicates (black dots). f, Independent biological replicate for the data presented in Fig. 1d. Sox1 expression was investigated by RT-qPCR in ESCs and AntNPC with the indicated genotypes. N=2 independent PE Sox1 CGI -/- ESC clones (circles and diamonds) and n=1 PE Sox1 -/- clone were studied. For each cell line, n=2 replicates of the AntNPC differentiation were performed. Expression values were normalized to two housekeeping genes (Eef1a and Hprt) and are presented as fold-changes with respect to WT ESCs. The coloured area of the violin plot represents the expression values distribution and the center line represents the median.
Extended Data Fig. 2
Extended Data Fig. 2. Modular engineering of PEs modules within the Gata6-TAD and FoxA2-TAD.
a, Epigenomic and genomic features of two previously characterized PEs (PE Six3(-133); PE Lmx1b(+59)) in which the oCGIs overlap with conserved sequences bound by p300 and, thus, likely to contain relevant TFBS. b, The different PE Sox1(+35) insertions were identified using primer pairs flanking the insertion borders (1+3 and 4+2; 1+5 and 6+2; 1+3 and 6+2), amplifying potential duplications (4+3, 3+2 and 4+1; 6+5, 5+2 and 6+1) and amplifying a large or small fragment depending on the absence or presence of the insertion (1+2), respectively. The PCR results obtained for WT ESCs and for two ESC clonal lines with homozygous insertions of the PE Sox1(+35) modules in the Gata6-TAD are shown. c, Independent biological replicate for the data presented in Fig. 2b. d-e, Strategy used to insert the PE Wnt8b(+21) (d) or the PE Sox1(+35) (e) components into the Gata6-TAD (d) or Foxa2-TAD (e), respectively. The right panels shows the TADs in which Gata6 (d) or Foxa2 (e) are included according to publically available Hi-C data,, with the red triangle indicating the integration site of the PE modules, approximately 100 Kb downstream of Gata6 (d) or Foxa2 (e). f-g, For identifying the successful insertion of the different PE Sox1(+35) (f) or PE Wnt8b(+21) (g) modules, primer pairs flanking the insertion borders (1+3 and 4+2; 1+5 and 6+2; 1+3 and 6+2), amplifying potential duplications (4+3, 3+2 and 4+1; 6+5, 5+2 and 6+1) and amplifying a large or small fragment depending on the absence or presence of the insertion (1+2), respectively, were used. The PCR results obtained for two ESC clonal lines with homozygous insertions of the indicated PE modules in the Foxa2-TAD (f) or Gata6-TAD (g), respectively, are shown. h-i, Independent biological replicates for the data shown in Fig. 2c (h) and Fig. 2d (i). In (c), (h) and (i), the expression differences between AntNPCs with the TFBS+CGI module and AntNPCs with the other PE modules were calculated using two-sided non-paired t-tests (**: foldchange>2 & p<0.001; *: foldchange> 2 & p<0.05; ns: not significant; fold-change<2 or p>0.05).
Extended Data Fig. 3
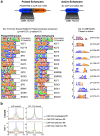
Extended Data Fig. 3. PEs are enriched in CpG-rich motifs and are bound by CxxC-domain containing proteins.
a, Comparison of the TF motifs enriched in either PEs with a CAP-CGI in <3kb and active enhancers without CAP-CGIs in <3kb. Motif enrichment analyses were performed with Homer (left) and AME (right). b, ChIP-seq signals for KDM2B (upper panel) and TET1 (lower panel) are shown around: PE-distal with overlapping TFBS/p300 peaks and CAP-CGIs (n=135), PE-distal with TFBS/p300 peaks separated by 1bp-1kb from CAP-CGIs (n=65), PE-distal with TFBS/p300 peaks separated by 1-3kb from CAP-CGIs (n=53) and PE-distal without CAP-CGIs within 3kb (n=254). ChIP-seq profile plots were generated using either the p300 peaks (left) or the CAP-CGIs (right) associated with the PEs as midpoints.
Extended Data Fig. 4
Extended Data Fig. 4. Engineering of ESC lines containing the PE Sox1(+35) TFBS and an artificial CGI within the Gata6-TAD.
a, Strategy used to insert the PE Sox1(+35)TFBS alone or together with an aCGI into the Gata6-TAD. The upper left panel shows the epigenomic and genetic features of the PE Sox1(+35). The lower left panel shows the PE Sox1(+35) modules inserted into the Gata6-TAD. The right panel shows the Gata6-TAD according to publically available Hi-C data,. The red triangle indicates the integration site of the PE Sox1(+35) modules approximately 100 Kb downstream of Gata6. b, For the identification of the PE Sox1(+35)TFBS+aCGI insertion, primer pairs flanking the insertion borders (1+3 and 4+2), amplifying potential duplications (4+3 and 4+4) and amplifying a large or small fragment depending on the absence or presence of the insertion (1+2), respectively, were used. The PCR results obtained for two ESC clonal lines with homozygous insertions of PE Sox1(+35)TFBS+aCGI in the Gata6-TAD are shown. c, Independent biological replicate for the data presented in Fig. 2f. The expression differences between AntNPCs with the TFBS+CGI module and AntNPCs with the other PE modules were calculated using two-sided non-paired t-tests (*: foldchange> 2 & p<0.05; ns: not significant; fold-change<2 or p>0.05). d, For the identification of the aCGI insertion alone, primer pairs flanking the insertion borders (1+3 and 4+2), amplifying potential duplications (4+3 and 4+4) and amplifying a large or small fragment depending on the absence or presence of the insertion (1+2), respectively, were used. The PCR results obtained from two ESC clonal lines with heterozygous insertions of aCGI in the Gata6-TAD are shown. e, The expression of Gata6 and Sox1 was measured by RT-qPCR in cells that were either WT or heterozygous for the aCGI insertion in the Gata6-TAD (two different clones; circles and diamonds). For each cell line, n=2 replicates of the AntNPC differentiation were performed. The results obtained in n=2 independent biological replicates are presented in each panel (Rep1 and Rep2).
Extended Data Fig. 5
Extended Data Fig. 5. Gata6 expression patterns in cell lines with the PE Sox1(+35) modules inserted within the Gata6-TAD.
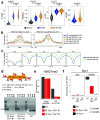
a, Gata6 and Sox1 expression was measured by RT-qPCR in ESCs and at intermediate stages of AntNPC differentiation (Day 3 and Day 4). The analysed cells were either WT or homozygous for the insertions of the different PE Sox1(+35) modules within the Gata6-TAD. For the cells with the PE module insertions, n=1 clonal cell line was studied. For each cell line, n=2 replicates of the AntNPC differentiation were performed. Expression values were normalized to two housekeeping genes (Eef1a and Hprt) and are presented as fold-changes with respect to WT ESCs. b, Quantification of cells expressing GATA6 or SOX1 according to immunofluorescence assays as the ones shown in Fig 2g. The analysed cells were either WT of homozygous for the insertions of the different PE Sox1(+35) modules within the Gata6-TAD. c, The expression patterns of GATA6 (upper panel) and SOX1 (lower panel) were investigated by immunofluorescence in WT ESCs or AntNPCs that were either WT, homozygous for the insertion of the PE Sox1(+35)TFBS+aCGI in the Gata6-TAD or heterozygous for the insertion of the aCGI alone in the Gata6-TAD. Nuclei were stained with DAPI. Scale bar = 100μm. d, Quantification of cells expressing GATA6 or SOX1 according to the immunofluorescence assays described in (c). In (b) and (d), the bars display the mean of n=3 technical replicates (black dots).
Extended Data Fig. 6
Extended Data Fig. 6. Epigenetic and topological characterization of the Gata6-TAD cell lines.
a, Bisulfite sequencing data presented in Fig. 3a for the indicated Gata6-TAD cell lines. The circles correspond to individual CpG dinucleotides located within the TFBS module. Unmethylated CpGs are shown in white, methylated CpGs in black and not-covered CpGs in gray. b, Chromatin accessibility at the endogenous PE Sox1(+35) and the Gata6-TAD insertion site (P1 and P2) were measured by FAIRE-qPCR in cells with the indicated genotypes. c, DNA methylation and nucleosome occupancy at the TFBS were simultaneously analyzed by NOME-PCR in the indicated Gata6-TAD ESC lines. In the upper panels, the black and white circles represent methylated or unmethylated CpG sites, respectively. In the lower panels, the blue or white circles represent accessible or inaccessible GpC sites for the GpC methyltransferase, respectively. Red bars represent inaccessible regions large enough to accommodate a nucleosome. The dotted line indicates where the TFBS starts. The grey shaded area represents a nucleosome-depleted region. d, Scatter plots showing population-averaged nucleosome occupancy (red) and DNA methylation (black) levels within the TFBS in the indicated Gata6-TAD ESC lines. The grey shaded area represents a nucleosome depleted region. e-f, H3K4me1, H3K4me3, H2AK119ub, CBX7 and PHC1 levels at the endogenous PE Sox1(+35) and the Gata6-TAD insertion site (P1 and P2) were measured by ChIP-qPCR in cells with the indicated genoytpes. ChIP-qPCR signals were calculated as described in Fig. 3. g, 4C-seq experiments were performed using the Gata6 promoter as a viewpoint in AntNPC with the indicated genotypes. h, Pile-up plots showing average Hi-C, signals in ESC between two groups of PE-gene pairs: PEs and developmental genes with CGI-rich promoters; PEs and genes with CGI-poor promoters. For each PE-gene pair, both the PE and the gene were located within the same TAD. Left panels include all the considered PE-gene pairs (n=401 pairs for developmental genes; n=900 for CGI-poor promoters; middle panels includes PE-gene pairs with the same genomic size in the two groups (n=401 pairs); right panels consist of PE-gene pairs with the same genomic size and genes with expression levels <1 FPKM (n=290 pairs) (Methods).
Extended Data Fig. 7
Extended Data Fig. 7. Generation of cell lines with engineered PE Sox1(+35) modules within the Gria1-TAD and global characterization of H3K27ac and eRNA levels at active enhancers.
a, ESC clonal lines with insertions of the different PE Sox1(+35) modules were identified using primer pairs flanking the insertion borders (1+3 and 4+2; 1+5 and 6+2; 1+3 and 6+2), amplifying potential duplications (4+3, 3+2 and 4+1; 6+5, 5+2 and 6+1) and amplifying a large or small fragment depending on the absence or presence of the insertion (1+2), respectively. The PCR results obtained for WT ESCs or two ESC clonal lines with homozygous insertions of the different PE Sox1(+35) modules in the Gria1-TAD are shown. b, Independent biological replicate for the data presented in Fig. 4b. The expression differences between AntNPCs with the TFBS+CGI module and AntNPCs with the other PE modules were calculated using two-sided non-paired t-tests (ns: not significant; fold-change<2 or p>0.05). c, Bisulfite sequencing analyses of ESC lines with the indicated PE Sox1(+35) modules inserted in the Gria1-TAD. The circles correspond to individual CpG dinucleotides located within the TFBS: unmethylated CpGs (white), methylated CpGs (black) and not-covered CpGs (gray) are shown. The plot on the right summarizes the DNA methylation levels measured within the TFBS in the indicated ESC lines. d, Active enhancers (AEs) identified in ESCs based on the presence of distal H3K27ac peaks were classified into three categories (Methods): Class I (AEs in TADs containing only poorly expressed genes; n=271(left); n=340 (middle, right); Class II (AEs in TADs with at least one highly expressed gene; n=271(left); n=2353(middle); n=340(right)); Class III (AEs whose closest genes in the same TAD is highly expressed; n=271(left); n=1262(middle); n=340(right)). The violin plots show the H3K27ac and eRNA levels in ESC for each AE category. P-values were calculated using unpaired Wilcoxon tests with Bonferroni correction for multiple testing; the numbers in black indicate the median fold-changes between the indicated groups; the coloured numbers correspond to Cliff Delta effect sizes: negligible (red) and non-negligible (green). In the left and right panels, eRNA levels for the three enhancers classes are compared after correcting for H3K27ac differences (Methods).
Extended Data Fig. 8
Extended Data Fig. 8. Generation and characterization of cell lines with PE insertions at the Gria1 and Sox7/Rp1l1 TADs.
a, H2AK229ub and SUZ12 levels at the endogenous PE Sox1(+35), the Gria1 promoter and the Gria1-TAD insertion site (P1 and P2; Fig. 4d) were measured by ChIP-qPCR in ESCs with the indicated genotypes. ChIP-qPCR signals were calculated as in Fig. 3. b, ESC clonal lines in which a pCGI was inserted 380bp upstream of the Gria1-TSS in cells with the indicated PE Sox1(+35) modules 100Kb upstream from Gria1 were identified using the indicated primer pairs. PCR results for clonal ESC lines with the indicated double homozygous insertions are shown. c, eRNA levels at the endogenous PE Sox1(+35) and the Gria1-TAD insertion site (P1 and P2) were measured by RT-qPCR in cells with the indicated genotypes. Expression values were calculated as in Fig. 3. d, Strategy to insert the indicated PE Sox1(+35) modules 380bp upstream (red triangle) of the Gria1-TSS. e, ESC clonal lines with the PE Sox1(+35) modules 380bp upstream of the Gria1-TSS were identified using the indicated primer pairs. PCR for ESC clonal lines with homozygous insertions of the indicated PE Sox1(+35) modules are shown. f, Independent biological replicate for the data presented in Fig. 5e. g, ESC clonal lines with the PE Sox1(+35) modules within the Sox7/Rp1l1-TAD were identified using primers flanking the insertion borders (1+3 and 4+2; 1+3 and 6+2), amplifying potential duplications (4+3, 3+2 and 4+1) and amplifying a large or small fragment depending on the absence or presence of the insertion (1+2), respectively. PCR results for ESC clonal lines with homozygous insertions of the indicated PE Sox1(+35) modules are shown. h, Independent biological replicate for the data presented in Fig. 5g. In (a) and (c), the bars display the mean of n=3 technical replicates (black dots). In (f) and (h), the expression differences between AntNPCs with the TFBS+CGI module or the other PE modules were calculated using two-sided non-paired t-tests (***: foldchange> 2 & p<0.0001; ns: not significant; fold-change<2 or p>0.05).
Extended Data Fig. 9
Extended Data Fig. 9. Generation of ESC lines with structural variants.
a, ESC lines with the Six3/Six2 TAD boundary deletion were identified using primers flanking the deleted region (1+3 and 4+2), amplifying the deleted fragment (5+6) and amplifying a large or small fragment depending on the absence or presence of the deletion (1+2), respectively. The PCR results for two ESC clonal lines with 36Kb homozygous deletions (del36) are shown. b, ESC lines with the Six3/Six2 inversion were identified using primer pairs flanking the inverted region (1+3, 4+2, 1+4 and 3+2) and amplifying potential duplications (4+3, 3+3 and 4+4). The PCR results for two ESC clonal lines with 110Kb homozygous inversions (inv110) are shown. c, Epigenomic and genetic features of a CTCF binding site (CBS; highlighted in grey) located upstream of the PE Six1(-133) (highlighted in yellow). d, ESC lines with the CBS deletion were identified using primers flanking the deleted region (1+2) or located in the CBS (3+4). The PCR results for two ESC clonal lines with homozygous CBS deletions are shown. e, The expression of Six3 and Six2 was measured by RT-qPCR in cells with the indicated genotypes. For each of the engineered structural variants, n=2 independent clonal cell lines were generated (circles and diamonds). In each plot, the number of circles and/or diamonds correspond to the number AntNPC differentiations performed. The results obtained in n=2 independent biological replicates are presented in each panel (Rep1 and Rep2). Expression values are presented as fold-changes with respect to WT ESCs. f, ESC lines with the Lmx1a-TAD boundary inversion were identified using primers flanking the inverted region (1+3, 4+2, 1+4 and 3+2) and amplifying potential deletions (1+4) or duplications (4+3, 3+3 and 4+4). The PCR results for three ESC clonal lines with 260 Kb homozygous inversions (inv260) are shown.
Extended Data Fig. 10
Extended Data Fig. 10. Examples of human congenital diseases caused by structural variants that disrupt developmental loci with PE-associated oCGIs.
a, Upper panel: heterozygous inversion in a patient with Branchio-oculo-facial syndrome (BOFS). Lower panel: epigenomic and genetic features of TFAP2A neural crest (NC) cognate enhancers (left), 6q16.2 genes (middle) and TFAP2A (right). In the lower left panel, enhancer reporter assays in chicken embryos are shown for two representative TFAP2A enhancers. Computational CGI and NMIs are represented as green rectangles. The inversion places one TFAP2A allele into a novel TAD and impairs its normal expression in NC cells due to the physical disconnection from its enhancers. TFAP2A has a promoter with a large CGI cluster and marked with a broad H3K27me3 domain in ESCs. Some TFAP2A NC enhancers are associated with oCGIs and marked with H3K27me3 in ESCs. Moreover, this inversion places genes originally found within the 6q16.2 locus in proximity of the TFAP2A NC enhancers within a shuffled domain. The promoters of these 6q16.2 genes (i.e GPR63 and NDUFAF4) contain a short CGI centered on their TSSs. In agreement with our findings, none of the 6q16.2 genes is responsive to the TFAP2A NC enhancers. b, Upper panel: deletion found in families with brachydactyly involving a TAD boundary located between the EPHA4 and the PAX3 loci. Lower panel: epigenomic and genetic features of the Epha4 cognate enhancers in the mouse E11.5 limb (left) and in human ESCs (right). Representative reporter assay in E11.5 mouse embryos for the hs1507 element is shown in the middle. The deletion includes EPHA4, a gene highly expressed in the developing limb, and the TAD boundary separating the EPHA4 and PAX3 TADs. As a result, enhancers that control EPHA4 expression in the limb establish ectopic interactions with PAX3 (i.e. enhancer adoption) and strongly induce its expression in the limb. PAX3 promoter contains a large CGI cluster and is marked with H3K27me3 in ESCs, while one of the major EPHA4 enhancers (hs1507) is associated with an oCGI and is marked with H3K27me3 in ESCs. The high responsiveness of PAX3 to the EPHA4 enhancers is in agreement with our findings.
Fig. 1
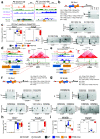
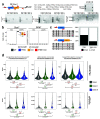
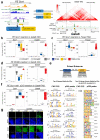
Fig. 1. Genetic properties and functional relevance of orphan CGIs associated with PEs.
a, Percentage of PEs within the indicated maximum distances (0.25 kb or 3 kb) of a CGI identified by CAP-seq (left), a NMI (middle) or a computationally defined CGI (right). b, Comparison of the CpG%, observed/expected CpG ratio, GC% and sequence length between random regions (n = 436,000), CAP-CGIs associated with PE-distal (PE-CAP-CGI; n = 276) and CAP-CGIs associated with the TSS of developmental genes (devTSS-CAP-CGI; n = 1,926) (Methods). P values were calculated using unpaired two-sided Wilcoxon tests with Bonferroni correction for multiple testing; black numbers indicate median fold-changes; green numbers indicate non-negligible Cliff’s delta effect sizes. The center line of the violin plot represents the median, the boxes encompass the interquartile range and the whiskers extend to the minimum and maximum. c, Percentage of CAP-CGI block sizes (1, 2 or ≥3 CAP-CGIs) associated with PE-distal (n = 253) or the TSS of developmental genes (devTSS; n = 1,522 with at least one CAP-CGI in <3 kb. The devTSS were classified in two groups based on the length of the H3K27me3 domains associated with them (>6 kb (n = 1,522) and >10 kb (n = 599)). d, Left panel: ChIP-seq data from ESCs (p300 and H3K27me3) and AntNPCs (H3K27ac) at the Sox1 locus. The PE Sox1(+35) is highlighted in yellow. Right panel: close-up view of the PE Sox1(+35) with additional epigenomic and genomic data, including a computationally defined CGI. Vert. Cons. = vertebrate PhastCons. e, Sox1 expression was investigated by RT-qPCR in cells that were either WT, homozygous for a deletion of the PE Sox1(+35) CGI (PE Sox1 CGI-/-) or homozygous for a deletion of the complete PE Sox1(+35) (PE Sox1-/-). N = 2 independent PE Sox1 CGI-/- ESC clones (circles and diamonds) and n = 1 PE Sox1-/- clone were studied. For each ESC clonal line, n = 2 replicates of the AntNPC differentiation were performed. Expression values were normalized to two housekeeping genes (Eef1a and Hprt) and are presented as fold-changes with respect to WT ESCs. The colored area of the violin plot represents the expression values distribution and the center line represents the median. N = 1 independent biological replicate of this experiment is shown in Extended Data Figure 1f.
Fig. 2
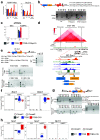
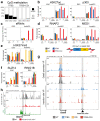
Fig. 2. Modular engineering of PEs reveals major regulatory functions for orphan CGIs.
a, Strategy to insert the PE Sox1(+35) components into the Gata6-TAD. Left: epigenomic and genetic features of the PE Sox1(+35). The oCGI is not evolutionary conserved. Middle: the three combinations of PE Sox1(+35) modules inserted into the Gata6-TAD. Right: TAD in which Gata6 is located (i.e. Gata6-TAD),. The red triangle indicates the integration site of the PE Sox1(+35) modules approximately 100 kb downstream of Gata6. b-d and f, The expression of Gata6 (b, d and f), Foxa2 (c), Sox1 (b, c and f) and Wnt8b (d) was measured by RT-qPCR in ESCs and AntNPCs that were either WT or homozygous for the insertion of the different PE Sox1(+35) (b-c) or PE Wnt8b(+21) (d) modules. In (f), the PE Sox1(+35)TFBS was inserted alone or in combination with an artificial CGI into the Gata6-TAD. For the cells with the PE insertions, n = 2 independent clonal cell lines (circles and diamonds) were studied in each case. For each cell line, n = 2 replicates of the AntNPC differentiation were performed. Expression values were normalized to two housekeeping genes (Eef1a and Hprt) and are presented as fold-changes with respect to WT ESC. N = 1 independent biological replicate of these experiments is shown in Extended Data Figure 2. In (b-d and f), the expression differences between AntNPCs with the TFBS+CGI module and AntNPCs with the other PE modules were calculated using two-sided non-paired t-tests (*** fold-change >2 & P <0.0001; ** fold-change >2 & P <0.001; * fold-change >2 & P <0.05; ns: not significant; fold-change <2 or P >0.05). The colored area of the violin plot represents the expression values distribution and the center line represents the median. e, TF motif analyses using Homer and Seqpos for PEs with a CAP-CGI within less than 3 kb and that do not overlap with the p300 peaks defining the PEs. Motif analyses were performed separately for the CAP-CGIs and the p300 peaks. g, Immunofluorescence assays for GATA6 and SOX1 in WT ESCs or AntNPCs that were either WT or homozygous for the insertion of the different PE Sox1(+35) modules in the Gata6-TAD. Scale bar = 100 μm.
Fig. 3
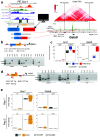
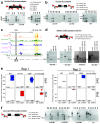
Fig. 3. Characterization of the epigenetic, topological and regulatory features of the PE Sox1(+35) modules engineered within the Gata6-TAD.
a, Bisulfite sequencing analyses in ESCs (Day 0) and AntNPCs (Day 5) differentiated from cell lines with the PE Sox1(+35)TFBS or PE Sox1(+35)TFBS+CGI modules inserted in the Gata6-TAD. DNA methylation levels were measured using a forward bisulfite primer upstream of the insertion site and a reverse primer inside the TFBS module (Methods). b, H3K27ac and p300 levels at the endogenous PE Sox1(+35), the Gata6-TAD insertion site (P1 and P2 primer pairs) and the Gata6 promoter were measured by ChIP-qPCR in ESCs (left) and AntNPCs (right) that were either WT (gray) or homozygous for the insertion of the different PE Sox1(+35) modules. ChIP-qPCR signals were normalized against two negative control regions (Supplementary Data 1). The bars display the mean of n = 3 technical replicates (black dots). c, eRNA levels at the endogenous PE Sox1(+35) and the Gata6-TAD insertion site (P1 and P2 primer pairs) were measured by RT-qPCR in ESCs (left) and AntNPCs (right) that were either WT (gray) or homozygous for the insertions of the different PE Sox1(+35) modules. Expression values were normalized to two housekeeping genes (Eef1a and Hprt) and are presented as fold-changes with respect to WT ESCs. The bars display the mean of n = 3 technical replicates (black dots). d-f, RNAP2 and MED1 (d), H3K27me3 (e) or SUZ12 and RING1B (f) levels were measured by ChIP-qPCR as described in (b). g, 4C-seq experiments were performed using the Gata6 promoter (upper panels) or the Gata6-TAD insertion site (lower panels) as viewpoints in ESCs that were either WT (grey) or homozygous for the insertions of the different PE Sox1(+35) modules. h, 4C-seq experiments were performed using the PE Sox1(+35) as a viewpoint in ESCs that were either WT or homozygous for the deletion of PE Sox1(+35) CGI (PE Sox1 CGI-/-). The genomic location of PE Sox1(+35) and Sox1 are highlighted in grey.
Fig. 4
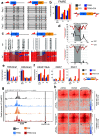
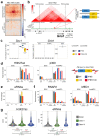
Fig. 4. Genes with CpG-poor promoters do not show long-range responsiveness to PEs.
a, Pile-up plots showing average Hi-C interactions in ESCs between PE-distal and developmental genes with CGI-rich promoters (n = 401 PE-gene pairs) or genes with CGI-poor promoters (n = 900 PE-gene pairs) (Methods). b, Strategy to insert the PE Sox1(+35) components into the Gria1-TAD,. c, Gria1 and Sox1 expression was measured by RT-qPCR in ESCs and AntNPCs with the indicated genotypes as in Fig. 2 (n = 1 independent biological replicate is shown in Extended Data Fig. 8b). Gria1 was also measured in the mouse brain to illustrate the quality of the RT-qPCR primers. Gria1 expression values are presented as arbitrary units (R.U.) since it was not detectable (ND) except in the brain. For Sox1, expression differences between AntNPCs with the TFBS+CGI module or the other PE modules were calculated using two-sided non-paired t-tests (ns: not significant; fold-change <2 or P >0.05). d, H3K27ac and p300 levels at the endogenous PE Sox1(+35), the Gria1-TAD insertion site (P1 and P2) and the Gria1 promoter were measured by ChIP-qPCR in cells with the indicated genotypes. ChIP-qPCR signals were calculated as described in Figure 3. e, eRNA levels at the endogenous PE Sox1(+35) and the Gria1-TAD insertion site (P1 and P2) were measured by RT-qPCR in cells with the indicated genotypes. RT-qPCR signals were calculated as described in Figure 3. f, RNAP2 and MED1 levels were measured by ChIP-qPCR as in (d). g, Violin plots showing H3K27ac and eRNA levels for active enhancers classified into three categories: Class I (active enhancers in TADs containing only poorly expressed genes; n = 271); Class II (active enhancers in TADs with at least one highly expressed gene); n = 2,566; Class III (active enhancers whose closest genes in the same TAD is highly expressed; n = 1,294) (see Methods). P values were calculated using two-sided unpaired Wilcoxon tests with Bonferroni correction for multiple testing; the numbers in black indicate median fold-changes; the colored numbers correspond to negligible (red) and non-negligible (green) Cliff’s delta effect sizes. The violin box graphs were calculated as in Figure 1.
Fig. 5
Fig. 5. Promoters with large CGI clusters are particularly responsive to distal PEs.
a, H3K27me3 and RING1B levels at the endogenous PE Sox1(+35), the Gria1 TAD insertion site (P1 and P2) and the Gria1 promoter were measured by ChIP-qPCR in cells with the indicated genotypes. ChIP-qPCR signals were calculated as in Figure 3. b, 4C-seq experiments were performed using the Gria1-TAD insertion site as a viewpoint in ESCs with the indicated genotypes. c, ESC clonal lines with homozygous insertions of PE Sox1(+35)TFBS or PE Sox1(+35)TFBS+CGI 100 kb upstream of the Gria1-TSS (Fig. 4b), respectively, were used to insert a Gata6-pCGI immediately upstream of the Gria1-TSS. Gria1 and Sox1 expression was measured by RT-qPCR in cells with the indicated genotypes. For the PE Sox1(+35)TFBS cells, a single clone was used, while for the PE Sox1(+35)TFBS+CGI cells, n = 2 independent clonal lines (circles and diamonds) were studied. For each cell line, n = 2 replicates of the AntNPC differentiation were performed. The mouse brain expression values are the same as in Figure 4c. d, RING1B and H3K27ac levels at the Gria1 and Gata6 promoter were measured by ChIP-qPCR in ESCs with the indicated genotypes. ChIP-qPCR signals were calculated as in Figure 2. e, Gria1 and Sox1 expression was measured by RT-qPCR in ESCs and AntNPCs that were WT or homozygous for the indicated PE Sox1(+35) modules inserted 380 bp upstream of the Gria1 TSS (an independent biological replicate is shown in Extended Data Fig. 9e). For cells with the PE module insertions, two different clonal lines (circles and diamonds) were studied in each case. f, Strategy to insert the PE Sox1(+35) components into the Sox7/Rp1l1-TAD. The red triangle indicates the integration site located in between Sox7 and Rp1l1. g, Sox1, Sox7 and Rp1l1 expression was measured by RT-qPCR in cells with the indicated genotypes. For cells with the PE insertions, n = 2 independent clonal lines (circles and diamonds) were studied in each case. In (c, e and g), the expression differences between AntNPCs with TFBS+CGI or TFBS were calculated using two-sided non-paired t-tests (*** fold-change >2 & P <0.0001; ns: not significant; fold-change <2 or P >0.05).
Fig. 6
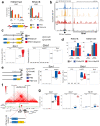
Fig. 6. oCGIs and TAD boundaries enable PEs to specifically induce their target genes.
a, The TADs in which Six3 and Six2 are located (i.e. Six3-TAD and Six2-TAD) are shown according to publically available Hi-C data,. Below the Hi-C data, several epigenomic and genetic features of the Six3-TAD and the Six2-TAD are shown. The dotted rectangles indicate the location of the 36-kb deletion (red) and 110-kb inversion (blue) engineered in ESCs. b, The expression of Six3 (blue) and Six2 (red) was measured by RT-qPCR in ESCs and AntNPCs that were either WT, homozygous for the 36-kb deletion (del36) or homozygous for the 110-kb inversion (inv110). For each of the engineered structural variants, n = 2 clonal cell lines were generated and independently differentiated into AntNPCs. Expression values were calculated as described in Figure 2. c, 4C-seq experiments were performed using the PE Six3(-133) as viewpoint in ESCs with the indicated genotypes. d, The TADs in which Lmx1a, Lrrc52 and Mgst3 are located are shown according to publically available Hi-C data,. Below the Hi-C data, several epigenomic and genetic features of the corresponding TADs are shown. The dotted rectangle indicates the location of the 260-kb inversion (inv260) engineered in ESCs. e, The expression of Lmx1a, Mgst3, Lrrc52 and Aldh9a1 was measured by RT-qPCR in cells with the indicated genotypes. For the inv260, n = 3 clonal cell lines were generated and independently differentiated into AntNPCs. Expression values were calculated as in Figure 2.
Fig. 7
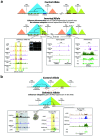
Fig. 7. Proposed model for the role of oCGI as amplifiers of PE regulatory activity and determinants of PE-gene compatibility.
The presence of oCGIs increases the physical communication of PEs with their target genes due to homotypic chromatin interactions between oCGIs and promoter-proximal CGI clusters. Consequently, the oCGIs can increase the number of cells and alleles in which the PEs and their target genes are in close spatial proximity (i.e. permissive regulatory topology) both during pluripotency and upon differentiation. This will ultimately result in a timely and homogenous induction of PE target genes once the PEs become active (i.e. increase transcriptional precision). In addition, the compatibility and responsiveness between PE and their target genes depends on the presence of oCGIs at the PEs and of the pCGI clusters at the target genes. Therefore, the oCGI can increase the specificity of PEs by enabling them to preferentially communicate with their CpG-rich target genes while still being insulated by TAD boundaries. These PE-gene compatibility rules may improve our ability to predict and understand the pathomechanisms of human structural variants.

Similar articles

Cited by

References

    1. Spitz F, Furlong EEM. Transcription factors: From enhancer binding to developmental control. Nat Rev Genet. 2012;13:613–626. - PubMed
    1. Kvon EZ. Using transgenic reporter assays to functionally characterize enhancers in animals. Genomics. 2015;106:185–192. - PubMed
    1. Furlong EEM, Levine M. Developmental enhancers and chromosome topology. Science. 2018;361:1341–1345. - PMC - PubMed
    1. Dixon JR, et al. Topological domains in mammalian genomes identified by analysis of chromatin interactions. Nature. 2012;485:376–380. - PMC - PubMed
    1. Laugsch M, et al. Modeling the Pathological Long-Range Regulatory Effects of Human Structural Variation with Patient-Specific hiPSCs. Cell Stem Cell. 2019;24:736–752.:e12. - PubMed

Publication types