. 2021 Jun 29;118(26):e2011196118.
doi: 10.1073/pnas.2011196118.

Mechanistic basis for receptor-mediated pathological α-synuclein fibril cell-to-cell transmission in Parkinson's disease

Affiliations

Mechanistic basis for receptor-mediated pathological α-synuclein fibril cell-to-cell transmission in Parkinson's disease

Shengnan Zhang et al. Proc Natl Acad Sci U S A. .

Abstract

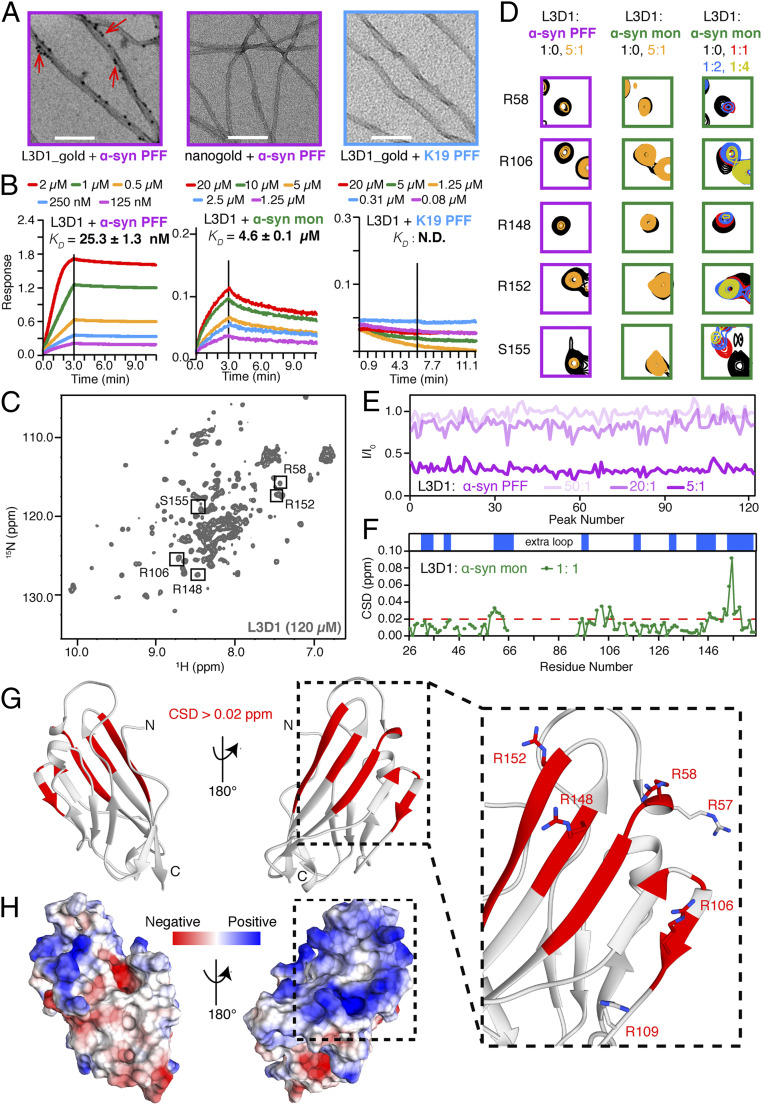
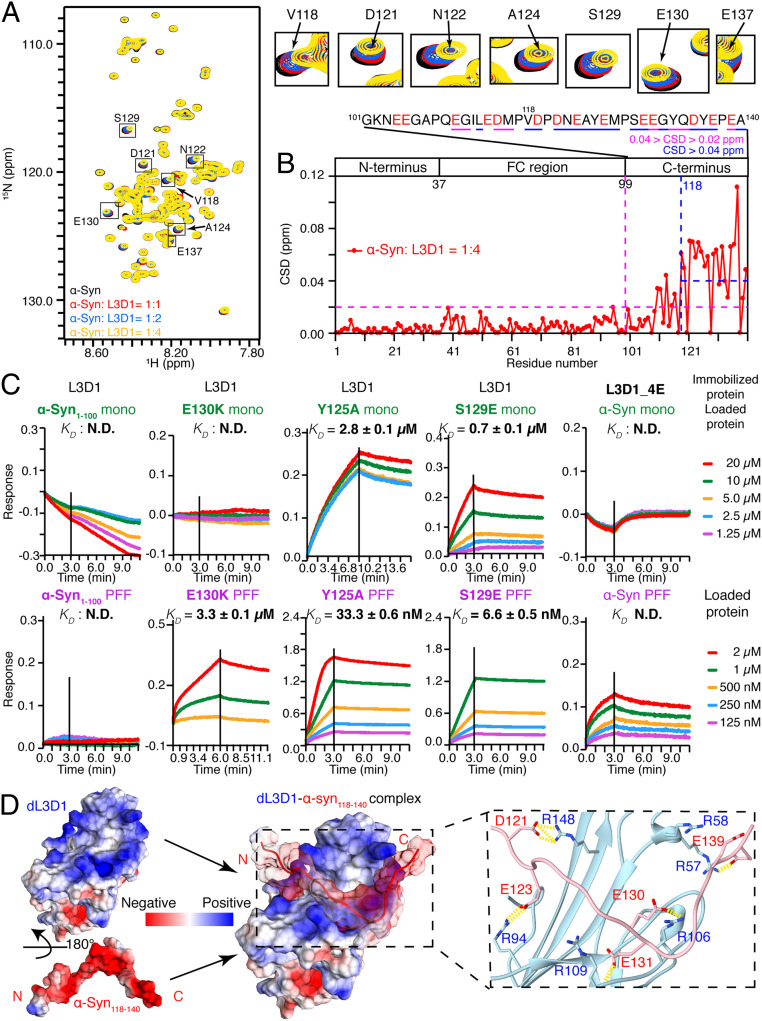
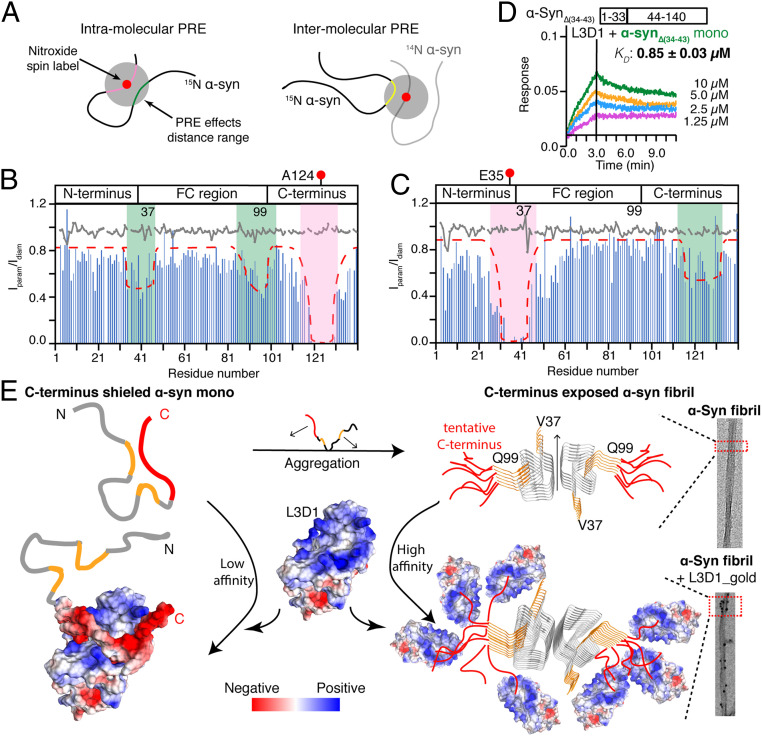
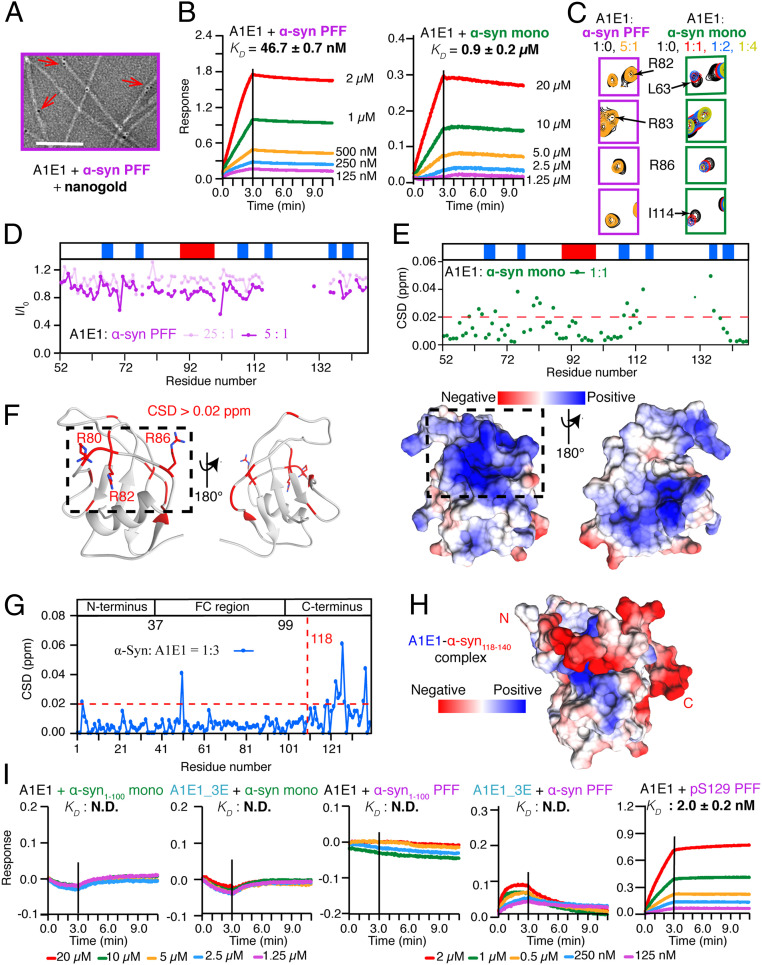
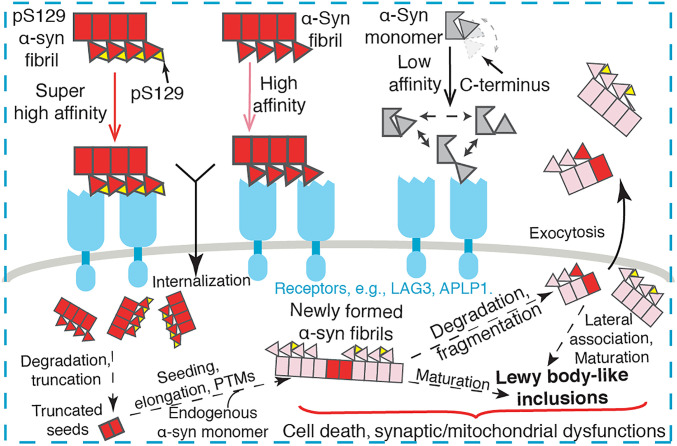
The spread of pathological α-synuclein (α-syn) is a crucial event in the progression of Parkinson's disease (PD). Cell surface receptors such as lymphocyte activation gene 3 (LAG3) and amyloid precursor-like protein 1 (APLP1) can preferentially bind α-syn in the amyloid over monomeric state to initiate cell-to-cell transmission. However, the molecular mechanism underlying this selective binding is unknown. Here, we perform an array of biophysical experiments and reveal that LAG3 D1 and APLP1 E1 domains commonly use an alkaline surface to bind the acidic C terminus, especially residues 118 to 140, of α-syn. The formation of amyloid fibrils not only can disrupt the intramolecular interactions between the C terminus and the amyloid-forming core of α-syn but can also condense the C terminus on fibril surface, which remarkably increase the binding affinity of α-syn to the receptors. Based on this mechanism, we find that phosphorylation at serine 129 (pS129), a hallmark modification of pathological α-syn, can further enhance the interaction between α-syn fibrils and the receptors. This finding is further confirmed by the higher efficiency of pS129 fibrils in cellular internalization, seeding, and inducing PD-like α-syn pathology in transgenic mice. Our work illuminates the mechanistic understanding on the spread of pathological α-syn and provides structural information for therapeutic targeting on the interaction of α-syn fibrils and receptors as a potential treatment for PD.

Keywords: Parkinson’s disease; cell-to-cell transmission; posttranslational modification; α-synuclein.


Conflict of interest statement

The authors declare no competing interest.

Figures

Fig. 1.
Fig. 1.
L3D1 uses a positively charged surface to bind with α-syn. (A) TEM images of PFFs of α-syn and Tau K19 incubated with His-tagged L3D1 and probed by nanogolds. Red arrows indicate the attachment of nanogolds on PFFs. (Scale bar, 200 nm.) (B) Kinetic binding curves of L3D1 with α-syn PFFs (Left), α-syn monomers (Middle), and K19 PFFs (Right) by BLI. The association and dissociation profiles are divided by a vertical black line. N.D., not detectable. (C) The 2D 1H-15N HSQC spectrum of L3D1 in 50 mM sodium phosphate and 50 mM NaCl, pH 7.0. The resonances that are enlarged in D are boxed and labeled. (D) Representative resonances from the HSQC spectra of L3D1 titrated by α-syn PFFs (magenta boxes) and monomers (green boxes). Molar ratios are indicated. (E) Intensity changes of L3D1 resonances titrated by α-syn PFFs at three different molar ratios. (F) Residue-specific CSDs of L3D1 in the presence of α-syn monomers. (Top) The secondary structure of L3D1 with blue boxes representing β-strands. The red dashed line indicates the CSDs of 0.02 ppm. (G) The structural model of dL3D1 is shown in cartoon. The residues with CSDs > 0.02 ppm in F are highlighted in red. (Right) Key interacting residues R57, R58, R106, R109, R148, and R152 are shown in a zoomed-in view. (H) Electrostatic surface of dL3D1. The structure is shown in the same view, and the same region is framed as in G.
Fig. 2.
Fig. 2.
α-Syn uses its C terminus to bind with L3D1. (A) Overlay of the 2D 1H-15N HSQC spectra of 25 μM α-syn alone (black) and in the presence of L3D1 at molar ratios of 1:1 (red), 1:2 (blue), and 1:4 (yellow), respectively. (Right) Representative residues with significant CSDs zoomed in. (B) Calculated CSDs of α-syn in the presence of L3D1 at the molar ratio of 1:4. The domain organization of α-syn is shown. The blue and magenta dashed lines indicate the residues with CSDs > 0.04 and 0.02 ppm, respectively, which are also underscored in the primary sequence shown (Top). The acidic residues in the C terminus are highlighted in red. (C) BLI-binding kinetics of L3D1 with α-syn variants in the forms of monomer (Upper) and PFFs (Lower), respectively. N.D., not detectable. (D) Electrostatic surface of the representative complex structure of dL3D1–α-syn118–140, which is built by HADDOCK. (Right) The complex interface zoomed in.
Fig. 3.
Fig. 3.
Mechanism of the preferential binding of L3D1 with α-syn fibrils over the monomer. (A) Schematic diagram of the NMR PRE for probing the intra- and intermolecular long-range interactions in α-syn monomers. The adjacent residues (pink) and the residues in spatial contacts (light green and yellow) with the nitroxide spin label exhibit the PRE effects. (B and C) PRE profiles of 15N-labeled MTSL-A124C-α-syn (B) and MTSL-E35C-α-syn (C). The paramagnetic effects are highlighted by dashed lines and pink/green shades. The gray lines stand for the result of intermolecular PRE experiments in which 15N-α-syn was incubated with NMR inactive (14N) MTSL-A124C-α-syn (B) or MTSL-E35C-α-syn (C). (D) BLI-binding kinetics of L3D1 with the α-synΔ(34-43) monomer. (E) Schematic illustration of the structural mechanism by which L3D1 preferentially binds with α-syn fibrils over the monomer. The α-syn monomer adopts a self-shielded conformation with transient contacts between the C terminus (red) and both ends of the FC region (orange), which inhibits L3D1 binding. As forming amyloid fibrils, α-syn exposes and condenses the C termini, which significantly enhance the binding with L3D1. The flexible C termini are tentatively drawn on the cryo-EM fibril structure of α-syn (Protein Data Bank identification: 6A6B).
Fig. 4.
Fig. 4.
pS129 α-syn fibril exhibits enhanced binding with LAG3 in SH-SY5Y cells. (A) The TEM image of pS129 α-syn PFFs. (Scale bar, 200 nm.) (B) BLI binding kinetics of L3D1 with pS129 α-syn PFFs (Left) and monomers (Right). (C) The structure model of pS129 α-syn118–140-dL3D1 complex built by HADDOCK. pS129 is in contact with the positively charged surface of dL3D1. (Right) The binding surface zoomed in. (D) High-magnification images of the biotinylated pS129, WT, and α-syn1–100 PFFs binding to LAG3-expressing SH-SY5Y cells. (E) The statistical analysis is shown. Data are the means ± SEM, n = 3 independent experiments. One-way ANOVA followed by Tukey's correction, ***P < 0.001, ****P < 0.0001.
Fig. 5.
Fig. 5.
Mechanism of A1E1 binding with α-syn. (A) The TEM image of α-syn fibrils incubated with His-tagged A1E1 and nanogolds. The red arrows highlight the attachment of nanogolds on α-syn fibrils via A1E1. (Scale bar, 100 nm.) (B) BLI binding kinetics of A1E1 with α-syn PFFs (Left) and the α-syn monomer (Right). (C) Representing resonances from the 2D HSQC spectra of A1E1 upon the titration of α-syn PFFs (Left) and the α-syn monomer (Right). (D) Residue-specific intensity changes (I/I0) of A1E1 in the presence of α-syn PFFs at the indicated concentrations. The secondary structure of A1E1 is shown with a blue bar representing the β strand and a red bar for the α-helix. (E) Residue-specific CSDs of A1E1 in the presence of α-syn monomer. The red dashed line highlights the residues with CSD > 0.02 ppm. (F) Residues with CSD > 0.02 ppm (red) upon the α-syn monomer titration are mapped on the modeled structure of A1E1 (Left). The side chains of key interacting residues of A1E1 including R80, R82, and R86 are shown. Electrostatic surface of A1E1 (Right) shows that the interacting surface of A1E1 exhibits a positively charged patch. The dashed boxes highlight the residues of A1E1 with CSDs > 0.02 ppm. (G) Calculated CSDs of α-syn in the presence of A1E1 at a molar ratio of 1:3. The red dashed line highlights the residues with CSD > 0.02 ppm. (H) Electrostatic surface representation of the structure model of A1E1-α-syn118–140 complex, which is built by HADDOCK. The acidic C terminus of α-syn binds to the positively charged patch of A1E1. (I) BLI binding kinetics of A1E1 or A1E1_3E with different variants of α-syn monomer and PFFs. N.D., not detectable.
Fig. 6.
Fig. 6.
S129 phosphorylation and C terminus are crucial for internalization, propagation, and neurotoxicity of α-syn PFFs in primary cultured cortical neurons. (A) Low (Top) and high (Bottom) magnification views of images of pS129, WT, and α-syn1–100 PFFs binding to neurons (14 d in vitro). The binding signal is assessed by means of an alkaline phosphatase assay. (B) Quantification of A by Scatchard analysis. Data are the means ± SEM, n = 3 independent experiments. One-way ANOVA followed by Tukey's correction, ***P < 0.001, ****P < 0.0001. (C) Quantification of the immunoblots analysis of the enriched endosomal/lysosomal fraction confirms that biotin-labeled pS129 α-syn PFFs enter mouse primary cortical neurons more efficiently than that of the WT and α-syn1–100 PFFs. Data are the means ± SEM, n = 3. Student’s t test. (D) Quantification of immunoblots in WT neuron lysates for insoluble (Left) and soluble (Right) α-syn. pS129 α-syn PFFs can induce more insoluble α-syn aggregates than that of the WT and α-syn1–100 PFFs. The results are shown as means ± SEM. One-way ANOVA followed by Tukey's correction. No significant difference is shown in soluble fraction. (E) Quantification of α-syn pathology induced by WT and α-syn1–100 PFFs to mouse primary cortical neurons, which was assessed with anti-pS129 immunostaining 10 d after α-syn PFF treatment. WT α-syn PFFs can induce substantial immunoreactivity of anti-pS129, whereas C terminus truncation (α-syn1–100 PFFs) reduces the pS129 pathology significantly. (F) Quantification of the toxicity of WT, pS129, and α-syn1–100 PFFs to mouse primary cortical neurons. pS129 α-syn PFFs exhibit more toxicity than that of WT PFFs, and α-syn1–100 PFFs exhibit much less neurotoxicity than WT PFFs. Data in (E and F) are the means ± SEM, n = 3, one-way ANOVA followed by Tukey's correction, *P < 0.05, **P < 0.01, ***P < 0.001.
Fig. 7.
Fig. 7.
S129 phosphorylation in α-syn PFF-induced neurodegeneration in vivo. (A) Representative TH (tyrosine hydroxylase) immunohistochemistry and Nissl staining images of dopamine neurons in the SNpc of WT, α-syn1–100, and pS129 PFF-injected hemisphere in the hA53T mice. (B and C) Stereological counting of the number of TH- and Nissl-positive neurons in the SNpc via unbiased stereological analysis after 2 to 3 mo of α-syn PFF injection in the hA53T mice (PBS: n = 7; WT α-syn PFFs: n = 5; pS129 α-syn PFFs: n = 7, α-syn1–100 PFFs: n = 5). Data are the means ± SEM, one-way ANOVA with Tukey’s correction; *P < 0.05, **P < 0.01, ***P < 0.001, ****P < 0.0001, n.s., not significant. (D–F) Immunoblots of the hindbrain lysates of hA53T mice 3 mo after intrastriatal injection of WT PFFs, pS129 α-syn PFFs, and PBS. pS129 α-syn PFF injection exhibits significantly increased signals of insoluble α-syn and oxidative α-syn in the hindbrain compared to that of WT PFFs. Data are the means ± SEM, n = 3 individual experiments, one-way ANOVA with Tukey’s correction. *P < 0.05, **P < 0.01, n.s., not significant. (G–I) Behavioral abnormalities of PBS-, WT PFFs-, α-syn1–100 PFFs-, and pS129 α-syn PFFs injected hA53T mice at 2 mo measured by the pole test (G, n = 8 mice per group), the grip strength test (H, n = 7 mice per group), and the open field (I, n = 9 to 12 mice). Data are the means ± SEM, one-way ANOVA with Tukey's correction. *P < 0.05, **P < 0.01, ***P < 0.001, ****P < 0.0001, n.s., not significant.
Fig. 8.
Fig. 8.
Schematic diagram of α-syn pathological transmission. Over the progression of PD and α-synucleinopathies, α-syn aggregation spreads from cell to cell in the brain. α-Syn monomer, fibril, and pS129 fibril exhibit distinct binding affinities to the receptors (e.g., LAG3 and APLP1) depending on the structural arrangement and chemical property of the C terminus of α-syn; thus, they show different efficiency in the spread of α-syn pathology. The internalized α-syn fibrils may undergo degradation and truncation of the C terminus while maintaining the high ability of seeding the formation of new fibrils in the transfected neurons.

Similar articles

Cited by

References

    1. Riek R., Eisenberg D. S., The activities of amyloids from a structural perspective. Nature 539, 227–235 (2016). - PubMed
    1. Dobson C. M., Knowles T. P. J., Vendruscolo M., The amyloid phenomenon and its significance in biology and medicine. Cold Spring Harb. Perspect. Biol. 12, a033878 (2019). - PMC - PubMed
    1. Kim S., et al. ., Transneuronal propagation of pathologic alpha-synuclein from the gut to the brain models Parkinson’s disease. Neuron 103, 627–641.e7 (2019). - PMC - PubMed
    1. Kordower J. H., Chu Y., Hauser R. A., Freeman T. B., Olanow C. W., Lewy body-like pathology in long-term embryonic nigral transplants in Parkinson’s disease. Nat. Med. 14, 504–506 (2008). - PubMed
    1. Braak H., Sandmann-Keil D., Gai W., Braak E., Extensive axonal Lewy neurites in Parkinson’s disease: A novel pathological feature revealed by alpha-synuclein immunocytochemistry. Neurosci. Lett. 265, 67–69 (1999). - PubMed

Publication types

MeSH terms