. 2021 Nov:53:101272.
doi: 10.1016/j.molmet.2021.101272. Epub 2021 Jun 16.

Ovarian cancer modulates the immunosuppressive function of CD11b+Gr1+ myeloid cells via glutamine metabolism

Affiliations

Ovarian cancer modulates the immunosuppressive function of CD11b+Gr1+ myeloid cells via glutamine metabolism

Mary P Udumula et al. Mol Metab. 2021 Nov.

Abstract

Objective: Immature CD11b + Gr1+ myeloid cells that acquire immunosuppressive capability, also known as myeloid-derived suppressor cells (MDSCs), are a heterogeneous population of cells that regulate immune responses. Our study's objective was to elucidate the role of ovarian cancer microenvironment in regulating the immunosuppressive function of CD11b+Gr1+ myeloid cells.

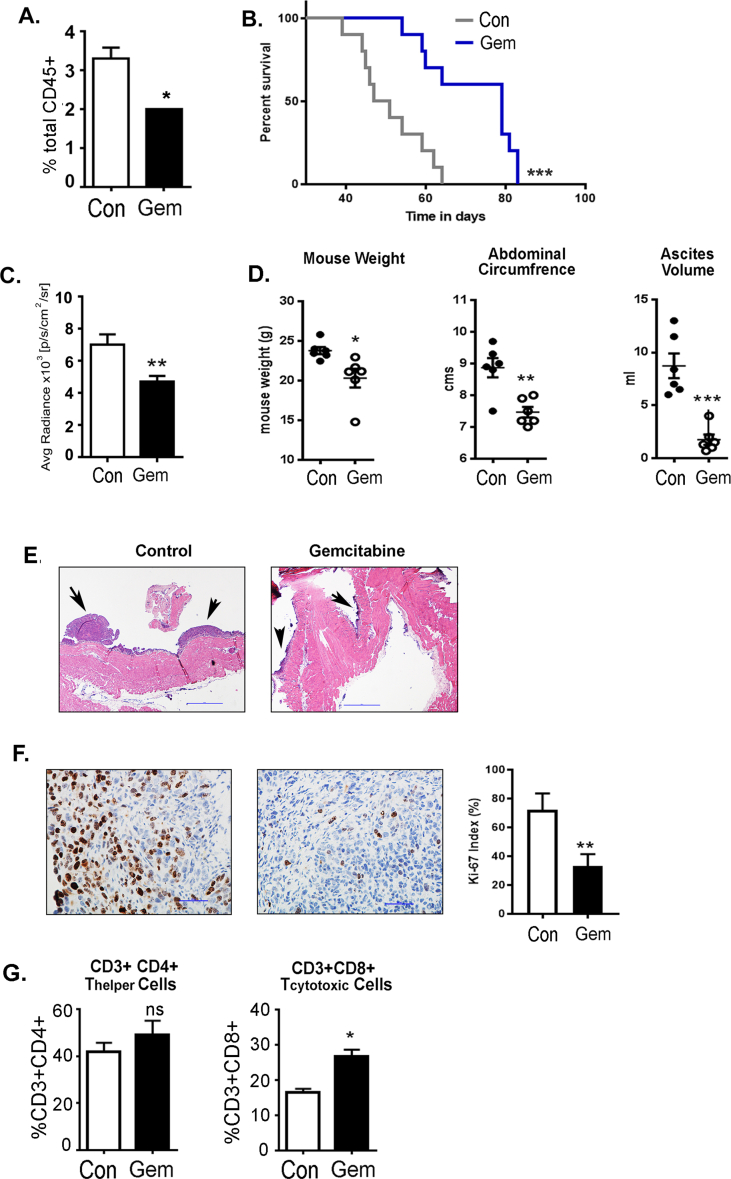
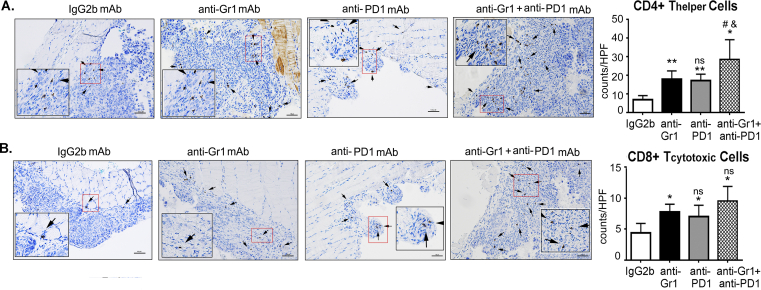
Methods: All studies were performed using the intraperitoneal ID8 syngeneic epithelial ovarian cancer mouse model. Myeloid cell depletion and immunotherapy were carried out using anti-Gr1 mAb, gemcitabine treatments, and/or anti-PD1 mAb. The treatment effect was assessed by a survival curve, in situ luciferase-guided imaging, and histopathologic evaluation. Adoptive transfer assays were carried out between congenic CD45.2 and CD45.1 mice. Immune surface and intracellular markers were assessed by flow cytometry. ELISA, western blot, and RT-PCR techniques were employed to assess the protein and RNA expression of various markers. Bone marrow-derived myeloid cells were used for ex-vivo studies.

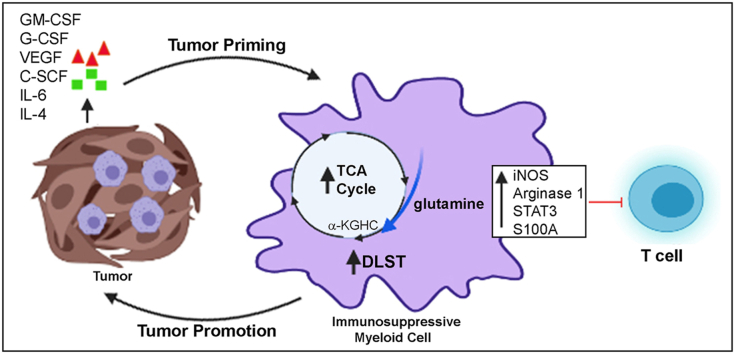
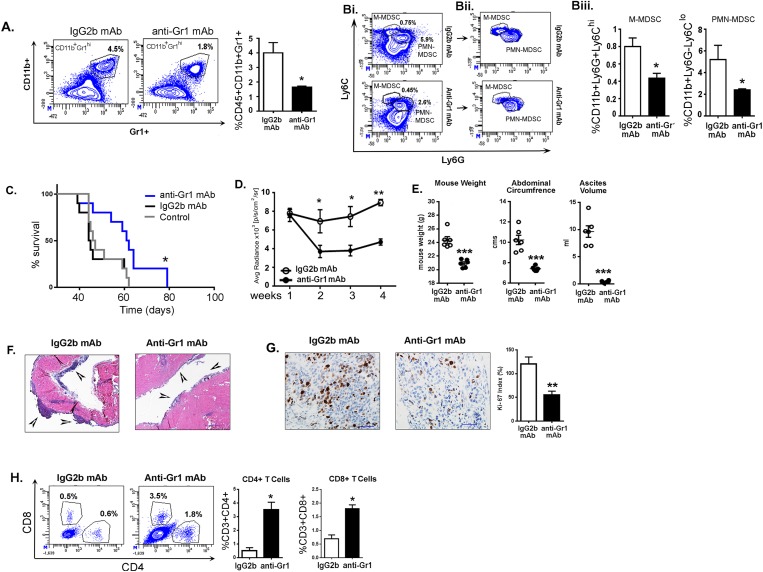
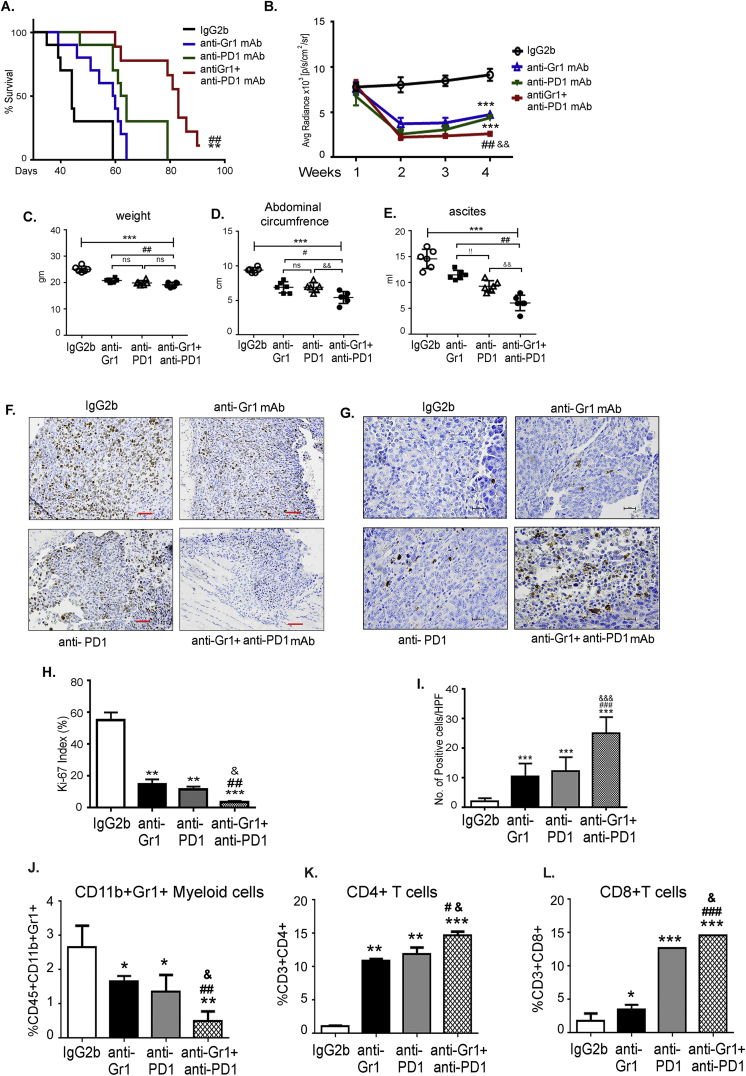
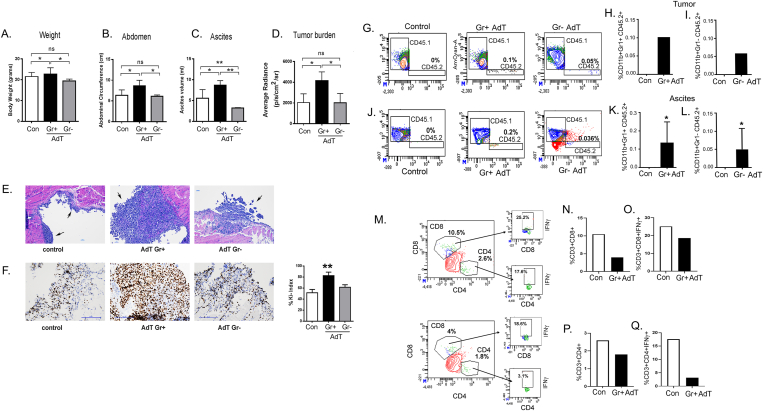
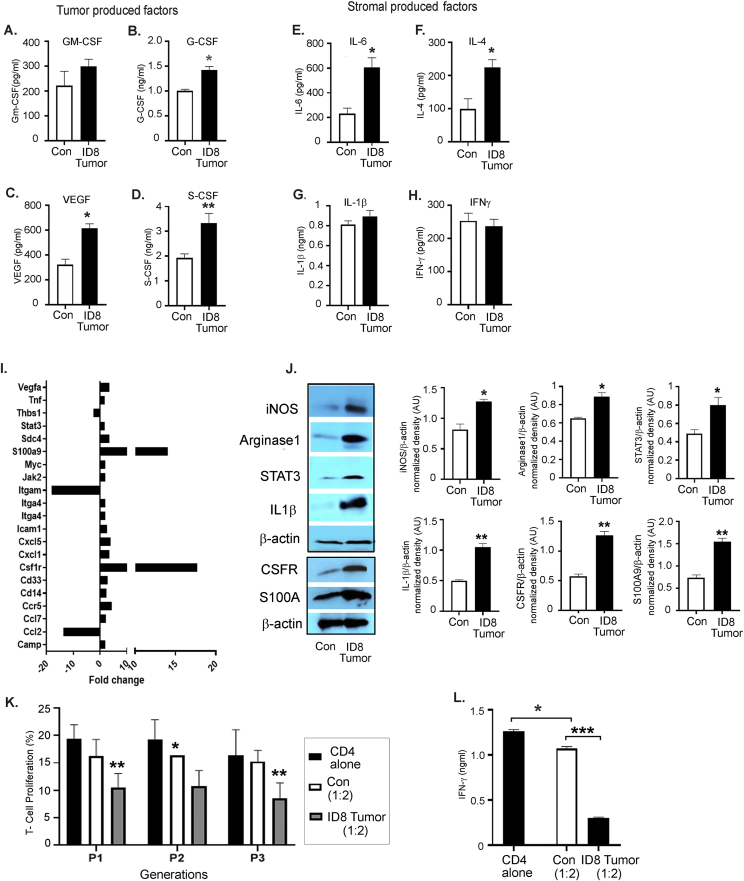
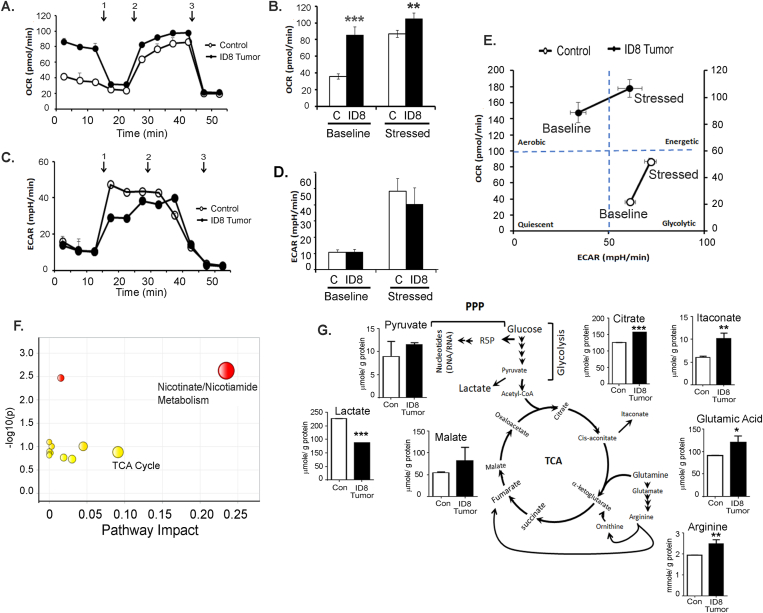
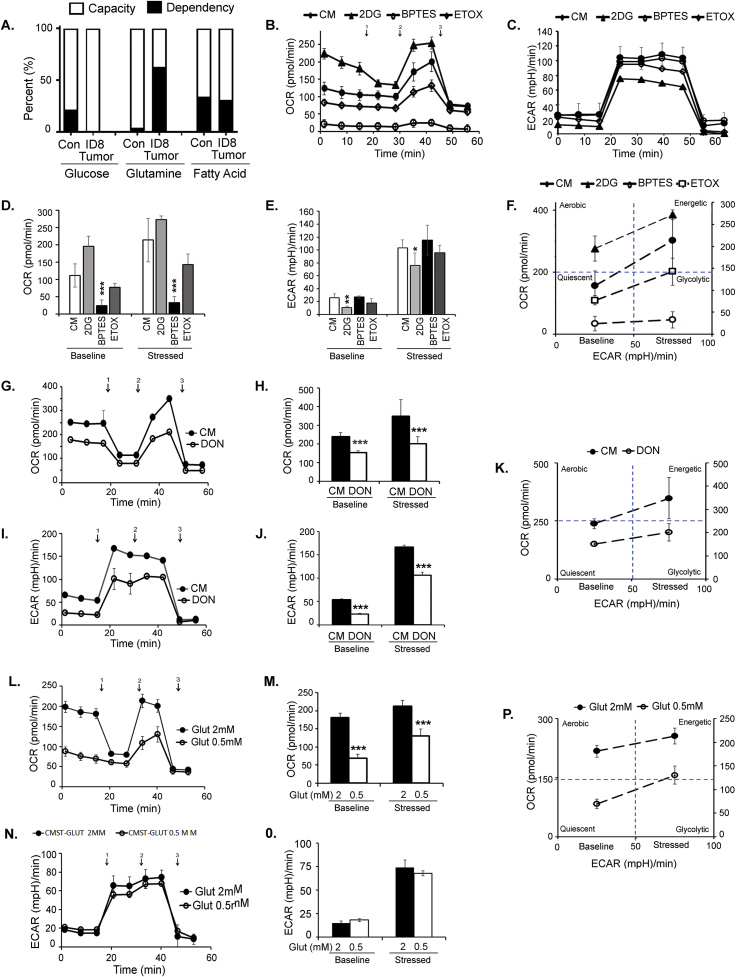
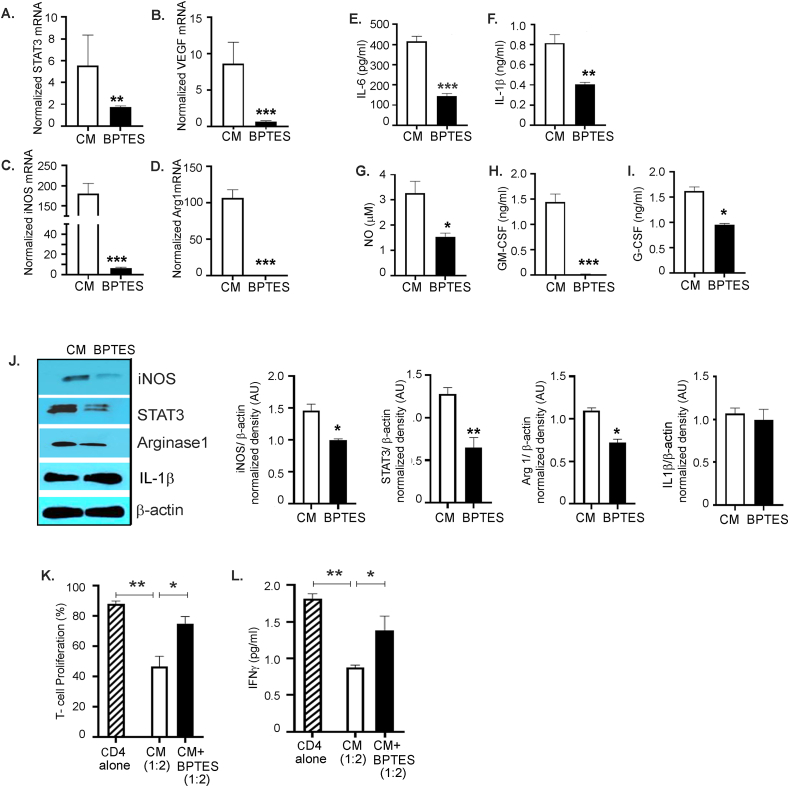
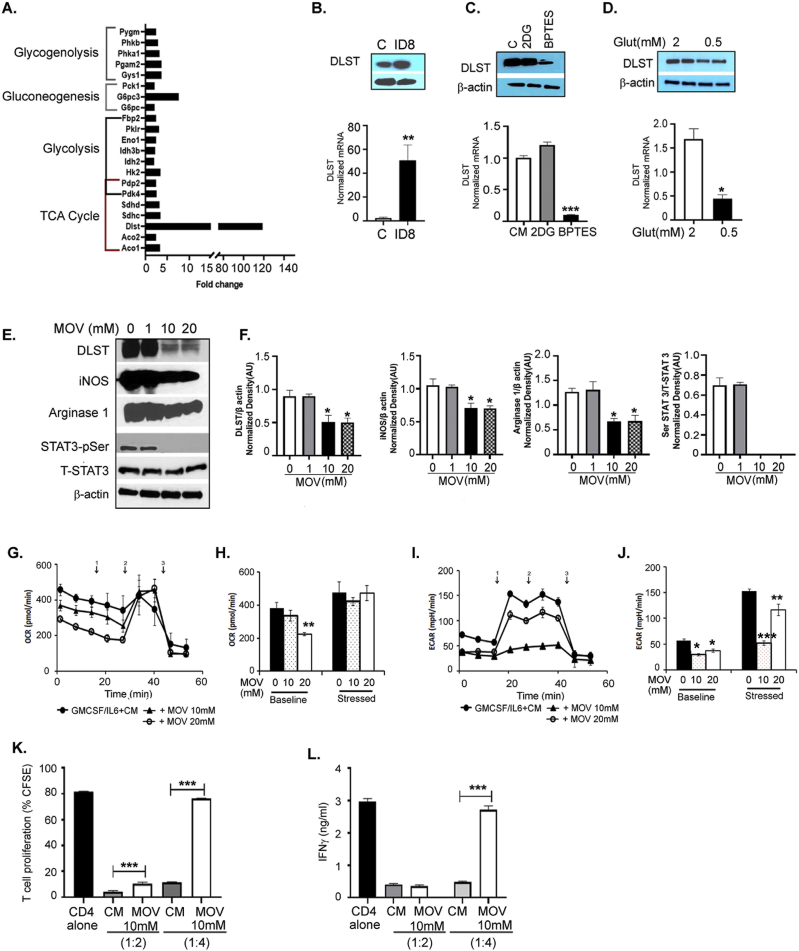
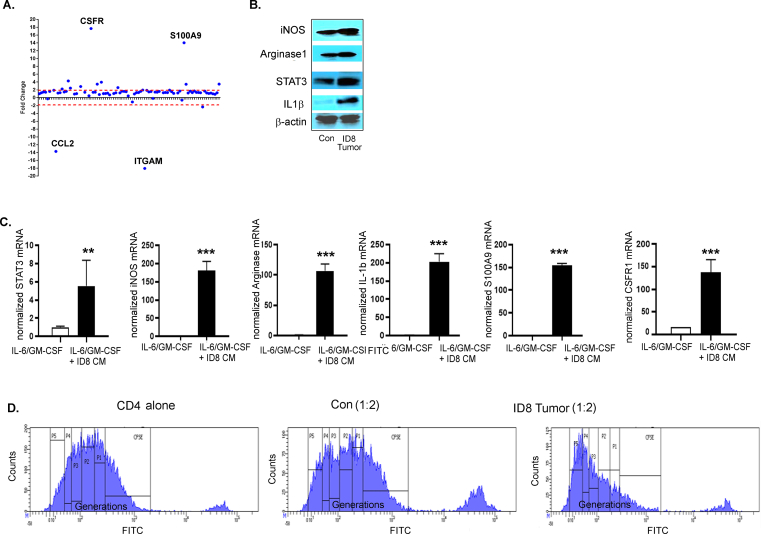
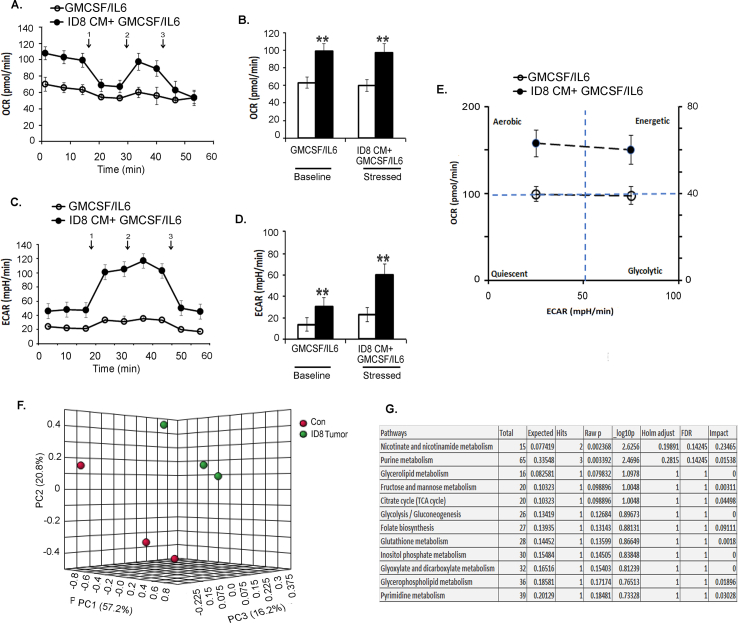
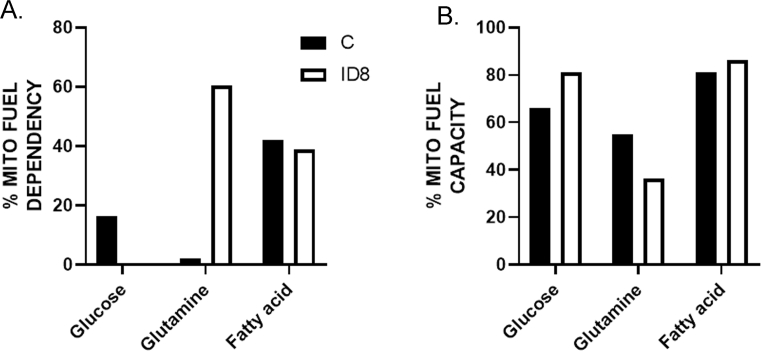
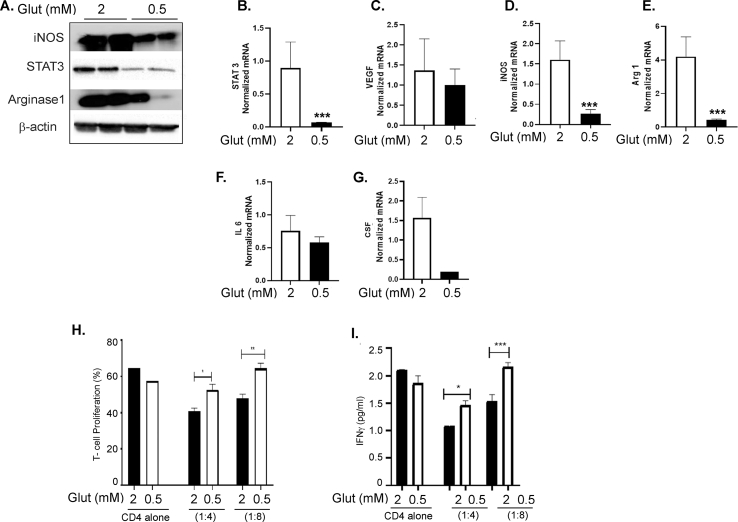
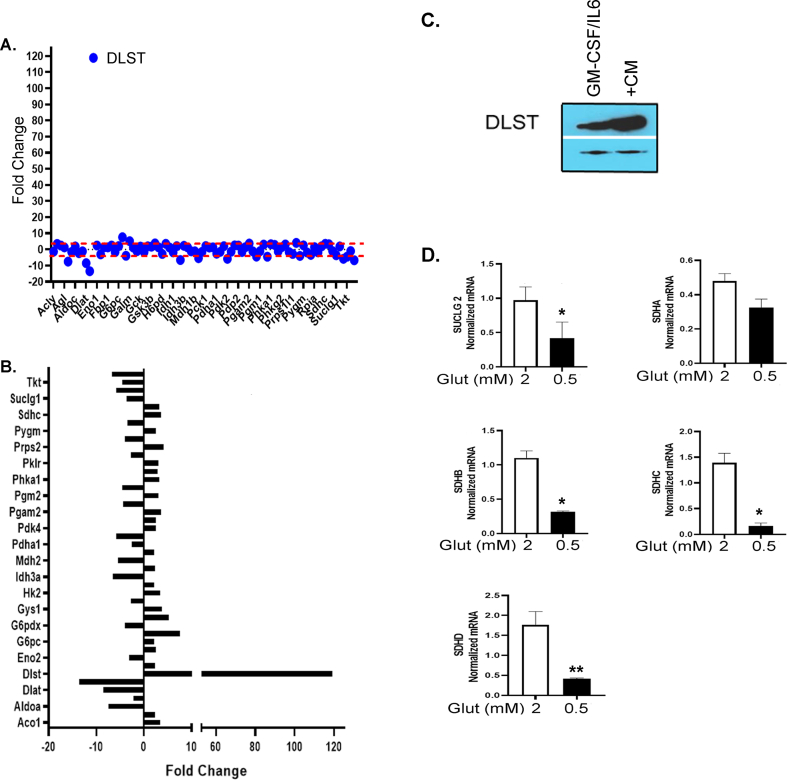
Results: The depletion of Gr1+ immunosuppressive myeloid cells alone and in combination with anti-PD1 immunotherapy inhibited ovarian cancer growth. In addition to the adoptive transfer studies, these findings validate the role of immunosuppressive CD11b+Gr1+ myeloid cells in promoting ovarian cancer. Mechanistic investigations showed that ID8 tumor cells and their microenvironments produced recruitment and regulatory factors for immunosuppressive CD11b+Gr1+ myeloid cells. CD11b+Gr1+ myeloid cells primed by ID8 tumors showed increased immunosuppressive marker expression and acquired an energetic metabolic phenotype promoted primarily by increased oxidative phosphorylation fueled by glutamine. Inhibiting the glutamine metabolic pathway reduced the increased oxidative phosphorylation and decreased immunosuppressive markers' expression and function. Dihydrolipoamide succinyl transferase (DLST), a subunit of α-KGDC in the TCA cycle, was found to be the most significantly elevated gene in tumor-primed myeloid cells. The inhibition of DLST reduced oxidative phosphorylation, immunosuppressive marker expression and function in myeloid cells.

Conclusion: Our study shows that the ovarian cancer microenvironment can regulate the metabolism and function of immunosuppressive CD11b + Gr1+ myeloid cells and modulate its immune microenvironment. Targeting glutamine metabolism via DLST in immunosuppressive myeloid cells decreased their activity, leading to a reduction in the immunosuppressive tumor microenvironment. Thus, targeting glutamine metabolism has the potential to enhance the success of immunotherapy in ovarian cancer.

Keywords: CD11b(+)Gr1(+) immunosuppressive cells; DLST; Glutamine metabolism; MDSCs; Ovarian cancer; α-KGDC.


Figures

Image 1
Graphical abstract
Figure 1
Figure 1
Depletion of CD11b+Gr1+myeloid cells by anti-Gr1 monoclonal antibody inhibits EOC progression. ID8-luc2 cells were injected intraperitoneally into C57Bl/6 mice. After 10 days of tumor initiation, mice were treated with IgG2b or anti-Gr1 mAb as described in methods. (A) Representative flow cytometry plots and graph from n = 3, of total CD11b+Gr1+ myeloid cells in the peripheral blood of mice treated with IgG2b mAb (left) or anti-Gr1 mAb (right). Numbers represent the frequency of cells in the indicated gate. (Bi) Flow cytometry plots (n = 3) representing LY6C and LY6G population from CD45+CD11b+ cells in mice treated with IgG2b mAb or anti-Gr1 mAb. (Bii) Flow cytometry plots showing only the populations of interest after removing all negative populations for clarity of the gates. (Biii) Bar graphs represent the average percentage of cells in each population. (C) Kaplan–Meier graphs indicating overall survival (n = 12) in ID8-luc2 mice untreated (control) or treated with IgG2b mAb or anti-Gr1 mAb; p = 0.0385 by Gehan-Breslow-Wilcox test and p = 0.0177 by Mantel–Cox test. (D) Average radiance (n = 6) of bioluminescence signal of tumor progression of mice treated with IgG2b mAb or anti-GR1 mAb. The weeks represent post-tumor inoculation time points. (E) Dot plots (n = 6) of mouse weight, abdominal circumference, and ascites volume of ID8-luc2 mice treated with IgG2b mAb or anti-Gr1 mAb. (F) Representative H & E images of tumor tissue in ID8-luc2 mice treated with IgG2b mAb or anti-Gr1 mAb at 4x. (G) Representative images of Ki67 staining at 40× magnification. Tumor sections from all 6 mice/group were examined—representative bar graph for Ki-67 proliferation index. (H) Representative flow plots and bar graphs for CD4+ and CD8+ T cell population in ID8-luc2 mice treated with IgG2b mAb or anti-Gr1 mAb. All analyses were carried out in mice after 5–6 weeks of tumor inoculation. p < 0.05, ∗∗p < 0.01, ∗∗∗p < 0.001 anti-Gr1 mAb-treated mice compared to control IgG2b-treated mice as assessed by unpaired T-test.
Figure 2
Figure 2
Depletion of CD11b+Gr1+myeloid cells enhances PD1 immunotherapy. ID8-luc2 cells were injected intraperitoneally into C57Bl/6 mice. After 10 days of tumor initiation, mice were treated with IgG2b or anti-Gr1 mAb or anti-PD1 mAb or a combination of both as described in methods. (A) Kaplan–Meier graphs indicating overall survival (n = 12) under various treatments; p = 0.0094 by Gehan-Breslow-Wilcox test and p = 0.0042 by Mantel–Cox test on comparing PD1 alone to combination treatment; p = 0.0011 by Gehan-Breslow-Wilcox test and p = 0.0004 by Mantel–Cox test on comparing Gr1 alone to combination treatment. (B) Average radiance (n = 6) of bioluminescence signal of tumor progression of mice treated with various treatments. Weeks indicate post-tumor injection time points. Dot plots (n = 6) of mouse weight (C), abdominal circumference (D), and ascites volume (E) of ID8-luc2 mice treated with indicated treatments. (F) Representative images of Ki67 staining for assessing tumor cell proliferation. Images are shown at 4× magnification. Tumor sections from all 8 mice/group were examined. Ki-67 proliferation index is plotted as a bar graph (H). (G) Representative images of cleaved caspase 3 staining for assessing tumor cell apoptosis. Images are shown at 20× magnification. Tumor sections from 3 to 4 mice/group were examined. Positive cells were counted from a minimum of 6 fields at HPF from each slide and quantified (I). (J) Bar graph representing the percent of CD11b+Gr1+ myeloid cells in the ascites of mice under various treatments (n = 3). Bar graphs for CD4+ (K) and CD8+ (L) T cell population in ID8-luc2 mice with various treatments. p < 0.05, ∗∗p < 0.01, ∗∗∗p < 0.001 compared to IgG2b; #p < 0.05, ##p < 0.01, ###p < 0.001 compared to anti-Gr1 and &p < 0.05, &&&p < 0.001compared to anti-PD1 as assessed by unpaired T-test.
Figure 3
Figure 3
Adoptive transfer of tumor primed CD11b+Gr1+myeloid cells promotes progression of EOC. CD11b+Gr1+ or CD11b+Gr1- myeloid cells were adoptively transferred (AdT) from ID8-luc2 tumor primed CD45.2 congenic mice into sets of ID8-luc2 tumor-bearing congenic CD45.1 mouse by IV. A control set of mice received sham injections. Bar graphs showing (A) body weight, (B) Abdominal circumference, (C) Ascites volume, and (D) tumor burden measured by the average radiance of bioluminescence signal (n = 6). (E) Representative H &E staining (10x) of tumor tissue from control, CD11b+Gr1+ or CD11b+Gr1- AdT mice 4 week post AdT. (F) Representative Ki67 expression in tumor sections from mice 4 weeks post-AdT and the calculated Ki-67 index. A total of 8 HPF were studied from 3 to 4 tumor sections/group. Representative flow cytometry plots of CD45.2+CD11b+Gr1+ cells in tumors (G, H) and ascites (J, K) from CD45.1 mice with and without tumor. Tumor bar graphs represent the pooled tumor tissue of 3 mice. Ascites bar graph are from n = 3. Representative flow cytometry plots of CD45.2+CD11b+Gr1- cells in tumors (G, I) and ascites (J, L) from CD45.1 mice with and without tumor. Tumor bar graphs represent the pooled tumor tissue of 3 mice. Ascites bar graph are from n = 3. Representative flow plots of CD8+ (M, N)and CD4+ T (M, P) cells infiltrated in tumor and the intracellular IFNγ positive cells from respective CD8 (M, O) and CD4 (M, Q) populations of tumor infiltrates. Tumor bar graphs represent the pooled tumor tissue of 3 mice. p < 0.05, ∗∗p < 0.01 compared to control as assessed by unpaired T-test.
Figure 4
Figure 4
EOC environment enhances the immunosuppressive phenotype of CD11b+Gr1+myeloid cells. Levels of GM-CSF (A), G-CSF (B), VEGF (C), C-SCF (D), IL-6 (E), IL-4 (F), IL- 1β (G), and IFN-γ (H) in the peritoneal wash or ascites from non-tumor (control, con) and ID8-luc2 tumor-bearing mice (ID8 tumor) were measured by ELISA (n = 3) after 6 weeks of tumor growth. (I) Total RNA was isolated from BM-derived CD11b+Gr1+ myeloid cell control and ID8 tumor, and a mouse myeloid-derived suppressor PCR array was performed. Bar graph represents the fold-change of gene expression in tumor primed vs. naïve myeloid cells. (J) Protein expression of iNOS, arginase 1, STAT 3, IL-1β, CSFR, and S100A9 in CD11b+Gr1+ myeloid cells isolated from control and ID8 tumor-bearing mice. Bar graphs represent the normalized density from 3 individual blots. (K) T cell suppression assay performed by co-culturing CD11b+Gr1+ myeloid cells from non-tumor and ID8 tumor-bearing mice with CFSE labeled CD4 cells isolated from naïve mice at 1:2 ratio (n = 3). T cell proliferation was assayed by flow cytometry on day 5 by measuring the CFSE intensity individually in each generation. Data from generation P1–P3 is shown. (L) From the same cells, day 3 supernatant was collected, and IFNγ levels were measured by ELISA. p < 0.05, ∗∗p < 0.01, ∗∗∗p < 0.01 tumor compared to control as assessed by unpaired T-test. The expanded forms of abbreviations are detailed in the Supplementary Table S4.
Figure 5
Figure 5
EOC microenvironment induces an energetic metabolic state in CD11b+Gr1+myeloid cells. CD11b+Gr1+ were isolated from BMs of control (no tumor injection) and mice with ID8-luc2 tumor at 2 weeks and subjected to Seahorse analysis and energy targeted metabolomics. (A) Oxygen consumption rate (OCR) was assessed in real-time using an XFe Seahorse analyzer as described in methods. Port injections of (1) oligomycin, (2) FCCP, and a combination of (3) rotenone-antimycin were given. (B) The bar graph represents basal and stressed OCR (n = 3). (C) Extracellular acidification rate (ECAR) was measured with port injections of (1) glucose, (2) oligomycin, and (3) 2-DG. (D) The bar graph represents basal and stressed ECAR (n = 3). (E) A quadrant plot indicates the metabolic shift of energy phenotype at basal and stressed levels. (F) MetaboAnalyst analysis showing the most significant and impacted pathways in the CD11b+Gr1+ isolated from ID8 tumor mice compared to non-tumor mice. (G) Bar graphs showing the metabolite levels that changed significantly, as quantified by metabolomics in CD11b+Gr1+ cells isolated from control and tumor mice. p < 0.05, ∗∗p < 0.01, ∗∗∗p < 0.01 tumor compared to control as assessed by unpaired T-test.
Figure 6
Figure 6
The glutamine energy pathway fuels enhanced metabolic state and immunosuppressive function of CD11b+Gr1+myeloid cells. CD11b+Gr1+ were isolated from BMs of control (no tumor), and mice injected with ID8-luc2 tumor at 2 weeks were subjected to (A) Mito Fuel Flex assay to assess dependency and capacity after blocking the different energy pathways using specific inhibitors UK5009 (glucose inhibitor), BPTES (glutamine inhibitor) and etomoxir (fatty acid oxidation inhibitor). (B) OCR was assessed in real-time using XFe Seahorse analyzer as described in methods, in CD11b+Gr1+ myeloid cells differentiated from BM by exposure of GM-CSF/IL-6 and ID8 conditioned media (CM) in the absence or presence of metabolic inhibitors of 2-DG (glycolysis inhibitor), BPTES (glutaminase inhibitor) and etomoxir (fatty acid oxidation inhibitor). Port injections were given as described before. (D) The bar graph represents basal and stressed OCR (n = 3). (C) Measurement of ECAR profile as described before. (E) The bar graph represents basal and stressed ECAR (n = 3). (F) Energy phenotype shifts under the presence of various metabolic inhibitors. BM-derived CD11b+Gr1+ myeloid cells were treated with glutaminase inhibitor DON, and OCR (G, H) and ECAR (I, J) were assessed similarly (n = 3). (K) Energy phenotype shifts under the presence of glutaminase inhibitor DON. (L–P) Similar metabolic analysis under regular glutamine (2 mm) and low glutamine (0.5 mm). p < 0.05, ∗∗p < 0.01, and ∗∗∗p < 0.001, treatments compared to CM as assessed by unpaired T-test.
Figure 7
Figure 7
Targeting glutamine metabolism inhibits the suppressive function of CD11b+Gr1+myeloid cells. CD11b+Gr1+ myeloid cells isolated from the BM and exposed to ID8 conditioned media (CM) were treated with BPTES (10 μmol/L) for 48 h. (A–D) RT-PCR mRNA expression of STAT-3, VEGF, iNOS, and arginase (n = 3). (E–I) Cell culture supernatants from the same cells were collected, and levels of IL-6, IL-1β, GM-CSF, and G-CSF were measured by ELISA. NO levels were (G) measured by Griess reagent (n = 3). (J) Protein expression of iNOS, STAT 3, arginase 1, and IL-1β was measured by immunoblotting. Bar graphs represent the normalized density from 3 independent blots. (K) The immunosuppressive function of myeloid cells was tested by their ability to suppress T-cell proliferation as before and (L) IFNγ production in the absence or presence of BPTES (n = 3). p < 0.05, ∗∗p < 0.01, and ∗∗∗p < 0.001, BPTES treatment compared to CM as assessed by unpaired T-test.
Figure 8
Figure 8
Increased metabolic activity and function of myeloid cells are dependent on the increased expression of DLST. CD11b + Gr1+ myeloid cells were isolated from BMs of control (no tumor), and mice injected with ID8-luc2 tumors at 2 weeks were subjected to (A) Glucose metabolism PCR array. The bar graph shows 2-fold and higher upregulated genes in the CD11b+Gr1+ cells from tumor-bearing mice (B) immunoblotting and RT-PCR in CD11b+Gr1+ myeloid cells from control and ID8 mice. (C) Differentiated BM-derived CD11b+Gr1+ myeloid cells exposed to ID8 CM were treated with 2DG or BPTES, and DLST expression was examined by immunoblotting and RT-PCR. (D) Differentiated BM-derived CD11b+Gr1+ myeloid cells exposed to ID8 CM were subjected to low or normal glutamine levels, and DLST expression was examined by immunoblotting and RT-PCR. (E) Differentiated BM-derived CD11b+Gr1+ myeloid cells exposed to ID8 CM were treated with DLST inhibitor, MOV at 1-, 10-, and 20 mM concentrations for 48 h, and immunoblotting was performed to measure DLST, iNOS, arginase 1, pSTAT3, and total STAT-3 expression. (F) Bar graphs represent the normalized density of the western blots from 3 individual blots. (G, H) OCR profile of differentiated BM-derived CD11b+Gr1+ myeloid cells exposed to ID8 CM in the presence or absence of MOV. (I, J) ECAR profile of differentiated BM-derived CD11b+Gr1+ myeloid cells exposed to ID8 CM in the presence or absence of MOV. (K) CD11b+Gr1+ myeloid cells treated with DLST inhibitor were co-cultured with CD4+ T cells in 1:2 and 1:4 ratio to analyze T-cell proliferation (L) IFNγ levels by ELISA in the supernatant on day 3. ∗∗p < 0.01, ∗∗∗p < 0.001, ∗∗∗∗p < 0.0001 treatments compared to control of CM as assessed by unpaired T-test.
Supplementary figure 1
Depletion of CD11b+Gr1+myeloid cells by gemcitabine inhibits EOC progression. ID8-luc2 cells were injected intraperitoneally into C57Bl/6 mice. After 10 days of tumor initiation, mice were treated with gemcitabine or PBS as described in methods. (A) Bar graph from n = 3, of total CD11b+Gr1+ myeloid cells in the peripheral blood of mice treated with gemcitabine compared to untreated. (B) Kaplan–Meier graphs indicate overall survival in control and gemcitabine mice (n = 12); p = 0.0005 by Gehan-Breslow-Wilcox test and p = 0.0008 by Mantel–Cox test. (C) The bar graph represents the average radiance of bioluminescence signal at 6 weeks of tumor progression (n = 6). Weeks indicate post-tumor injection time points. (D) Dot plots of mouse weight, abdominal circumference, and ascites volume (n = 6). (E) Representative H & E images of tumor tissue in ID8-luc2 mice treated with gemcitabine compared to untreated control at 10x. (F) Representative images of Ki67 staining for assessing tumor cell proliferation. Images are shown at 40× magnification. Tumor sections from all 8 mice/group were examined and representative bar graph for Ki-67 proliferation index. The number of Ki-67 positive cells were counted per high-power field (HPF; 400x). A total of 8 HPF were studied from 3 to 4 tumor sections/group. (G) The bar graph represents the average frequency of CD4+ and CD8+ T cells in the ascites of mice treated with gemcitabine compared to untreated control (n = 3). ∗p < 0.05, ∗∗p < 0.01, ∗∗∗p < 0.001, ns = non-significant, gemcitabine compared to control as assessed by unpaired T-test.
Supplementary figure 2
Depletion of CD11b+Gr1+myeloid cells and PD1 immunotherapy increase tumor-infiltrating T cells. ID8-luc2 cells were injected intraperitoneally into C57Bl/6 mice. After 10 days of tumor initiation, mice were treated with IgG2b or anti-Gr1 mAbs or anti-PD1 mAb or a combination of both as described in methods. Weeks indicate post-tumor injection time points. Tumor sections were immunostained for CD4 or CD8 expression. Representative images of positive CD4 (A) and CD8 (B) staining at 20x. Inset shows the area magnified to 40×. Quantification was performed by counting the positive cells per HPF from at least 3–4 slides per group with minimum of 6 HPF fields counted per slide ∗p < 0.05, ∗∗p < 0.01 compared to IgG2b; #p < 0.05 compared to anti-Gr1 and &p < 0.05 compared to anti-PD1 as assessed by unpaired T-test.
Supplementary figure 3
ID8 conditioned media induces immunosuppressive markers in CD11b+Gr1+myeloid cells. (A) Dot Blot representation of all the 88 immunosuppressive gene changes in BM isolated CD11b+Gr1+ myeloid cells from control and ID8 tumor of Figure 4I. (B) Dark exposure of immunoblots in Figure 4J. (C) Total RNA was isolated from BM-MDSC's treated with ID8 CM alone or in the presence of and GM-CSF/ IL 6. Quantitative-PCR mRNA expression of immunosuppressive markers STAT 3, iNOS, arginase 1, IL-1β, S100A9. (D) T cell proliferation was assayed by flow cytometry on day 5 by measuring the CFSE intensity individually in each generation. Representative flow graph is shown.
Supplementary Figure 4
ID8 conditioned media induces active metabolic phenotype in CD11b+Gr1+myeloid cells. CD11b+Gr1+ myeloid cells differentiated from BM by exposure of GM-CSF/IL-6 and exposed to ID8 conditioned media (CM) were subjected to Seahorse metabolic function analysis. (A) Oxygen consumption rate (OCR) and was assessed in real-time using XFe Seahorse analyzer as described in methods. Port injections of (1) oligomycin, (2) FCCP, and a combination of (3) rotenone-antimycin were given. (B) The bar graph represents basal and stressed OCR (n = 3). (C) Extracellular acidification rate (ECAR) was measured with port injections of (1) glucose, (2) oligomycin, and (3) 2-DG. (D) The bar graph represents basal and stressed ECAR (n = 3). (E) A quadrant plot indicates the metabolic shift of energy phenotype at basal and stressed levels. ∗∗p < 0.01, when compared to GM-CSF/IL6, treated MDSC's as assessed by unpaired T-test. (F) PCA plot showing the separation of CD11b+Gr1+ cells isolated from ID8 tumor mice and of non-tumor mice based on metabolic profile. (G) Table showing the top 12 KEGG metabolic pathways with the highest significance and impact as analyzed by MetaboAnalyst.
Supplementary Figure 5
Expanded Mito Fuel Flex Assay. Individual values of fuel dependency (A) and capacity (B) are shown in support of Figure 7A. The assay was performed as described in methods and Figure 7.
Supplementary Figure 6
Glutamine deprivation reduced the immunosuppressive function of CD11b+Gr1+myeloid cells. CD11b+Gr1+ myeloid cells differentiated from BM by exposure of GM-CSF/IL-6 alone and in the presence of ID8 conditioned media (CM) were exposed to regular glutamine (2 mm) and low glutamine (0.5 mm) conditions for 48 h. (A) Representative immunoblots of iNOS, STAT 3, and arginase 1. (B) mRNA expression of (B) STAT-3, (C) VEGF, (D) iNOS, (E) arginase 1, (F) IL-6, and (G) G-CSF as assessed by RT- PCR. (H) Isolated CD11b+Gr1+ myeloid cells were co-cultured with CFSE labeled CD4+ T cells in different ratios at 1:4 and 1:8 for 5 days, and CD4 cell proliferation was analyzed by CFSE intensity using flow cytometry. (I) On day 3, the supernatant was collected from the co-cultures, and IFNγ levels were measured by ELISA. ∗p < 0.05, ∗∗p < 0.01, ∗∗∗p < 0.001 compared to regular glutamine control as assessed by unpaired T-test.
Supplementary Figure 7
Increased DLST expression and effect of glutamine deprivation on upregulated TCA cycle genes. (A) Representative dot plot graph of 5-fold change of all the genes in the glucose metabolism PCR array (B) Bar graph represents the fold change in both downregulated and upregulated genes from glucose metabolism array. (B) Increased DLST expression validated individually by immunoblotting in CD11b+Gr1+ myeloid cells from GMCSF/IL6 and GMCSF/IL6+ ID8 CM and (D) Real-time PCR was performed on key upregulated genes Succinyl Co A ligase (SUCLG2), Succinate dehydrogenases (SDHA-SDHD) (from glucose metabolism array) under conditions of low and regular glutamine conditions (n = 3). ∗p < 0.05 low glutamine compared to regular glutamine as assessed by unpaired T-test.

Similar articles

Cited by

References

    1. Bogani G., Lopez S., Mantiero M., Ducceschi M., Bosio S., Ruisi S. Immunotherapy for platinum-resistant ovarian cancer. Gynecologic Oncology. 2020;158(2):484–488. - PubMed
    1. Coukos G., Tanyi J., Kandalaft L.E. Opportunities in immunotherapy of ovarian cancer. Annals of Oncology. 2016;27(Suppl 1):i11–i15. - PMC - PubMed
    1. Liu S., Matsuzaki J., Wei L., Tsuji T., Battaglia S., Hu Q. Efficient identification of neoantigen-specific T-cell responses in advanced human ovarian cancer. J Immunother Cancer. 2019;7(1):156. - PMC - PubMed
    1. Odunsi K., Jungbluth A.A., Stockert E., Qian F., Gnjatic S., Tammela J. NY-ESO-1 and LAGE-1 cancer-testis antigens are potential targets for immunotherapy in epithelial ovarian cancer. Cancer Research. 2003;63(18):6076–6083. - PubMed
    1. Szender J.B., Papanicolau-Sengos A., Eng K.H., Miliotto A.J., Lugade A.A., Gnjatic S. NY-ESO-1 expression predicts an aggressive phenotype of ovarian cancer. Gynecologic Oncology. 2017;145(3):420–425. - PMC - PubMed

Publication types