Review
. 2019 Nov 16;11(1):100.
doi: 10.1007/s40820-019-0330-9.

Cell Membrane Coating Technology: A Promising Strategy for Biomedical Applications

Affiliations
Review

Cell Membrane Coating Technology: A Promising Strategy for Biomedical Applications

Yao Liu et al. Nanomicro Lett. .

Abstract

Cell membrane coating technology is an approach to the biomimetic replication of cell membrane properties, and is an active area of ongoing research readily applicable to nanoscale biomedicine. Nanoparticles (NPs) coated with cell membranes offer an opportunity to unite natural cell membrane properties with those of the artificial inner core material. The coated NPs not only increase their biocompatibility but also achieve effective and extended circulation in vivo, allowing for the execution of targeted functions. Although cell membrane-coated NPs offer clear advantages, much work remains before they can be applied in clinical practice. In this review, we first provide a comprehensive overview of the theory of cell membrane coating technology, followed by a summary of the existing preparation and characterization techniques. Next, we focus on the functions and applications of various cell membrane types. In addition, we collate model drugs used in cell membrane coating technology, and review the patent applications related to this technology from the past 10 years. Finally, we survey future challenges and trends pertaining to this technology in an effort to provide a comprehensive overview of the future development of cell membrane coating technology.

Keywords: Biomimetic nanoparticles; Cancer therapy; Cell membrane; Detoxification; Immune modulation.


Figures

Fig. 1
Fig. 1
Membrane coating via physical co-extrusion approach. After obtaining appropriate cell membranes via hypotonic isolation, repeated freeze/thawing, or ultrasonic disruption, synthetic NP cores are co-extruded through a porous polycarbonate membrane. Adapted from Ref. [23] with permission
Fig. 2
Fig. 2
Cell membrane-coated NP characterization. a TEM image of RBCM-NPs showing the core–shell structure. Scale bar, 200 nm. Adapted from Ref. [36] with permission. b SEM images of the platelet membrane-derived vehicle-coated Si particles. Adapted from Ref. [82] with permission. c Average sizes and zeta potentials of PLGA NPs, RBC membrane vesicles, and RBCM-PLGA NPs. Adapted from Ref. [36] with permission. d CD47 levels measured by Western blotting demonstrating the retention of characteristic membrane proteins. e SDS-PAGE protein analysis of RBC-ghost, RBC-vesicle, and RBCM-NPs. Adapted from Ref. [83] with permission
Fig. 3
Fig. 3
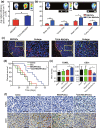
a, b Normal radiance values and images of the brains of normal nude mice and of brains bearing gliomas at days 7 or 14 of tumor progression. Mean ± SD, n = 3, *p < 0.05, **p < 0.005. c NP localization on day 14 post-tumor implantation, with DAPI (blue) representing nuclear staining, CD31 (red) indicating vasculature, and green indicating NPs. Glioma margin is demarcated by a yellow dotted line, and the tumor is indicated by a yellow arrow; Scale bar = 200 µm. d Survival of intracranial U87 glioma-bearing mice calculated via the Kaplan–Meier method. On days 7, 9, 11, 13, and 15 following tumor implantations, animals (n = 10) were injected using either saline as a vehicle control, or with free DOX, DOX-loaded RBC NPs (RBCNPs/DOX), and DOX-loaded DCDX-RBC NPs (DCDX-RBCNPs/DOX). e Integral optical density (IOD) values for tumors from differentially treated mice following either TUNEL staining or CD31/PAS dual staining. Mean density = IOD (SUM)/Area. Mean ± SD, n = 3, *p < 0.05. f TUNEL staining and CD31/PAS dual staining analysis of tumors. Scale bar = 100 µm. Adapted from Ref. [92] with permission
Fig. 4
Fig. 4
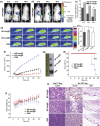
a Mice (n = 4) were i.v. administered drug-loaded NPs with or without an RBC membrane coating, using a 15 mg kg−1 PTX equivalent dose. PTX2-TK levels in b the liver and c tumor were assessed at specific time points following NP administration. d Tumor volume changes in mice treated with a range of formulations (PBS, PBS (L+), M(PTX), M(TPC) (L+), M(TPC-PTX), M(TPC-PTX) (L+), RBC(M(TPC-PTX)) and RBC(M(TPC-PTX)) (L+)). L+ indicated laser. e Tumor weights of mice treated as in d. f Body weights of mice over time. g Ex vivo tumor images, as indicated. h Tumor sections were H&E-stained following the indicated treatments. Scale bar = 200 µm. Data d-g are mean ± SEM (n = 6). *p < 0.05, **p <0.01, and ***p <0.001. Adapted from Ref. [95] with permission
Fig. 5
Fig. 5
a Infrared imaged from representative mice before and after treatments, with black arrows indicating tumor sites. b Tumor volumes over time in treated animals. c Tumor weights in differentially treated animals, with inset images displaying representative ex vivo tumor images at the end of treatment. d Representative H&E- and TUNEL-stained images from differentially treated mice. Data are mean ± SEM (n = 6). *p < 0.05, **p < 0.01, and ***p < 0.001 relative to control, respectively, and## represents p < 0.01 relative to conventional extrusion method. Adapted from Ref. [97] with permission
Fig. 6
Fig. 6
a H&E-stained human carotid arterial cross-sections from intact (upper) or injured (lower) samples. Scale bar = 200 μm. b Fluorescence imaging of cross sections (scale bar = 200 μm) and c luminal side (Scale bar = 500 μm) of intact (upper) or injured (lower) arterial tissue (in green) following incubation with PNPs (in red). de 3D reconstructions based on multiple section images from either undamaged (upper) or balloon-denuded (lower) rat arterial walls following i.v. PNP delivery, with nuclei stained blue and PNPs in red; 152.5 × 116 × 41 μm3. f PNP retention in denuded and undamaged arterial sites for 120 h following PNP administration (n = 6). g Representative arterial cross-sections from coronary restenosis model rats exposed to different treatments. Scale bar = 200 μm. h Magnified cross-sections highlighting differences in vascular remodeling among groups; I, intima; M, media. Scale bar = 100 μm. i Quantification of the intima-to-media area ratio and luminal obliteration in differently treated animals (n = 6). Data are mean ± S.D. NS, no significant difference. Adapted from Ref. [111] with permission
Fig. 7
Fig. 7
Mice received an i.v. injection of NPs, and after 12, 24, and 48 h, tumors and organs of random mice were isolated and used to assess fluorescence and verteporfin levels therein following homogenization. ac In vivo fluorescence images of mice implanted with 4T1 tumors 12, 24, and 48 h following injection of a PNPs and b RBC-coated NPs loaded with the red membrane dye DiR, with black circled dots identifying tumors. c Total radiant efficiency in tumors was determined based on the images from a and b. d Mice (n = 5/group) were irradiated with 680–730 nm light (0.05 W cm−2) for 10 min, 24 h after administration of PBS or of PNPs or RBC-coated NPs loaded with verteporfin. e Quantification of average tumor center temperatures from d. Data are mean ± S.D. f Average tumor volume in mice following light irradiation. g Tumors were excised from treated mice 35 days following NP administration. h Mouse survival and i average body weight of differently treated mice following light irradiation. Mice treated using RBC-coated NPs loaded with verteporfin are included for reference, as are PBS-injected controls. Data are mean ± standard deviation. j Tumor and skin sections stained with H&E on days 3 and 35 after NP administration. Scale bar = 50 µm. *p < 0.05 and **p < 0.01. Adapted from Ref. [114] with permission
Fig. 8
Fig. 8
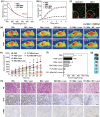
a NP UV–Vis absorption spectra. b Temperature change for control or NP preparations following 808 nm laser irradiation. c CLSM results from RAW 264.7 and MCF-7 cells following PLT-MN treatment and laser irradiation. FDA (green) and PI (red) were used to detect live and dead cells, respectively. Scale bar = 100 µm. d Representative in vivo IR thermal images from mice implanted using MCF-7 tumors following the indicated treatments. e Tumor volumes and f average weight following the indicated treatments. g Representative ex vivo tumor images and h HE-, Ki-67-, and TUNEL-staining of tumor tissue from differently treated animals. Scale bars = 200, 50, and 50 µm, respectively. Data are mean ± SEM (n = 6). NS: no statistical difference, *p < 0.05, **p < 0.01, ***p < 0.001, relative to PBS control. (Color figure online) Adapted from Ref. [115] with permission
Fig. 9
Fig. 9
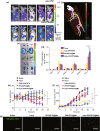
a Mice were injected with either cskc-PPiP or cskc-PPiP@Ma NPs loaded with an IR probe for the indicated amount of time. b 3D reconstructed fluorescent image of signal in a mouse 48 h following cskc-PPiP@Ma treatment. c Heart (H), liver (Li), spleen (S), lung (Lu), kidney (K), and tumor (T) tissues isolated from the mouse in b. d PTX levels in the organs of mice following treatment using PTX, cskc-PPiP/PTX, PPC8/PTX@Ma, or cskc-PPiP/PTX@Ma (n = 4). e Body weight and f tumor volumes over 3 weeks in treated mice. g Tumor tissues from mice treated as indicated were assessed for apoptotic cells, shown in green. Scale bar = 100 μm. Adapted from Ref. [126] with permission
Fig. 10
Fig. 10
a ROS production in cells exposed to T- or NK-membrane NPs following 660 nm irradiation (100 mW cm−2) was assessed using the fluorescent DCFH-DA indicator. b Flow cytometric assessment of apoptotic induction in irradiated cells exposed to T- and NK-NPs. c Western blotting-mediated measurement of apoptosis-associated proteins in response to NK-NP + PDT treatment. d Overview of the study experimental design, with a dual 4T1 tumor implant model in which primary tumors on the right side received PDT, whereas distal tumors on the left side did not. e Primary tumor growth. f Distal tumor growth. g Morbidity-free survival of differently treated mice. h Changes in body weight of differently treated mice. (n = 10). (*p < 0.05, **p < 0.01). Adapted from Ref. [128] with permission
Fig. 11
Fig. 11
Neutrophil-NPs reduce joint destruction and elicit a systemic therapeutic response following a prophylactic regimen. a Overview of the prophylactic regimen used in a CIA mouse model. b Changes in hind knee diameter over 60 days following CIA induction relative to day 0. c, d Representative H&E and safranin-O staining of knee sections prepared from mice treated using PBS, neutrophil-NPs, anti-IL-1β, or anti-TNF-α. Scale bar = 100 μm. F, synovial membrane fibrillation; H, synovium hyperplasia; I, immune infiltration. e Quantification of cartilage levels in differently treated mice as measured in safranin-O-stained sections. f Representative CD248 (upper) and fibronectin (lower) staining of knee sections from differently treated mice. Scale bar = 10 μm. g Concentration of TNF-α and IL-1β in the serum of CIA mice in different groups. h Changes in hind ankle diameter on day 60 after arthritis induction compared to that on day 0. i, j Values of paw volume and arthritis score were recorded every other day for a total of 60 days. All data points represent mean ± S.D. (n = 7 CIA mice). *p ≤ 0.05, **p ≤ 0.01, ***p ≤ 0.001. One-way ANOVA with Dunnett’s post hoc analysis. Adapted from Ref. [134] with permission
Fig. 12
Fig. 12
ae In vivo effects of CPPNs in mice implanted with 4T1 tumors. a Tumor-growth and b lung metastases in differently treated mice. c Tumor TUNEL staining. Scale bar = 200 μm. d Lung tissues and e H&E stained lung tissues following experimental termination. Scale bar = 100 μm. White arrows indicate metastases. f In vivo bioluminescent imaging of mice in an i.v. 4T1 metastatic model. Data are mean ± SD (n = 5). Statistical significance: *p < 0.05, **p < 0.005, and ***p < 0.0005. Adapted from Ref. [141] with permission
Fig. 13
Fig. 13
In vivo mCGP anti-tumor efficacy. a Overview schematic of the approach to combination PDT/tumor starvation achieved via mCGPs. b Tumor volumes and c changes in body weight 14 days following indicated treatments, *p < 0.05. Arrows correspond to therapeutic administration. d Average tumor weight and e representative images following 14 days of indicated treatments. *p < 0.05. f Immunofluorescent HIF-1a staining following PBS or mCGP treatment. g H&E stained tumor sections on day 14 in differently treated mice. Scale bar = 200 μm. Adapted from Ref. [145] with permission
Fig. 14
Fig. 14
DOX-loaded CAuNCs mediate synergistic PTT and chemotherapy. a H22 tumor growth in mice following treatment with the indicated Au/DOX doses (10 and 15 mg kg−1) with or without irradiation (10 min; 808 nm; 1 W cm−2) once daily for 4 days (n = 13). B Tumor weight after treatment (n = 5). c Photos of tumors after treatment. d H&E stained tumor sections from mice treated as in a. Scale bar = 50 μm. e Kaplan–Meier survival curve for mice treated as in a (n = 8). Data are mean ± SD, *p < 0.05, **p < 0.01, ***p < 0.001. Adapted from Ref. [40] with permission

Similar articles

Cited by

References

    1. Agasti SS, Rana S, Park MH, Kim CK, You CC, Rotello VM. Nanoparticles for detection and diagnosis. Adv. Drug Deliv. Rev. 2010;62(3):316–328. doi: 10.1016/j.addr.2009.11.004. - DOI - PMC - PubMed
    1. Fang RH, Zhang L. Nanoparticle-based modulation of the immune system. Annu. Rev. Chem. Biomol. Eng. 2016;7:305–326. doi: 10.1146/annurev-chembioeng-080615-034446. - DOI - PubMed
    1. Naahidi S, Jafari M, Edalat F, Raymond K, Khademhosseini A, Chen P. Biocompatibility of engineered nanoparticles for drug delivery. J. Control Release. 2013;166(2):182–194. doi: 10.1016/j.jconrel.2012.12.013. - DOI - PubMed
    1. Doane T, Burda C. Nanoparticle mediated non-covalent drug delivery. Adv. Drug Deliv. Rev. 2013;65(5):607–621. doi: 10.1016/j.addr.2012.05.012. - DOI - PMC - PubMed
    1. Shi S, Chen F, Goel S, Graves SA, Luo H, Theuer CP, Engle JW, Cai W. In vivo tumor-targeted dual-modality pet/optical imaging with a yolk/shell-structured silica nanosystem. Nano-Micro Lett. 2018;10(4):65. doi: 10.1007/s40820-018-0216-2. - DOI - PMC - PubMed

LinkOut - more resources