. 2021 Jul 9;49(12):6722-6738.
doi: 10.1093/nar/gkab465.

Upregulation of RNA cap methyltransferase RNMT drives ribosome biogenesis during T cell activation

Affiliations

Upregulation of RNA cap methyltransferase RNMT drives ribosome biogenesis during T cell activation

Alison Galloway et al. Nucleic Acids Res. .

Abstract

The m7G cap is ubiquitous on RNAPII-transcribed RNA and has fundamental roles in eukaryotic gene expression, however its in vivo role in mammals has remained unknown. Here, we identified the m7G cap methyltransferase, RNMT, as a key mediator of T cell activation, which specifically regulates ribosome production. During T cell activation, induction of mRNA expression and ribosome biogenesis drives metabolic reprogramming, rapid proliferation and differentiation generating effector populations. We report that RNMT is induced by T cell receptor (TCR) stimulation and co-ordinates the mRNA, snoRNA and rRNA production required for ribosome biogenesis. Using transcriptomic and proteomic analyses, we demonstrate that RNMT selectively regulates the expression of terminal polypyrimidine tract (TOP) mRNAs, targets of the m7G-cap binding protein LARP1. The expression of LARP1 targets and snoRNAs involved in ribosome biogenesis is selectively compromised in Rnmt cKO CD4 T cells resulting in decreased ribosome synthesis, reduced translation rates and proliferation failure. By enhancing ribosome abundance, upregulation of RNMT co-ordinates mRNA capping and processing with increased translational capacity during T cell activation.


Figures

Figure 1.
Figure 1.
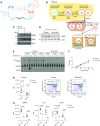
RNMT is upregulated following T cell activation (A) m7Gpppm6Am cap structure with methyltransferases. (B) The Rnmt cKO T cell model: mature and progenitor T cell populations are shown with the stage of Rnmt deletion and ex-vivo activation protocol. (C) Control CD4 T cells were activated, after 2 days IL2 was added. Western blot analysis of RNMT and RAM expression. (D) RNMT expression in 20 h-activated Rnmt cKO (n = 3) and control (n = 3) CD4 T cells. Equivalent cell numbers analysed. (E, F) Cap methyltransferase activity in 1.6 × 10⁵ control (n = 3) and Rnmt cKO (n = 3) activated CD4 T cells. GpppG capped RNA was incubated with the T cell extracts for the indicated times and the proportion of caps converted to m7GpppG was determined. (E) radiograph. (F) quantification. (G) FACS analysis of control (n = 5) and Rnmt cKO (n = 5) thymi. Quantification of single positive (SP) cells and representative plots displaying live cells. Population names on control plot. Dots indicate biological replicates, lines indicate means, P values from ANOVA with Sidak's multiple comparisons test throughout. (H) FACS quantification of CD4 and CD8 T cells in spleens, peripheral lymph nodes (pLN), and percentage in blood from control (n = 5) and Rnmt cKO (n = 5) mice. Figures are representative of (C, D) three and (G, H) two experiments.
Figure 2.
Figure 2.
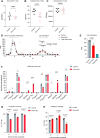
Rnmt cKO T cells have reduced mRNA cap methylation and C-initiating mRNA (A) dT-purified mRNA/cell from control (n = 5) and Rnmt cKO (n = 4) naïve CD4 T cells. Dots represent biological replicates, bars indicate means. P values from Student's t-test. (B, C) 20 h-activated CD4 T cells were incubated with 3H uridine for 4 h. mRNA was dT-purified from control (n = 6) and Rnmt cKO (n = 6) cells. (B) mRNA per million cells. (C) CPM per μg mRNA. Dots represent biological replicates, bars indicate means. P values from Student's t-test. Data combined from two experiments. (D, E) CD4 T cells activated for 20 h were 3H-labelled on methyl groups for 2.25 h. Nucleotides from total RNA from control cells (n = 1), and mRNA from control (n = 3) and Rnmt cKO cells (n = 4) were resolved by chromatography. Equivalent RNA loaded. (D) Counts per minute (CPM) presented. Elution volumes of cap dinucleotides and nucleotides determined using standards. Points represent replicates, lines join medians. (E) CPM from cap dinucleotides, fractions 28–34 ml. Dots represent biological replicates, bars indicate mean. P value from Student's t-test. (F, H) CAP MAP analysis in Rnmt cKO and control 20 hour activated CD4 T cells. (F) Quantitation of cap structures. P values from multiple t-tests corrected with FDR approach * P <0.050, ** P < 0.010, ***P < 0.001. (G) Proportion of caps with m7G structures. P values from ANOVA with Sidak's multiple comparisons test. (H) Proportion of caps initiating with each nucleotide. P values from ANOVA with Sidak's multiple comparisons test. Dots represent biological replicates, bars indicate mean.
Figure 3.
Figure 3.
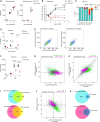
LARP1 target RP mRNAs are sensitive to loss of Rnmt (A–C) RNAseq analysis of control (n = 3) and Rnmt cKO (n = 3) naïve CD4 T cells. (A) MA plot of RNA expression. Dots represent genes. Reads per million mapped reads (RPKM) on x-axis. Control and Rnmt cKO samples were compared using EdgeR exact test and adjusted P-value used. Ribosomal protein genes and other TOP-RNA genes indicated. (B) Distribution of RPKM within all genes or ribosome protein genes (RPGs) in control and Rnmt cKO naïve CD4 T cell RNAseq data. (C) % of transcripts from RPG calculated using RPKM as an approximation of transcript abundance. (D) Western blot analysis of LARP1 from Jurkat cell lysates enriched on m7GTP- or GTP-agarose beads. Data representative of three experiments. (E-I) LARP1 eCLIP of control and Rnmt cKO naïve CD4 T cells. Distribution of reads as counts per million (CPM) across protein-coding transcripts (E) and non-coding genes (pseudogene and lncRNA) (F) with LARP1 binding sites. (G) Distribution of reads from LARP1 eCLIP on control naïve CD4 T cells as counts per million (CPM) along target transcripts for three different anti-LARP1 antibodies. (All other data is Abcam ab86359 antibody which was selected for further analysis). (H) Nucleotide composition surrounding LARP1 binding sites in 5′UTRs. (I) Reads from anti-LARP1 antibody purified transcripts, isotype control antibody, and size matched input reads aligning to two example LARP1 target transcripts. Genes annotated, dark yellow = protein coding transcripts, light yellow = non-coding genes, blue = snoRNA. CD4 T cell CAGE data from FANTOM 5 project shown for reference. Counts are the number of reads starting at that position; read starts are expected to be 1nt downstream of the crosslink site.
Figure 4.
Figure 4.
Small RNAs are sensitive to loss of Rnmt (A, B) Fold change in RNA expression from Rnmt cKO vs control naïve T cell RNAseq analysis. LARP1 target transcripts identified by eCLIP. (A) Transcripts grouped by LARP1 binding position and transcript biotype. (B) Transcripts with LARP1 binding to the 5′UTR grouped by functional pathway. (C) sRNA expression in RNAseq analysis of control (n = 3) and Rnmt cKO (n = 3) naïve CD4 T cells. sRNAs are grouped by RFAM family and highlighted if at least one gene overlaps with a LARP1 target, defined as 5′UTR or non-coding RNA binding. (D, E) Splicing analysis performed using RNAseq data from control (n = 3) and Rnmt cKO (n = 3) naïve CD4 T cells. Exons and introns reads normalised to total reads for that transcript. Then exon and intron read densities for each transcript compared between controls and Rnmt cKOs. (D) Violins represent the frequency density. Box plots show median, upper and lower quartiles. Whiskers, 1.5× interquartile range. (E) Pie chart of significantly altered introns and exons determined using DEXseq. Numbers indicate the number of significant differential splicing events in each group.
Figure 5.
Figure 5.
Rnmt cKO T cells have a defect in protein synthesis following activation (A–F) Control and Rnmt cKO lymph node cells were activated, after 2 days IL2 was added. (A) FACS analysis of CD69 and CD25 in control (n = 5) and Rnmt cKO (n = 5) CD4 T cells. Median fluorescence intensity (MFI) shown. On dot plots, dots indicate biological replicates, line indicates mean. (B) Proliferation of control (n = 3) and Rnmt cKO (n = 3) CD4 T cells. (C) FACS analysis of cell cycle of control (n = 5) and Rnmt cKO (n = 5) CD4 T cells, P-values are for % S phase cells. Bar indicates the mean, error bars indicate standard deviation. (D) Percent of control (n = 5) and Rnmt cKO (n = 5) annexin V+ CD4 T cells. (E) Example FACS plots showing forward and side scatter of control (1 of n = 5) and Rnmt cKO (1 of n = 5) CD4 T cells following one day of activation. (F) MFI of Puromycin incorporation into nascent peptides in control (n = 5) and Rnmt cKO (n = 5) CD4 T cells. P-values from ANOVA tests with Sidak's post test. (G–K) Ribosome footprinting analysis of cytoplasmic RNA from control (n = 3) and Rnmt cKO (n = 3) 20 h activated CD4 T cells. On scatter plots dots represent genes. Genes with LARP1 binding to transcript 5′UTR in pink. (G) MA plot of total RNA expression. Reads per million mapped reads (RPKM) on x-axis. Control and Rnmt cKO samples compared using EdgeR Exact Test. (H) Comparison of fold changes in total RNA and ribosome protected fragment (RPF) RNA. Differential translation efficiency (TE) in control and Rnmt cKO was calculated using Ribodiff. (I) Venn diagram displaying overlap between differentially expressed total RNA and RPF RNA, both P < 0.05 with EdgeR exact test. (J) Comparison of fold changes in total RNA and translation efficiency (TE). (K) Venn diagram displaying overlap between differentially expressed total RNA P < 0.05 with EdgeR exact test, and translation efficiency, P < 0.05 with Ribodiff. Figures representative of (A– F) two experiments.
Figure 6.
Figure 6.
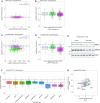
RNMT promotes expression of ribosome biogenesis factors in activated T cells TMT proteomics analysis of (A, B) control (n = 4) and Rnmt cKO (n = 3) naïve CD4 T cells; (C, D) control (n = 4) and Rnmt cKO (n = 4) 20 h-activated CD4 T cells. (A, C) MA plot of protein expression. Control and Rnmt cKO samples compared by linear modelling in Limma using histone protein intensities to normalise expression between samples. Black dashed line is at Log2 (Rnmt cKO/control) = 0 and blue dashed line on (C) indicates the median Log2(Rnmt cKO/control). (B, D) Fold change in proteins encoded by LARP1 target transcripts (eCLIP), in Rnmt cKO vs control naïve. Black dashed line is at log2 (Rnmt cKO/control) = 0 and blue dashed line on (D) indicates the median log2 (Rnmt cKO/control). (E) Western blot analysis of ribosomal proteins in control (n = 4) and Rnmt cKO (n = 4) 20 hour activated CD4 T cells. (F) Fold change in proteins in Rnmt cKO versus control activated CD4 T cells, proteins encoded by LARP1 target transcripts (eCLIP), defined here as 5′UTR binding, are grouped by pathway. Black dashed line is at log2 (Rnmt cKO/control) = 0 and blue dashed line indicates the median log2 (Rnmt cKO/control). (G) Comparison of protein and RNA expression from 20 h activated T cell cytoplasmic RNAseq and TMT proteomics analyses. Nucleolar proteins with LARP1 binding to their transcript 5′UTR mRNA highlighted.
Figure 7.
Figure 7.
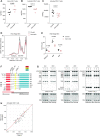
RNMT promotes ribosome biogenesis in activated T cells (A) RNA/cell from control (n = 5) and Rnmt cKO (n = 4) naïve CD4 T cells. Dots represent biological replicates, bars indicate means. P values from Student's t-test. (B, C) 20 h activated CD4 T cells were incubated with 3H uridine for 4 h. (B) RNA per million control (n = 4) and Rnmt cKO (n = 4) cells. (C) CPM per μg RNA from control (n = 6) and Rnmt cKO (n = 6) cells (data combined from two experiments). Dots represent biological replicates, bars indicate mean. P values from Student's t-test. (D, E) Ribo Mega-SEC analysis of control (n = 3) and Rnmt cKO (n = 3) activated CD4 T cells, equivalent cells were loaded. (D) Polysome profiles. Lines represent biological replicates. (E) Peak areas for 80S/polysomes, 60S and 40S ribosomes. Dots indicate biological replicates. Line indicates the mean. P values from an ANOVA with Sidak's post-test. (F, G) Northern blot analysis of rRNA intermediates in control (n = 3) and Rnmt cKO (n = 3) activated CD4 T cells. (F) Diagram explaining the fragments and probes. (G) Northern blots. Each column number represents a biological replicate. (H) Pseudouridine (Ψ)-seq analysis of control (n = 4) and Rnmt cKO (n = 4) activated CD4 T cells. PSU-score = (read starts/read coverage) CMC treated/(read starts/read coverage) mock treated for nucleotide downstream of Ψ. Samples compared by linear modelling in Limma, no significant changes found. Figures representative of (D, E) three experiments.

Similar articles

Cited by

References

    1. Chapman N.M., Boothby M.R., Chi H.. Metabolic coordination of T cell quiescence and activation. Nat. Rev. Immunol. 2020; 20:55–70. - PubMed
    1. Tan H., Yang K., Li Y., Shaw T.I., Wang Y., Blanco D.B., Wang X., Cho J.H., Wang H., Rankin S.et al. .. Integrative proteomics and phosphoproteomics profiling reveals dynamic signaling networks and bioenergetics pathways underlying T cell activation. Immunity. 2017; 46:488–503. - PMC - PubMed
    1. Wolf T., Jin W., Zoppi G., Vogel I.A., Akhmedov M., Bleck C.K.E., Beltraminelli T., Rieckmann J.C., Ramirez N.J., Benevento M.et al. .. Dynamics in protein translation sustaining T cell preparedness. Nat. Immunol. 2020; 21:927–937. - PMC - PubMed
    1. Howden A.J.M., Hukelmann J.L., Brenes A., Spinelli L., Sinclair L.V., Lamond A.I., Cantrell D.A.. Quantitative analysis of T cell proteomes and environmental sensors during T cell differentiation. Nat. Immunol. 2019; 20:1542–1554. - PMC - PubMed
    1. Davari K., Lichti J., Gallus C., Greulich F., Uhlenhaut N.H., Heinig M., Friedel C.C., Glasmacher E.. Rapid genome-wide recruitment of RNA polymerase II drives transcription, splicing, and translation events during T cell responses. Cell Rep. 2017; 19:643–654. - PubMed

Publication types

MeSH terms