

Small Intestinal Tuft Cell Activity Associates With Energy Metabolism in Diet-Induced Obesity
- PMID: 34122403
- PMCID: PMC8195285
- DOI: 10.3389/fimmu.2021.629391
Small Intestinal Tuft Cell Activity Associates With Energy Metabolism in Diet-Induced Obesity
Abstract
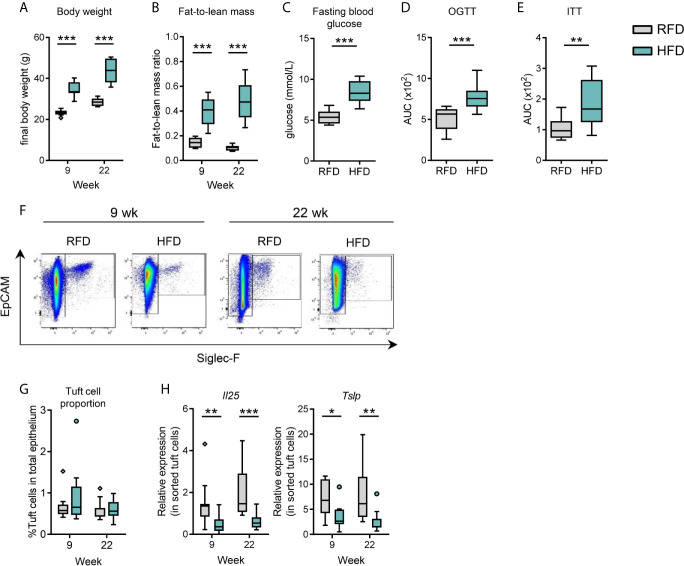
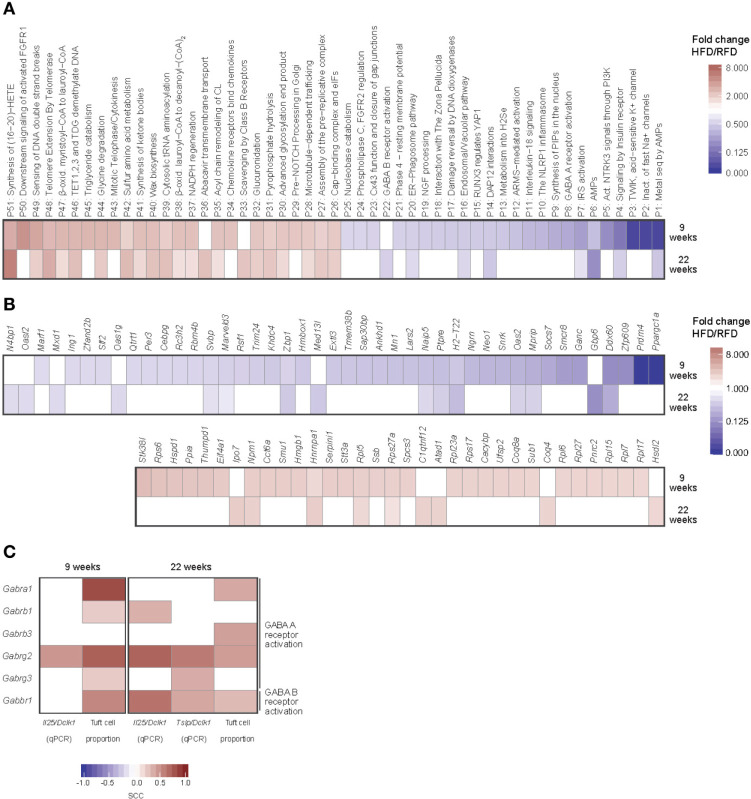
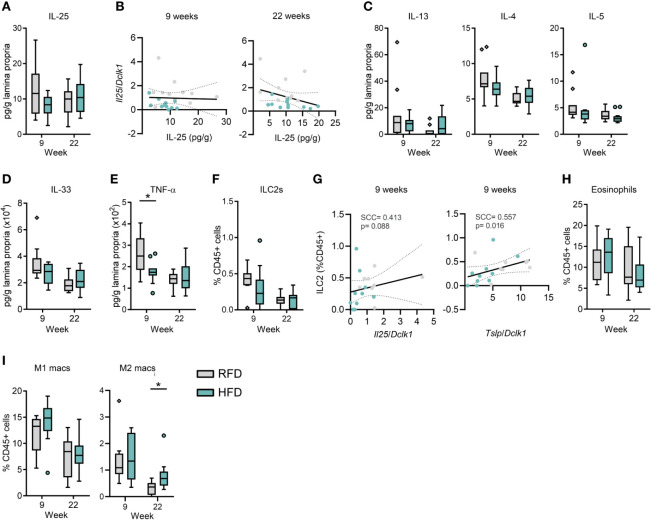
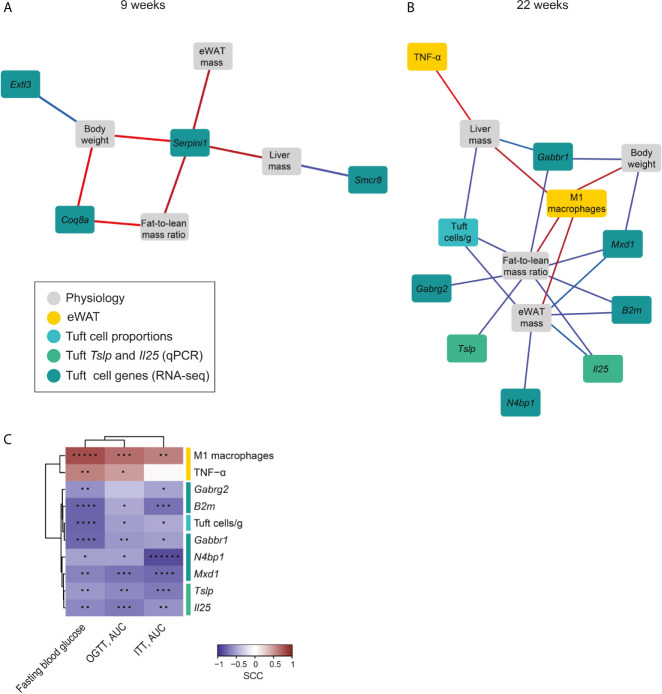
Little is known about the involvement of type 2 immune response-promoting intestinal tuft cells in metabolic regulation. We here examined the temporal changes in small intestinal tuft cell number and activity in response to high-fat diet-induced obesity in mice and investigated the relation to whole-body energy metabolism and the immune phenotype of the small intestine and epididymal white adipose tissue. Intake of high fat diet resulted in a reduction in overall numbers of small intestinal epithelial and tuft cells and reduced expression of the intestinal type 2 tuft cell markers Il25 and Tslp. Amongst >1,700 diet-regulated transcripts in tuft cells, we observed an early association between body mass expansion and increased expression of the gene encoding the serine protease inhibitor neuroserpin. By contrast, tuft cell expression of genes encoding gamma aminobutyric acid (GABA)-receptors was coupled to Tslp and Il25 and reduced body mass gain. Combined, our results point to a possible role for small intestinal tuft cells in energy metabolism via coupled regulation of tuft cell type 2 markers and GABA signaling receptors, while being independent of type 2 immune cell involvement. These results pave the way for further studies into interventions that elicit anti-obesogenic circuits via small intestinal tuft cells.
Keywords: GABA; gut-brain axis; high fat diet; metabolism; neuroserpin; tuft cells; type 2 immune responses.
Copyright © 2021 Arora, Andersen, Moll, Danneskiold-Samsøe, Xu, Zhou, Kladis, Rausch, Workman, Kristiansen and Brix.
Conflict of interest statement
Author KK is employed by BGI-Shenzhen. The remaining authors declare that the research was conducted in the absence of any commercial or financial relationships that could be construed as a potential conflict of interest.
Figures
Similar articles
-
Erythritol Ameliorates Small Intestinal Inflammation Induced by High-Fat Diets and Improves Glucose Tolerance.Int J Mol Sci. 2021 May 24;22(11):5558. doi: 10.3390/ijms22115558. Int J Mol Sci. 2021. PMID: 34074061 Free PMC article.
-
C-C motif chemokine receptor 9 regulates obesity-induced insulin resistance via inflammation of the small intestine in mice.Diabetologia. 2021 Mar;64(3):603-617. doi: 10.1007/s00125-020-05349-4. Epub 2021 Jan 5. Diabetologia. 2021. PMID: 33399911
-
Activation of intestinal tuft cell-expressed Sucnr1 triggers type 2 immunity in the mouse small intestine.Proc Natl Acad Sci U S A. 2018 May 22;115(21):5552-5557. doi: 10.1073/pnas.1720758115. Epub 2018 May 7. Proc Natl Acad Sci U S A. 2018. PMID: 29735652 Free PMC article.
-
Gut-Specific Delivery of T-Helper 17 Cells Reduces Obesity and Insulin Resistance in Mice.Gastroenterology. 2017 Jun;152(8):1998-2010. doi: 10.1053/j.gastro.2017.02.016. Epub 2017 Feb 27. Gastroenterology. 2017. PMID: 28246016
-
High-fat diet decreases energy expenditure and expression of genes controlling lipid metabolism, mitochondrial function and skeletal system development in the adipose tissue, along with increased expression of extracellular matrix remodelling- and inflammation-related genes.Br J Nutr. 2015 Mar 28;113(6):867-77. doi: 10.1017/S0007114515000100. Epub 2015 Mar 6. Br J Nutr. 2015. PMID: 25744306
Cited by
-
An update on the biological characteristics and functions of tuft cells in the gut.Front Cell Dev Biol. 2023 Jan 10;10:1102978. doi: 10.3389/fcell.2022.1102978. eCollection 2022. Front Cell Dev Biol. 2023. PMID: 36704202 Free PMC article. Review.
-
Tuft Cells and Their Role in Intestinal Diseases.Front Immunol. 2022 Feb 14;13:822867. doi: 10.3389/fimmu.2022.822867. eCollection 2022. Front Immunol. 2022. PMID: 35237268 Free PMC article. Review.
-
Enteric Tuft Cells in Host-Parasite Interactions.Pathogens. 2021 Sep 9;10(9):1163. doi: 10.3390/pathogens10091163. Pathogens. 2021. PMID: 34578195 Free PMC article. Review.
-
Colonic Tuft Cells: The Less-Recognized Therapeutic Targets in Inflammatory Bowel Disease and Colorectal Cancer.Int J Mol Sci. 2024 Jun 5;25(11):6209. doi: 10.3390/ijms25116209. Int J Mol Sci. 2024. PMID: 38892399 Free PMC article. Review.
-
Tuft Cells: Detectors, Amplifiers, Effectors and Targets in Parasite Infection.Cells. 2023 Oct 18;12(20):2477. doi: 10.3390/cells12202477. Cells. 2023. PMID: 37887321 Free PMC article. Review.
References
Publication types
MeSH terms
Substances
LinkOut - more resources
Full Text Sources
Medical
Molecular Biology Databases