

CSF1/CSF1R Signaling Inhibitor Pexidartinib (PLX3397) Reprograms Tumor-Associated Macrophages and Stimulates T-cell Infiltration in the Sarcoma Microenvironment
- PMID: 34088832
- PMCID: PMC9336538
- DOI: 10.1158/1535-7163.MCT-20-0591
CSF1/CSF1R Signaling Inhibitor Pexidartinib (PLX3397) Reprograms Tumor-Associated Macrophages and Stimulates T-cell Infiltration in the Sarcoma Microenvironment
Abstract
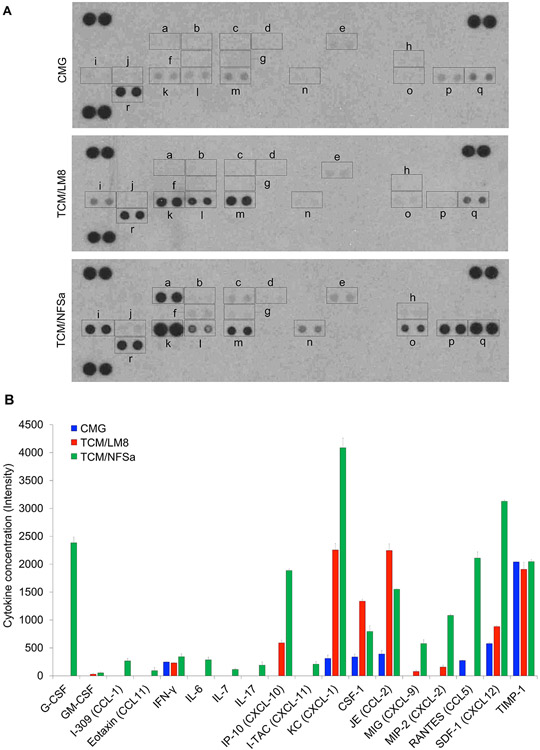
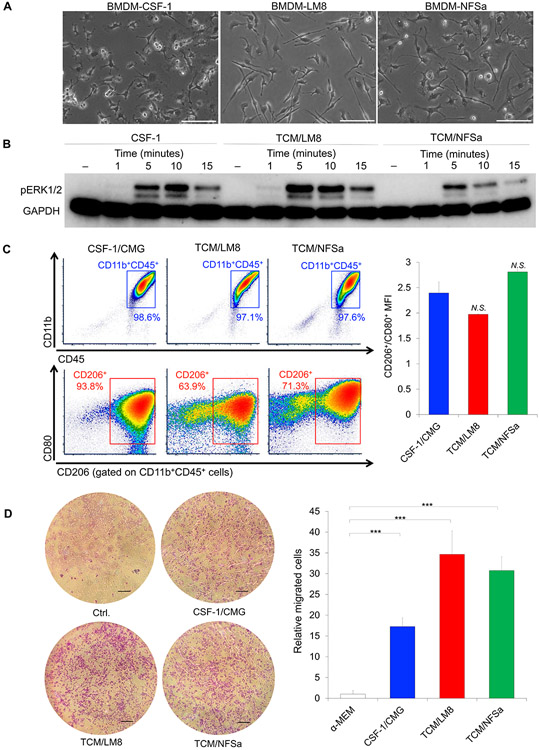
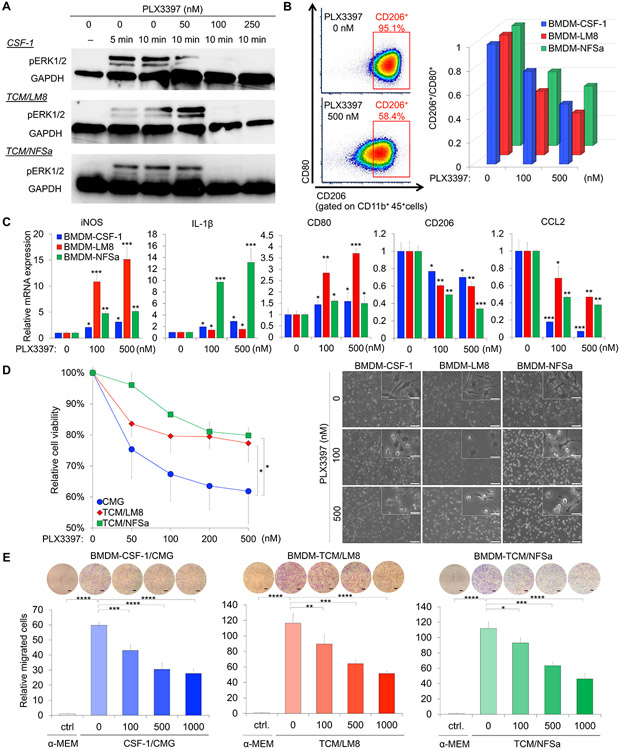
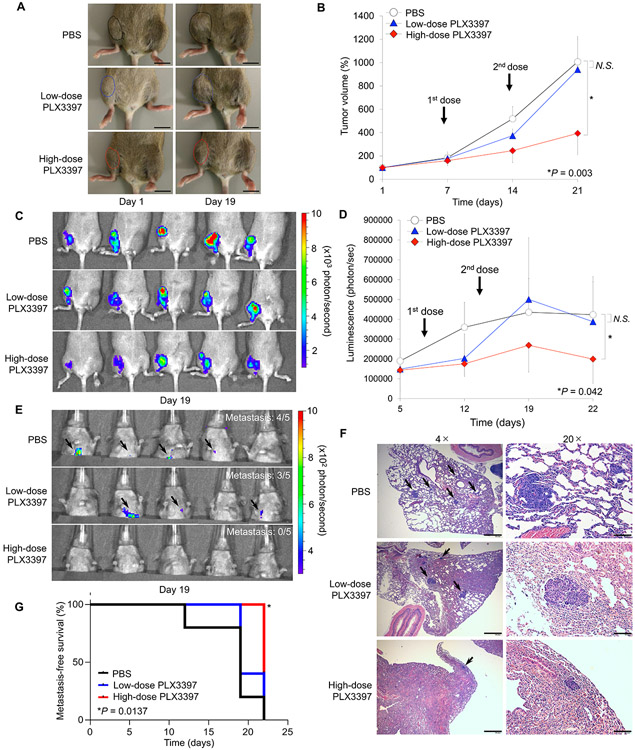
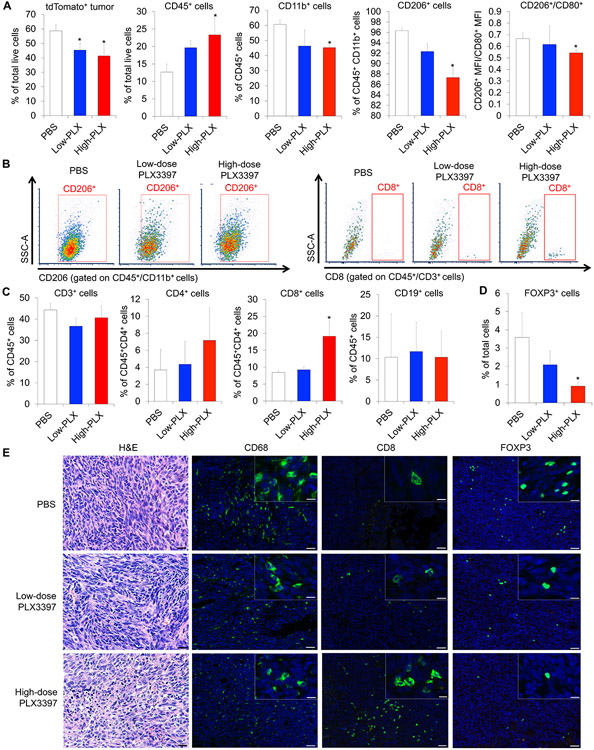
Colony-stimulating factor 1 (CSF1) is a primary regulator of the survival, proliferation, and differentiation of monocyte/macrophage that sustains the protumorigenic functions of tumor-associated macrophages (TAMs). Considering current advances in understanding the role of the inflammatory tumor microenvironment, targeting the components of the sarcoma microenvironment, such as TAMs, is a viable strategy. Here, we investigated the effect of PLX3397 (pexidartinib) as a potent inhibitor of the CSF1 receptor (CSF1R). PLX3397 was recently approved by the Food and Drug Administration (FDA) to treat tenosynovial giant cell tumor and reprogram TAMs whose infiltration correlates with unfavorable prognosis of sarcomas. First, we confirmed by cytokine arrays of tumor-conditioned media (TCM) that cytokines including CSF1 are secreted from LM8 osteosarcoma cells and NFSa fibrosarcoma cells. The TCM, like CSF1, stimulated ERK1/2 phosphorylation in bone marrow-derived macrophages (BMDMs), polarized BMDMs toward an M2 (TAM-like) phenotype, and strikingly promoted BMDM chemotaxis. In vitro administration of PLX3397 suppressed pERK1/2 stimulation by CSF1 or TCM, and reduced M2 polarization, survival, and chemotaxis in BMDMs. Systemic administration of PLX3397 to the osteosarcoma orthotopic xenograft model significantly suppressed the primary tumor growth and lung metastasis, and thus improved metastasis-free survival. PLX3397 treatment concurrently depleted TAMs and FOXP3+ regulatory T cells and, surprisingly, enhanced infiltration of CD8+ T cells into the microenvironments of both primary and metastatic osteosarcoma sites. Our preclinical results show that PLX3397 has strong macrophage- and T-cell-modulating effects that may translate into cancer immunotherapy for bone and soft-tissue sarcomas.
©2021 American Association for Cancer Research.
Conflict of interest statement
CONFLICT OF INTEREST
The authors TF, MY, AC1 AC2, GY, OO, RV, TO, EP disclosed no potential conflicts relevant to this article. JH is a paid consultant for Daiichi Sankyo.
Figures
Similar articles
-
Disruption of tumour-associated macrophage trafficking by the osteopontin-induced colony-stimulating factor-1 signalling sensitises hepatocellular carcinoma to anti-PD-L1 blockade.Gut. 2019 Sep;68(9):1653-1666. doi: 10.1136/gutjnl-2019-318419. Epub 2019 Mar 22. Gut. 2019. PMID: 30902885
-
PLX3397 treatment inhibits constitutive CSF1R-induced oncogenic ERK signaling, reduces tumor growth, and metastatic burden in osteosarcoma.Bone. 2020 Jul;136:115353. doi: 10.1016/j.bone.2020.115353. Epub 2020 Apr 3. Bone. 2020. PMID: 32251854
-
Colony-Stimulating Factor 1 Receptor Blockade Inhibits Tumor Growth by Altering the Polarization of Tumor-Associated Macrophages in Hepatocellular Carcinoma.Mol Cancer Ther. 2017 Aug;16(8):1544-1554. doi: 10.1158/1535-7163.MCT-16-0866. Epub 2017 Jun 1. Mol Cancer Ther. 2017. PMID: 28572167
-
Prospects of Treating Tenosynovial Giant Cell Tumor through Pexidartinib: A Review.Anticancer Agents Med Chem. 2021;21(12):1510-1519. doi: 10.2174/1871520620999201102123555. Anticancer Agents Med Chem. 2021. PMID: 33143617 Review.
-
Pexidartinib for the treatment of adult symptomatic patients with tenosynovial giant cell tumors.Expert Rev Clin Pharmacol. 2020 Jun;13(6):571-576. doi: 10.1080/17512433.2020.1771179. Epub 2020 Jun 1. Expert Rev Clin Pharmacol. 2020. PMID: 32478598 Review.
Cited by
-
Diagnostic utility of CSF1 immunohistochemistry in tenosynovial giant cell tumor for differentiating from giant cell-rich tumors and tumor-like lesions of bone and soft tissue.Diagn Pathol. 2022 Nov 1;17(1):88. doi: 10.1186/s13000-022-01266-9. Diagn Pathol. 2022. PMID: 36320082 Free PMC article.
-
A TLR4 Agonist Induces Osteosarcoma Regression by Inducing an Antitumor Immune Response and Reprogramming M2 Macrophages to M1 Macrophages.Cancers (Basel). 2023 Sep 19;15(18):4635. doi: 10.3390/cancers15184635. Cancers (Basel). 2023. PMID: 37760603 Free PMC article.
-
Deciphering the performance of macrophages in tumour microenvironment: a call for precision immunotherapy.J Hematol Oncol. 2024 Jun 11;17(1):44. doi: 10.1186/s13045-024-01559-0. J Hematol Oncol. 2024. PMID: 38863020 Free PMC article. Review.
-
Role of ACSL4 in modulating farnesoid X receptor expression and M2 macrophage polarization in HBV-induced hepatocellular carcinoma.MedComm (2020). 2024 Sep 12;5(9):e706. doi: 10.1002/mco2.706. eCollection 2024 Sep. MedComm (2020). 2024. PMID: 39268355 Free PMC article.
-
Identification of an Autophagy-Related Signature for Prognosis and Immunotherapy Response Prediction in Ovarian Cancer.Biomolecules. 2023 Feb 9;13(2):339. doi: 10.3390/biom13020339. Biomolecules. 2023. PMID: 36830707 Free PMC article.
References
-
- Ries CH, Cannarile MA, Hoves S, Benz J, Wartha K, Runza V, et al. Targeting tumor-associated macrophages with anti-CSF-1R antibody reveals a strategy for cancer therapy. Cancer Cell 2014;25(6):846–59. - PubMed
-
- Zhu Y, Knolhoff BL, Meyer MA, Nywening TM, West BL, Luo J, et al. CSF1/CSF1R blockade reprograms tumor-infiltrating macrophages and improves response to T-cell checkpoint immunotherapy in pancreatic cancer models. Cancer Res 2014;74(18):5057–69 doi 10.1158/0008-5472.CAN-13-3723. - DOI - PMC - PubMed
Publication types
MeSH terms
Substances
Grants and funding
LinkOut - more resources
Full Text Sources
Research Materials
Miscellaneous
