. 2021 May 17:12:685724.
doi: 10.3389/fimmu.2021.685724. eCollection 2021.

The Release of Peripheral Immune Inflammatory Cytokines Promote an Inflammatory Cascade in PCOS Patients via Altering the Follicular Microenvironment

Affiliations

The Release of Peripheral Immune Inflammatory Cytokines Promote an Inflammatory Cascade in PCOS Patients via Altering the Follicular Microenvironment

Yishan Liu et al. Front Immunol. .

Abstract

Background: Hormones and immune imbalance are critical factors in polycystic ovary syndrome (PCOS). The alternation of immune microenvironment of oocytes may play a significant role in infertility of PCOS patients.

Objective: This study explores the role of follicular fluid microenvironment change in inflammatory pathways activation of granulosa cells (GCs) in PCOS women infertility.

Methods: We enrolled 27 PCOS patients and 30 controls aged 22 to 38 years who underwent IVF and collected their luteinized granulosa cells (LGCs). Meanwhile, a granulosa-like tumor cell line (KGN) as a cell-model assisted this study. Key inflammatory markers in human ovarian GCs and follicular fluid were detected by RT-qPCR, Western blotting, or ELISA. The KGN cells were treated with follicle supernatant mixed with normal medium to simulate the microenvironment of GCs in PCOS patients, and the inflammation indicators were observed. The assembly of NLRP3 inflammasomes was detected by immunofluorescence techniques. Dihydroethidium assay and EdU proliferation assay were used to detect ROS and cell proliferation by flow cytometry.

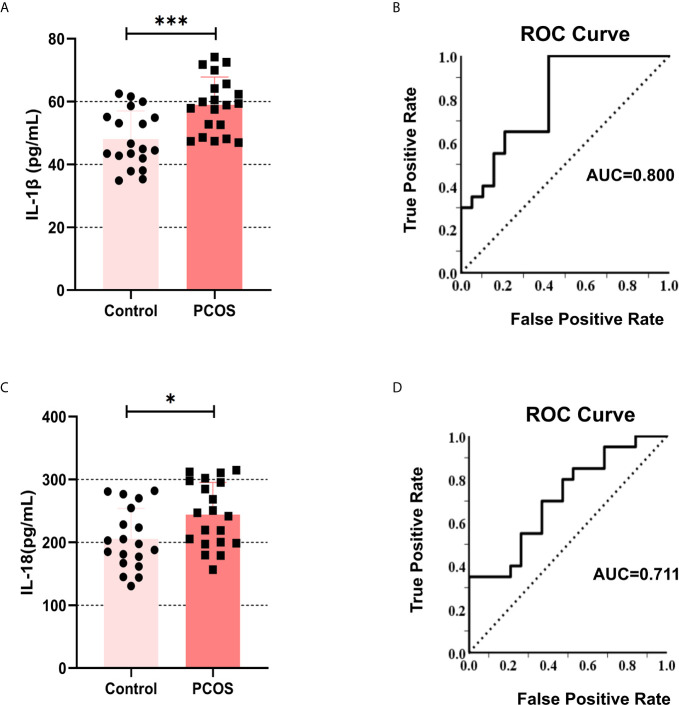
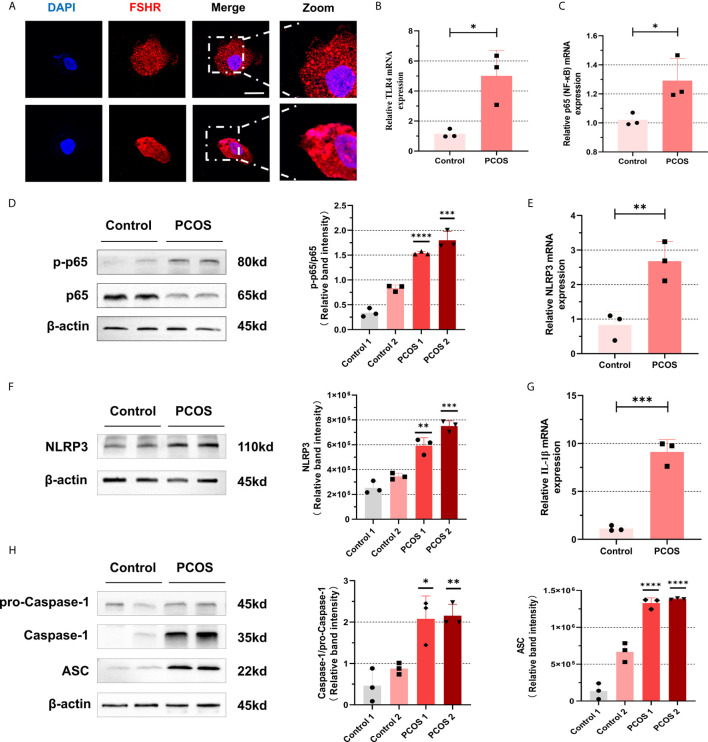
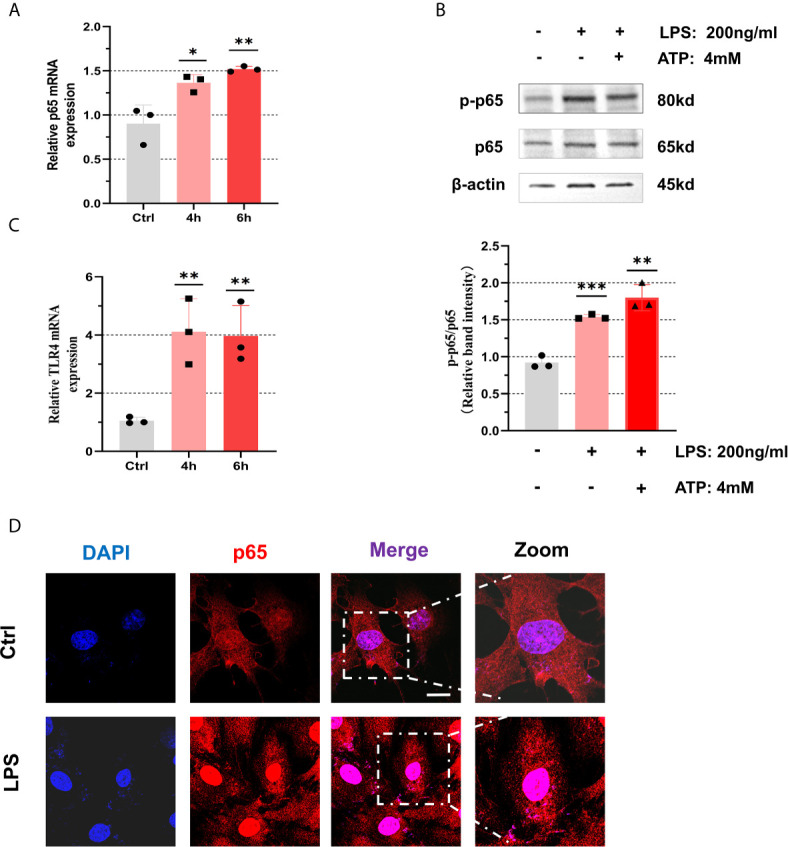
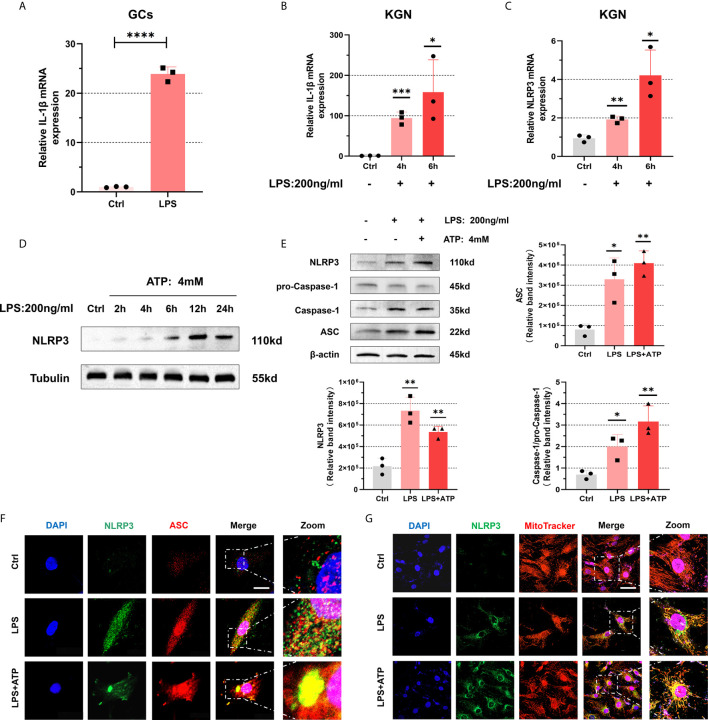
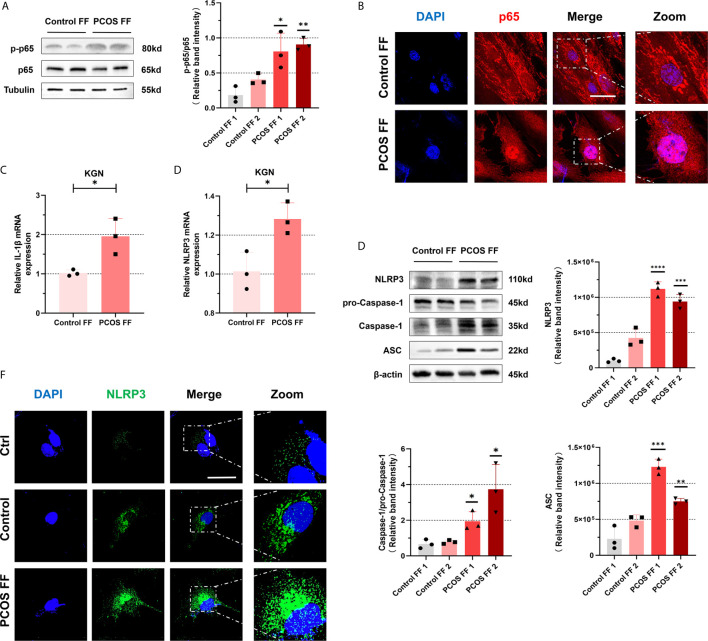
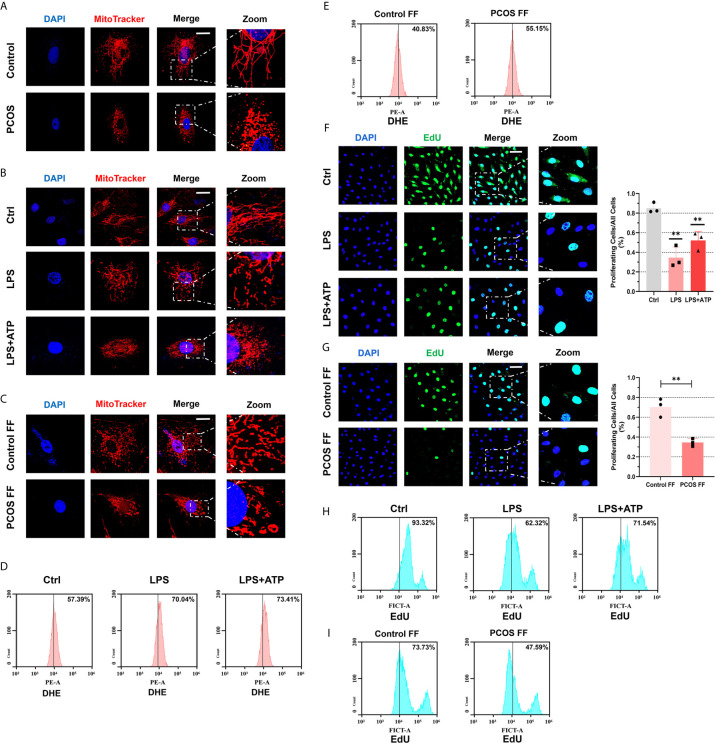
Results: Compared with normal controls (n = 19), IL-1β (P = 0.0005) and IL-18 (P = 0.021) in the follicular fluid of PCOS patients (n = 20) were significantly increased. The NF-κB pathway was activated, and NLRP3 inflammasome was formatted in ovarian GCs of PCOS patients. We also found that inflammation of KGN cells was activated with LPS irritation or stimulated by follicular fluid from PCOS patients. Finally, we found that intracellular inflammation process damaged mitochondrial structure and function, which induced oxidative stress, affected cellular metabolism, and impaired cell proliferation.

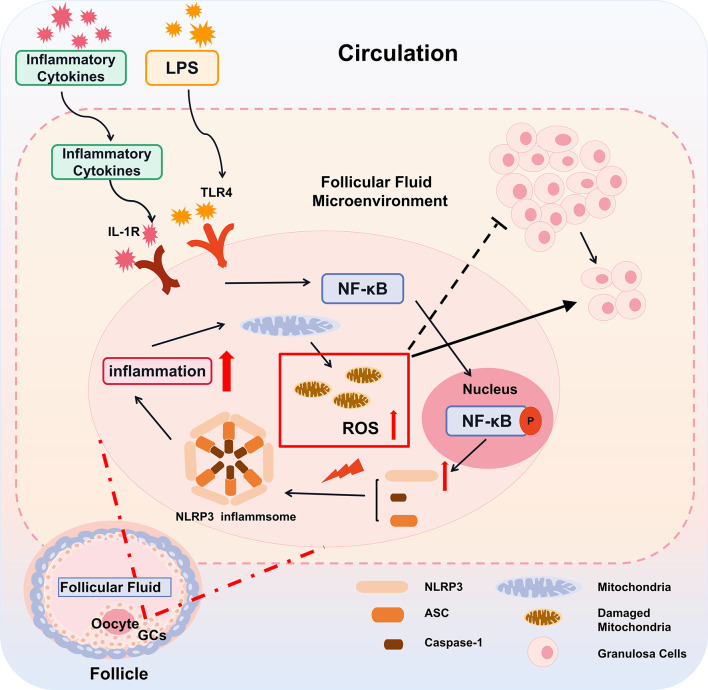
Conclusion: Inflammatory microenvironment alteration in the follicular fluid of PCOS patients leads to activated inflammatory pathway in GCs, serving as a crucial factor that causes adverse symptoms in patients. This study provides a novel mechanism in the inflammatory process of PCOS.

Keywords: NF-κB; NLRP3 inflammasomes; follicular fluid (FF); granulosa cells (GCs); microenvironment; polycystic ovary syndrome (PCOS).


Conflict of interest statement

The authors declare that the research was conducted in the absence of any commercial or financial relationships that could be construed as a potential conflict of interest.

Figures

Figure 1
Figure 1
The levels of IL-1β and IL-18 increased in the follicular fluid of the PCOS patients. (A) The content of IL-1β in follicular fluid in PCOS patients and controls were measured by ELISA (P = 0.0005). (B) ROC analysis for the regression between levels of IL-1β and PCOS diagnosis, AUC = 0.800. (C) The content of IL-18 in follicular fluid in PCOS patients and controls were measured by ELISA (P = 0.021). (D) ROC analysis for the regression between levels of IL-18 and PCOS diagnosis, AUC = 0.711. *P < 0.05 and ***P < 0.001. *P < 0.05 was considered statistically significant.
Figure 2
Figure 2
NF-κB pathway activation and NLRP3 inflammasomes formation were promoted in ovarian granulosa cells from PCOS patients. (A) Identification of GCs in primary cells extracted from ovaries of PCOS patients and controls by immunofluorescence assays. (FSHR, red; DAPI, blue; scale bar, 20 μm). (B) The mRNA levels of TLR4 between PCOS patients and controls in GCs were measured by RT-qPCR assays (P = 0.0184). (C) The mRNA levels of p65 between PCOS patients and controls in GCs were measured by RT-qPCR assays (P = 0.0292). (D) The phosphorylation levels of p65 were measured by western blotting assays. (E) The mRNA levels of NLRP3 in GCs in PCOS patients and controls were measured by RT-qPCR assays (P = 0.0096). (F) NLRP3 protein levels in GCs in PCOS patients and controls by western blotting assays. (G) The mRNA levels of IL-1β from PCOS patients and controls by RT-qPCR assays (P = 0.0005). (H) The levels of NLRP3 inflammasome-related proteins (ASC, pro-caspase-1, and caspase-1) were measured by western blotting assays. *P < 0.05, **P < 0.01, ***P < 0.001 and ****P < 0.0001. *P < 0.05 was considered statistically significant.
Figure 3
Figure 3
NF-κB pathway was activated with treatment of LPS in the KGN cells. (A) After treatment with LPS (200 ng/mL) for 4 h or 6 h, the relative expression of p65 was measured by RT-qPCR (4 h: P = 0.0257, 6 h: P = 0.0074). (B) The phosphorylation levels of p65 in KGN cells with the treatment of LPS (200 ng/mL) for 6 h and ATP (4 mM) for 50 min. (C) After treatment with LPS (200 ng/mL) for 4 h or 6 h, the relative expression of TLR4 was measured by RT-qPCR (4 h: P = 0.0096, 6 h: P = 0.0086). (D) The localization of p65 in KGN cells with LPS (200 ng/mL) stimulation for 3 h by immunofluorescent assays (p65, red; DAPI, blue; scale bar, 20 μm). *P < 0.05, **P < 0.01 and ***P < 0.001. *P < 0.05 was considered statistically significant.
Figure 4
Figure 4
NLRP3 inflammasomes were activated in KGN cells with LPS stimulation. (A) The mRNA level of IL-1β in primary human GCs treated with LPS (200 ng/mL) for 4 h was measured by RT-qPCR assays (P < 0.0001). (B) With LPS stimulation (200 ng/mL) in KGN cells, IL-1β mRNA levels were detected by RT-qPCR assays (4 h: P = 0.0004, 6 h: P = 0.0271). (C) The mRNA level of NLRP3 in KGN cells stimulated with LPS (200 ng/mL) (4 h: P = 0.0024, 6 h: P = 0.0131). (D) NLRP3 protein levels in KGN cells with LPS treatment (200 ng/mL) for 2, 4, 6, 12, and 24 h. (E) The protein levels of NLRP3, ASC, pro-Caspase-1, and Caspase-1 in KGN cells were treated with LPS (200 ng/mL) for 12 h and ATP (4 mM) for 50 min. (F) Immunofluorescent staining for co-localization of NLRP3 with ASC in KGN cells with LPS treatment (200 ng/mL) for 3 h and ATP (4 mM) for 50 min. (NLRP3, green; ASC, red; DAPI, blue; scale bar, 20μm). (G) Immunofluorescent staining for co-localization of NLRP3 with mitochondria in the KGN cells with LPS stimulation (200 ng/mL) for 3 h and ATP (4 mM) for 50 min (NLRP3, green; MitoTracker indicated mitochondria, red; DAPI, blue; scale bar, 100μm). *P < 0.05, **P < 0.01, ***P < 0.001 and ****P < 0.0001. *P < 0.05 was considered statistically significant.
Figure 5
Figure 5
NF-κB pathway and NLRP3 inflammasomes in KGN cells were activated by stimulation of with follicular fluid from PCOS patients. (A) With treatment of follicular fluid in KGN cells of PCOS patients and controls for 3 h, the phosphorylation levels of p65 were measured by western blotting assays. (B) The localization of p65 in KGN cells with follicular fluid treatment of PCOS patients and controls for 3 h by immunofluorescent assays. (p65, red; DAPI, blue; scale bar, 50 μm). (C) The KGN cells were treated with follicular fluid of PCOS patients and controls for 3 h, and IL-1β mRNA levels were measured by RT-qPCR (P = 0.0097). (D) The mRNA level of NLRP3 was detected in KGN cells with treatment of follicular fluid of PCOS patients and controls for 3 h (P = 0.0011). (E) NLRP3 inflammasome-related proteins (NLRP3, ASC, pro-Caspase-1, and Caspase-1) were measured by western blotting assays. (F) With treatment of follicular fluid of PCOS patients and controls for 3 h, the localization of NLRP3 in KGN cells is measured by immunofluorescent assays (NLRP3, green; DAPI, blue; scale bar, 50 μm). *P < 0.05, **P < 0.01, ***P < 0.001 and ****P < 0.0001. *P < 0.05 was considered statistically significant.
Figure 6
Figure 6
Follicular fluid from PCOS patients and LPS impaired mitochondria structure and function, caused oxidative stress, and arrested cellular proliferation. (A) Immunofluorescence imaging of mitochondria in GCs from PCOS patients and controls (MitoTracker, red; DAPI, blue; scale bar, 20 μm). (B) Immunofluorescence imaging of mitochondrial morphology in KGN cells with LPS stimulation (200 ng/mL) for 3 h and ATP (4 mM) for 50 min (MitoTracker indicated mitochondria, red; DAPI, blue; scale bar, 20 μm). (C) Immunofluorescence imaging of mitochondrial morphology in KGN cells incubated with follicular fluid for 3 h (MitoTracker indicated mitochondria, red; DAPI, blue; scale bar, 20 μm). (D) After DHE staining, flow cytometry assays were used to detect ROS levels in KGN cells with LPS (200 ng/mL) treatment for 3 h and ATP (4 mM) for 50 min. (E) After DHE staining, flow cytometry assays were used to detect ROS levels in KGN cells with follicular fluid stimulation for 3 h. (F) Immunofluorescence imaging of EdU to indicate the KGN cells proliferation with LPS (200 ng/mL) treatment for 3 h and ATP (4 mM) for 50 min (EdU, green; DAPI, blue; scale bar, 50 μm). (G) Immunofluorescence imaging of EdU to indicate the KGN cells proliferation with follicular fluid treatment for 3 h (EdU, green; DAPI, blue; scale bar, 50 μm). (H) With EdU staining, flow cytometry assays were used to detect fluorescence in KGN cells with LPS (200 ng/mL) stimulation for 3 h and ATP (4 mM) for 50 min treatment. (I) After EdU staining, flow cytometry assays were used to detect fluorescence in KGN cells with treatment of follicular fluid for 3 h. **P < 0.01. *P < 0.05 was considered statistically significant.
Figure 7
Figure 7
A proposed model for inflammatory cascade in ovarian granulosa cells with PCOS. The inflammatory cytokines derived from the peripheral circulation enter into the follicles through the ovarian circulation system. Subsequently, by the IL-1R and TLR4 on the GCs, the inflammatory cytokines in follicular fluid alternate follicular microenvironment, resulting in the activation of nuclear factors NF-κB and its transfer into the nucleus. Activated NF-κB promotes the gene expression of key components of the NLRP3 inflammasome. Under the stress of mitochondrial ROS, these key components including NLRP3, ASC, caspase-1 assemble, promote the cleavage of IL-1β and amplify the inflammatory cascade. The inflammatory cascade further damage mitochondria, which aggravates the generation of mitoROS and forms a vicious circle. Thereby, the alternation of the follicular microenvironment affects the function of GCs and leads to slowing down of cell proliferation, ultimately affecting the growth and development of oocytes.

Similar articles

Cited by

References

    1. Azziz R, Woods KS, Reyna R, Key TJ, Knochenhauer ES, Yildiz BO. The Prevalence and Features of the Polycystic Ovary Syndrome in an Unselected Population. J Clin Endocrinol Metab (2004) 89(6):2745–9. 10.1210/jc.2003-032046 - DOI - PubMed
    1. Escobar-Morreale HF. Polycystic Ovary Syndrome: Definition, Aetiology, Diagnosis and Treatment. Nat Rev Endocrinol (2018) 14(5):270–84. 10.1038/nrendo.2018.24 - DOI - PubMed
    1. Revised 2003 Consensus on Diagnostic Criteria and Long-Term Health Risks Related to Polycystic Ovary Syndrome. Fertil Steril (2004) 81(1):19–25. 10.1016/j.fertnstert.2003.10.004 - DOI - PubMed
    1. Hu C, Pang B, Ma Z, Yi H. Immunophenotypic Profiles in Polycystic Ovary Syndrome. Mediat Inflamm (2020) 2020:1–10. 10.1155/2020/5894768 - DOI - PMC - PubMed
    1. Gonzalez F. Inflammation in Polycystic Ovary Syndrome: Underpinning of Insulin Resistance and Ovarian Dysfunction. Steroids (2012) 77(4):300–5. 10.1016/j.steroids.2011.12.003 - DOI - PMC - PubMed

Publication types