. 2021 Jul 5;218(7):e20210223.
doi: 10.1084/jem.20210223. Epub 2021 May 25.

Aged hematopoietic stem cells are refractory to bloodborne systemic rejuvenation interventions

Affiliations

Aged hematopoietic stem cells are refractory to bloodborne systemic rejuvenation interventions

Theodore T Ho et al. J Exp Med. .

Abstract

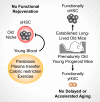
While young blood can restore many aged tissues, its effects on the aged blood system itself and old hematopoietic stem cells (HSCs) have not been determined. Here, we used transplantation, parabiosis, plasma transfer, exercise, calorie restriction, and aging mutant mice to understand the effects of age-regulated systemic factors on HSCs and their bone marrow (BM) niche. We found that neither exposure to young blood, nor long-term residence in young niches after parabiont separation, nor direct heterochronic transplantation had any observable rejuvenating effects on old HSCs. Likewise, exercise and calorie restriction did not improve old HSC function, nor old BM niches. Conversely, young HSCs were not affected by systemic pro-aging conditions, and HSC function was not impacted by mutations influencing organismal aging in established long-lived or progeroid genetic models. Therefore, the blood system that carries factors with either rejuvenating or pro-aging properties for many other tissues is itself refractory to those factors.


Conflict of interest statement

Disclosures: E.V. Verovskaya is currently an employee of Thermo Fisher Scientific. No other disclosures were reported.

Figures
None
Graphical abstract
Figure 1.
Figure 1.
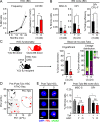
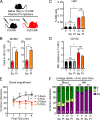
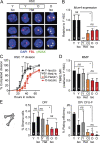
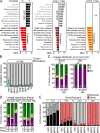
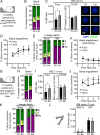
The stress of transplantation precludes improvement of old HSC function by young niches. (A) Kinetics of HSC expansion and CD150 levels with age. Expansion results are means from five pooled mice per age group with confidence interval derived from another 6–11 mice analyzed individually at 3, 18, and 24 mo. CD150 results are a compilation of all control young and old HSCs used in this study. (B) Age-associated BM niche deterioration in young and old mice with frequency of endosteal MSC-S and both frequency and CFU-F activity of their OPr derivatives. Results are a compilation of all control young and old mice used in this study. (C) Regenerative ability of 250 young or old B6 donor HSCs transplanted (Tplx) into lethally irradiated young BJ recipient mice with experimental setup (left), donor chimerism (middle), and lineage distribution (right) at 4 mo after transplantation in peripheral blood. (D) Principal component (PC) analysis of ATAC-seq data for paired samples of young and old HSCs before (Pre-Tplx) and 3 mo after transplantation (Post-Tplx). (E) γH2AX/FBL immunofluorescence staining in post-transplantation (4 mo) young and old HSCs. Scale bar, 10 µm. (F) Frequency of MSC-S and OPr in post-transplantation (4 mo) BJ recipient mice engrafted with young or old HSCs. Levels for those populations in non-irradiated and non-transplanted young BJ mice are shown in gray. MFI, mean fluorescence intensity. Data are means ± SD except when indicated; *, P ≤ 0.05; **, P ≤ 0.01; ***, P ≤ 0.001.
Figure S1.
Figure S1.
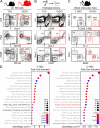
Gating strategies and ATAC-seq results for young and old HSC transplantations. (A) Gating strategy for BM analyses in young (Y, 3 mo old) and old (O, 24 mo old) mice. MPP2 and MPP3, myeloid-biased MPP; MPP4, lymphoid-biased MPP; GMP, granulocyte/macrophage progenitor. (B) Preparation and gating strategy for endosteal BM niche populations. EC, endothelial cell. (C) Gating strategy for peripheral blood chimerism analyses. Results are shown at 4 mo after transplantation. My, myeloid; B, B cells; T, T cells. (D) Top 20 pathways enriched in differentially accessible peaks at promoters (±1 kb from TSS) in post-transplantation vs. pre-transplantation young (left) and old (right) HSC samples. Gray indicates common pathways and black/red refers to pathways specific to each population.
Figure 2.
Figure 2.
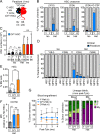
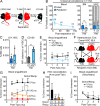
Crossover features of heterochronic parabiosis pairs. (A) Crossover scheme to track the percentage of B6 cells in BJ parabionts or BJ cells in B6 parabionts. (B) Blood (left), BM (middle), and HSC (right) crossover in indicated mice. (C) Complete blood count (CBC) analyses in indicated mice. WBC, white blood cells; Neut., neutrophils; Lymph., lymphocytes. (D) Lineage distribution analyses in the blood of indicated mice. (E) Crossover scheme to track the percentage of B6 GFP+ cells in young and old B6 parabionts. (F) Blood (left), BM (middle), and HSC (right) crossover in the indicated mice. Data are means ± SD; *, P ≤ 0.05.
Figure 3.
Figure 3.
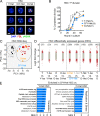
Exposure to young blood in heterochronic parabiosis mice does not functionally rejuvenate old HSCs. (A) Experimental setup for the (3/24) parabiosis cohorts. Survival results after surgery are shown in Fig. S2 A. (B) Representative images (left) and quantification of MCM2- and DCX-positive cells (right) in the DG of O-Iso and O-Het parabionts. (C) HSC frequency in indicated mice. Age-matched non-parabiosed young (Y) and old (O) controls are included for comparison. (D) CD150 mean fluorescence intensity (MFI) levels for the indicated HSC populations. (E) Regenerative capacity for the indicated HSC populations following transplantation into lethally irradiated recipients (250 HSCs/recipient). Results show overall engraftment in the peripheral blood over time. (F) Lineage distribution for the indicated HSC populations at 4 mo after transplantation in blood (right) and BM (left). Data are means ± SD; *, P ≤ 0.05; **, P ≤ 0.01; ***, P ≤ 0.001.
Figure S2.
Figure S2.
Additional characterization of (3/24) and (3/18) parabiosis cohorts. (A) Postsurgery survival in the (3/18) and (3/24) parabiosis cohorts. Results represent the number of surviving pairs out of the total number of pairs established for each group in the three independent cohorts performed at each age range. (B–E) Analyses of young controls and (3/18) parabiosis pairs with (B) frequency, (C) CD150 level, (D) regenerative capacity (250 donor HSCs/recipient), and (E) lineage distribution at 4 mo after transplantation for the indicated HSC populations. MFI, mean fluorescence intensity. Data are means ± SD; *, P ≤ 0.05; **, P ≤ 0.01; ***, P ≤ 0.001.
Figure S3.
Figure S3.
Inflammation in parabiosis cohorts. (A) Luminex-based cytokine analyses of serum and BM fluid from the indicated 3-mo-old young controls and Y/Y-Iso pairs from the (3/24) parabiosis cohorts. nd, not detected. (B) Luminex-based cytokine analyses of the BM fluid of the indicated 3-mo-old young controls and Y/O-Het pairs from an independent (6/23) parabiosis cohort. Data are means ± SD; *, P ≤ 0.05; **, P ≤ 0.01; ***, P ≤ 0.001.
Figure 4.
Figure 4.
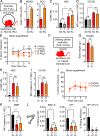
Injection of young plasma does not functionally rejuvenate old HSCs. (A) Experimental setup for the saline (Sa) or young plasma (Pl) injection experiments in young and old mice. (B) Quantification of MCM2- and DCX-positive cells in the DG of old saline- or plasma-injected mice. (C) HSC frequency in indicated mice. Uninjected Y controls are included for comparison. (D) CD150 mean fluorescence intensity (MFI) levels for the indicated HSC populations. (E) Regenerative capacity for the indicated HSC populations following transplantation into lethally irradiated recipients (250 HSCs/recipient). Results show overall engraftment in the peripheral blood over time. (F) Lineage distribution for the indicated HSC populations at 4 mo after transplantation in blood (right) and BM (left). Data are means ± SD; *, P ≤ 0.05; **, P ≤ 0.01.
Figure 5.
Figure 5.
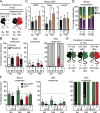
Exposure to young blood fails to reverse molecular hallmarks of aging in HSCs and the BM niche. (A–C) Age-associated replication stress features in (3/24) parabiosis cohorts with (A) γH2AX/FBL immunofluorescence staining (scale bar, 10 µm), (B) Mcm4 mRNA expression levels, and (C) single-cell division kinetics (n = cells) for the indicated HSC populations. nd, not determined. (D) Age-associated mitochondrial dysfunction in (3/24) parabiosis cohorts. MMP results are expressed as relative mean fluorescence intensity (MFI) of tetramethylrhodamine-ethyl-ester (TMRE) staining for the indicated HSC populations. Experiments performed on different days were normalized to 1 for each internal Y HSC control, and then averaged together. (E) Age-associated BM niche cell deterioration in (3/24) parabiosis cohorts with frequency and colony forming activity of endosteal OPrs in the indicated mice. Data are means ± SD; *, P ≤ 0.05.
Figure 6.
Figure 6.
Migration to young BM niches does not functionally rejuvenate old HSCs. (A) Experimental setup for the analyses of old HSCs homed into Y-Het mice (O/Y HSCs) in the (3/24) cohorts and analyzed after 1 mo of parabiosis. (B) Frequency of HSC crossover in the indicated parabiosis cohorts. Of note, three Het pairs were initially injected with G-CSF. (C) Total numbers of HSCs showing both host and crossover O/Y HSCs. (D) Percentage of crossover in the HSC/MPP compartments of indicated mice. (E) HSC frequency in indicated mice. (F) CD150 mean fluorescence intensity (MFI) levels for the indicated HSC populations. (G) Regenerative capacity following transplantation in lethally irradiated recipients (250 HSCs/recipient) showing overall engraftment in the peripheral blood over time (left) and lineage distribution at 4 mo after transplantation in blood and BM (left) for the indicated HSC populations. Data are means ± SD; *, P ≤ 0.05; **, P ≤ 0.01; ***, P ≤ 0.001. HSC crossover data in B and D are part of Fig. 2, B and F, and are shown for comparison.
Figure 7.
Figure 7.
Unchanged aging phenotypes and altered transcriptome of old HSCs relocated into young BM niches. (A) γH2AX/FBL immunofluorescence staining for the indicated HSC populations. Scale bar, 10 µm. (B) Single-cell division kinetics (n = cells) for the indicated HSC populations. (C) Principal component (PC) analysis of RNA sequencing data for young and old control HSCs and HSCs isolated from the indicated parabiosed pairs. (D) Number of DEGs with log2 fold change greater than or equal to 1 or less than or equal to −1 and FDR < 0.05 for the indicated comparisons. (E) Gene-set enrichment analyses of O/Y-Het HSCs compared with either Y-Het HSCs (left) or O-Het HSCs (right). Bold highlights pathways commonly found enriched in old HSCs in Fig. S4 A. NES, normalized enrichment score with FDR–adjusted P values. Data are means ± SD; *, P ≤ 0.05; **, P ≤ 0.01; ***, P ≤ 0.001. Y-Het and O-Het HSC results in A and B are from Fig. 5 and are shown for comparison. SRP, signal recognition particle; UTR, untranslated region.
Figure S4.
Figure S4.
Gene expression signatures of young and old HSCs and further characterization of transplanted mice. (A) RNA sequencing analyses of HSCs isolated from young and old controls and (3/24) pairs with gene-set enrichment analyses showing the top 10 differentially expressed pathways in the indicated comparisons. Gray indicates pathways enriched in Y HSCs and black in O HSCs, with bold highlighting common pathways. NES, normalized enrichment score with FDR–adjusted P values. (B) Percentage of old B6 BM cells in the indicated populations in young BJ Het parabionts 4.5 mo after separation. CMP, common myeloid progenitor; GMP, granulocyte/macrophage progenitor; MEP, megakaryocyte/erythrocyte progenitor. (C) Lineage distribution at 4 mo after transplantation in blood (left) and BM (right) for the parabiosis separation transplantation experiment shown in Fig. 8 E. (D) Lineage distribution in blood at 2 mo (left) and 4 mo (right) after transplantation for the heterochronic transplantation experiment shown in Fig. 8 G. O/O samples were excluded from this analysis due to failed engraftment. (E) Donor chimerism in HSC/MPP compartments after heterochronic transplantations. SRP, signal recognition particle; UTR, untranslated region. Data are means ± SD; *, P ≤ 0.05; **, P ≤ 0.01; ***, P ≤ 0.001.
Figure 8.
Figure 8.
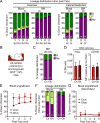
Old HSC states persist after long-term residence in young BM niches. (A–E) Age-associated phenotypes of old HSCs residing in separated Y Het mice (sO/Y HSCs) with (A) experimental setup for postparabiosis separation (3/24 cohorts); (B) frequency of crossover over time in blood (left), BM (middle), and HSC (right) compartment at the time of separation (Y-Het) and 4.5 mo afterward (sY-Het); (C) O/Y HSC BM frequency before and after separation; and (D) CD150 levels and (E) regenerative capacity following transplantation into lethally irradiated recipients (250 HSCs/recipient) for the indicated HSC populations. Both sY-Het HSCs and sO/Y-Het HSCs were isolated from individual sY-Het donor mice and transplanted into two to three recipients each. Y HSCs were isolated from two pooled young donor mice and transplanted into three recipients. (F–I) Heterochronic transplantation of 2,000 young or old BJ HSCs into sublethally irradiated young or old B6 recipients (recip.) with (F) experimental setup; (G) blood engraftment over time; (H) BM HSC chimerism at 4 mo after transplantation; and (I) regenerative capacity following transplantation into lethally irradiated secondary recipients (500 HSCs/recipient) for the indicated HSC populations. Data are means ± SD; *, P ≤ 0.05; **, P ≤ 0.01; ***, P ≤ 0.001.
Figure 9.
Figure 9.
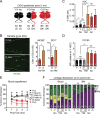
Known longevity-promoting interventions also fail to rejuvenate old HSCs. (A–E) Effect of exercise on HSCs isolated from young and old sedentary (Sd) or runner (Ru) mice with (A) experimental setup; (B) neurogenesis quantification in the DG of old sedentary or runner mice; and (C) frequency, (D) CD150 levels, and (E) regenerative capacity following transplantation into lethally irradiated recipients (500 HSCs/recipient) for the indicated HSC populations. (F–L) Effects of lifelong calorie restriction on HSCs isolated from old mice fed ad libitum (Al) or calorie restricted (Cr) compared with young controls with (F) experimental setup; (G) weights of the animals; (H) frequency, (I) CD150 levels, (J) regenerative capacity following transplantation into lethally irradiated recipients (500 HSCs/recipient), and (K) MMP for the indicated HSC populations; and (L) frequency and colony-forming activity for the indicated endosteal BM niche populations. MFI, mean fluorescence intensity. Data are means ± SD; *, P ≤ 0.05; **, P ≤ 0.01; ***, P ≤ 0.001.
Figure S5.
Figure S5.
Additional characterization of rejuvenation interventions and aging mutant mice. (A) Lineage distribution at 4 mo after transplantation in both blood and BM for the exercise transplantation experiment shown in Fig. 9 E (left) and calorie restriction transplantation experiment shown in Fig. 9 J (right). (B–G) Analysis of 24-mo-old control (Cn) and long-lived Ghrh−/− mutant mice (Gh) with (B) experimental setup; (C) lineage distribution in the BM of primary animals; and (D) frequency and CD150 levels, (E) regenerative capacity (250 HSCs/recipient), and (F) lineage distribution in primary recipients; and (G) regenerative capacity (250 HSCs/recipient) in secondary transplantation for the indicated HSC populations. Data are means ± SD; *, P ≤ 0.05; **, P ≤ 0.01; ***, P ≤ 0.001.
Figure 10.
Figure 10.
Minimal pro-aging effects are observed in HSCs from progeroid mice. (A–F) Analysis of 3-mo-old control (Cn) and progeroid Lm mice with (A) experimental setup; (B) lineage distribution in the peripheral blood of primary animals; and (C) frequency, CD150 levels, and γH2AX immunofluorescence staining (scale bar, 10 µm), (D) regenerative capacity following transplantation into lethally irradiated primary recipients (250 HSCs/recipient), (E) lineage distribution in primary recipients, and (F) regenerative capacity following transplantation into lethally irradiated secondary recipients (500 HSCs/recipient) for the indicated HSC populations. (G–L) Analysis of 11-mo-old control (Cn) and progeroid Bubr1H/H (Bu) mice with (G) experimental setup; (H) lineage distribution in the peripheral blood of primary animals; (I) frequency and CD150 levels, (J) regenerative capacity following transplantation into lethally irradiated recipients (250 HSCs/recipient), and (K) lineage distribution of the indicated HSC populations; and (L) frequency of the indicated endosteal BM niche populations. MFI, mean fluorescence intensity. Data are means ± SD; *, P ≤ 0.05.

Similar articles

Cited by

References

    1. Abkowitz, J.L., Robinson A.E., Kale S., Long M.W., and Chen J.. 2003. Mobilization of hematopoietic stem cells during homeostasis and after cytokine exposure. Blood. 102:1249–1253. 10.1182/blood-2003-01-0318 - DOI - PubMed
    1. Anton, S., and Leeuwenburgh C.. 2013. Fasting or caloric restriction for healthy aging. Exp. Gerontol. 48:1003–1005. 10.1016/j.exger.2013.04.011 - DOI - PMC - PubMed
    1. Baker, D.J., Jeganathan K.B., Cameron J.D., Thompson M., Juneja S., Kopecka A., Kumar R., Jenkins R.B., de Groen P.C., Roche P., and van Deursen J.M.. 2004. BubR1 insufficiency causes early onset of aging-associated phenotypes and infertility in mice. Nat. Genet. 36:744–749. 10.1038/ng1382 - DOI - PubMed
    1. Beerman, I., and Rossi D.J.. 2015. Epigenetic control of stem cell potential during homeostasis, aging, and disease. Cell Stem Cell. 16:613–625. 10.1016/j.stem.2015.05.009 - DOI - PMC - PubMed
    1. Beerman, I., Bock C., Garrison B.S., Smith Z.D., Gu H., Meissner A., and Rossi D.J.. 2013. Proliferation-dependent alterations of the DNA methylation landscape underlie hematopoietic stem cell aging. Cell Stem Cell. 12:413–425. 10.1016/j.stem.2013.01.017 - DOI - PubMed

Publication types