. 2021 May 17;12(1):2858.
doi: 10.1038/s41467-021-23238-1.

Microfluidic platform accelerates tissue processing into single cells for molecular analysis and primary culture models

Affiliations

Microfluidic platform accelerates tissue processing into single cells for molecular analysis and primary culture models

Jeremy A Lombardo et al. Nat Commun. .

Abstract

Tissues are complex mixtures of different cell subtypes, and this diversity is increasingly characterized using high-throughput single cell analysis methods. However, these efforts are hindered, as tissues must first be dissociated into single cell suspensions using methods that are often inefficient, labor-intensive, highly variable, and potentially biased towards certain cell subtypes. Here, we present a microfluidic platform consisting of three tissue processing technologies that combine tissue digestion, disaggregation, and filtration. The platform is evaluated using a diverse array of tissues. For kidney and mammary tumor, microfluidic processing produces 2.5-fold more single cells. Single cell RNA sequencing further reveals that endothelial cells, fibroblasts, and basal epithelium are enriched without affecting stress response. For liver and heart, processing time is dramatically reduced. We also demonstrate that recovery of cells from the system at periodic intervals during processing increases hepatocyte and cardiomyocyte numbers, as well as increases reproducibility from batch-to-batch for all tissues.


Conflict of interest statement

J. B. H. is a co-founder of Kino Discovery, which is in the process of licensing intellectual property for the tissue processing devices. The other authors declare no competing interests.

Figures

Fig. 1
Fig. 1. Microfluidic tissue processing platform.
a Schematic of the minced tissue digestion device. Design includes six total layers, including two fluidic layers (green), 2 via layers (red), and the top and bottom end caps (gray). Tissue is loaded through the luer port and into the tissue chamber. b Schematic of the tissue chamber. Fluidic channels direct hydrodynamic shear forces and proteolytic enzymes, while also retaining minced tissue pieces in the chamber. c Schematic of the integrated dissociation/filter device. Tissue fragments and cell aggregates from the digestion device will be further broken down by hydrodynamic shear forces and nylon mesh filters. d Pictures of the fabricated minced digestion device. e Picture of the fabricated dissociation/filter device.
Fig. 2
Fig. 2. Device optimization using murine kidney.
a Kidneys (n = 3 to 9 independent samples) were harvested, minced, and processed using the minced digestion device at 10 or 20 mL/min flow rate for 15 or 60 min, and total genomic DNA (gDNA) was quantified. gDNA was extracted directly from the control, and thus this represents maximum recovery. Results at 20 mL/min flow rate were superior, particularly at the shorter time point. b Pictures of tissue within the minced digestion device chamber before and after 15 or 60 min of processing at 10 (i) or 20 (ii) mL/min flow rate. Significant tissue remained at 10 mL/min, while tissue was largely absent at 20 mL/min. c Single EpCAM+ epithelial cells were quantified by flow cytometry after samples (n = 3) were processed with the minced digestion device for 15, 30, or 60 min. We also evaluated recovery of sample at different time intervals, with more collagenase added to continue processing of remaining tissue. d Epithelial cell viability was ~80% for all control and device conditions (n = 3). e Samples (n = 3) were processed with the integrated dissociation/filter device following 15 min of digestion device treatment. A single pass through the integrated device produced optimal results. f Epithelial cell viability was at ~85–90% for all conditions (n = 3). Data are presented as mean values ± SEM from at least three independent experiments. Circles indicate values for experimental replicates. For the stacked plot, experimental replicates are indicated by circles at 15 min, squares at 30 min, and triangles at 60 min. Two-sided T test was used for statistical testing. Stars indicate p < 0.05 and double stars indicate p < 0.01 relative to the control at the same digestion time. p values for all comparisons are presented in the Source Data file.
Fig. 3
Fig. 3. Microfluidic platform results for murine kidney.
Kidneys (n = 4 independent samples) were harvested, minced, processed with the digestion device for 15 or 60 min, passed through the integrated dissociation/filtration device one time, and resulting cell suspensions were analyzed using flow cytometry. We also evaluated interval recovery at 1, 15, and 60 min time points from the same tissue sample. Controls were minced, digested for either 15 or 60 min, pipetted/vortexed, and passed through a cell strainer. a Single EpCAM+ epithelial cells increased by 2.5-fold with microfluidic processing. Interval results were comparable to static, and the 1 min interval produced comparable cell numbers to the 15 min control. Trends were similar for b endothelial cells and c leukocytes. Microfluidic processing was particularly effective for endothelial cells, yielding >5-fold more cells than the control at 60 min. d Population distributions obtained for each processing condition. Endothelial cells were enriched for all device conditions except the 1 min interval relative to controls. Data are presented as mean values ± SEM from at least three independent experiments. Circles indicate values for experimental replicates. For stacked plots, experimental replicates are indicated by circles at 15 min, squares at 30 min, and triangles at 60 min. Two-sided T test was used for statistical testing. Stars indicate p < 0.05 and double stars indicate p < 0.01 relative to the control at the same digestion time. p values for all comparisons are presented in the Source Data file.
Fig. 4
Fig. 4. scRNA-seq of murine kidney (n = 1).
Cell suspensions obtained from the microfluidic platform at 15 and 60 min intervals, as well as the 60 min control, were sorted by FACS to remove dead cells and debris, loaded onto a 10X Chromium chip, and sequenced at >50,000 reads/cell. a UMAP displaying seven cell clusters that correspond to two different proximal tubule subtypes, endothelial cells, macrophages, B lymphocytes, and T lymphocytes. The seventh cluster contained a mixed population corresponding to distal convoluted tubules (DCT), loop of Henle (LOH), collecting duct (CD), and mesangial cells (MC). b Population distributions for each cell cluster and processing condition. Proximal tubules were predominantly eluted from the microfluidic platform in the 15 min interval, while endothelial cells and macrophages were enriched in the 60 min interval. c Stress response scores, displayed in violin plots, were generally lower for the 15 min device interval. Horizontal line depicts median and edges of box depict 1st and 3rd quartiles.
Fig. 5
Fig. 5. Microfluidic platform results for murine breast tumor.
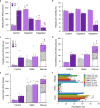
Breast tumors from MMTV-PyMT mice (n = 6) were resected, minced, processed with the microfluidic platform, and analyzed by flow cytometry. a EpCAM+ epithelial cells were ~2-fold higher at both time points. b Endothelial cells were enhanced even more by the microfluidic platform, with five- and ten-fold more cells recovered after 15 and 60 min, respectively. c Leukocytes increased by three- and five-fold after 15 and 60 min, respectively. The interval format produced similar total cell numbers relative to the corresponding static time point, except for endothelial cells, which were slightly higher. d Population distributions obtained for each processing condition. Device processing enriched both endothelial cells and leukocytes at all but the 1 min time point. Data are presented as mean values ± SEM from at least three independent experiments. Circles indicate values for experimental replicates. For stacked plots, experimental replicates are indicated by circles at 15 min, squares at 30 min, and triangles at 60 min. Two-sided T test was used for statistical testing. Stars indicate p < 0.05 and double stars indicate p < 0.01 relative to the control at the same digestion time. p values for all comparisons are presented in the Source Data file.
Fig. 6
Fig. 6. scRNA-seq of murine mammary tumor (n = 1).
Cell suspensions obtained from the microfluidic platform at 15 and 60 min intervals, as well as the 60 min control, were processed and analyzed using similar methods to kidney. a UMAP displaying six cell clusters that correspond to epithelial cells, macrophages, endothelial cells, T lymphocytes, fibroblasts, and granulocytes. b Population distributions for each cell cluster and processing condition. Epithelial cells were predominantly eluted from the microfluidic platform in the 15 min interval, while endothelial cells and fibroblasts were enriched in the 60 min interval. Fibroblasts were enriched in both platform conditions, while granulocytes were depleted. c Stress response scores, displayed in violin plots, were generally similar across conditions and cell types. Horizontal line depicts median and edges of box depict 1st and 3rd quartiles.
Fig. 7
Fig. 7. Microfluidic platform results for murine liver.
a, b Liver (n = 3 or 4 independent samples) was harvested, minced, and evaluated with the minced digestion device alone and in combination with the integrated dissociation/filter device. Hepatocytes were identified and quantified by flow cytometry. a The digestion device increased hepatocyte recovery by ~4-fold at 15 min, but continued digestion and passing through the integrated dissociation/filter device one time decreased hepatocyte yield, likely due to the large size and fragile nature of hepatocytes. b Hepatocyte viability was ~75–80% for all conditions, except the 60 min integrated condition. cf Results using shorter digestion times and a single pass with a dissociation/filtration device containing only the 50 µm filter. c After only 5 min of microfluidic processing, four-fold more cells were obtained than the 15 min control and only slightly less than the 60 min control. Interval recovery enhanced hepatocyte yield by ~2.5-fold relative to the 60 min control and 15 min static conditions. The 1 min interval contributed substantially, producing ~70% as many hepatocytes as the 60 min control. Similar results were observed for d endothelial cells and e leukocytes, although the benefit of intervals was less pronounced. f Population distributions obtained for each processing condition. Microfluidic processing generally enriched for leukocytes, although there was a shift to hepatocytes for the later intervals. Data are presented as mean values ± SEM from at least three independent experiments. Circles indicate values for experimental replicates. For stacked plots, experimental replicates are indicated by circles at 15 min, squares at 30 min, and triangles at 60 min. Two-sided T test was used for statistical testing. Stars indicate p < 0.05 and double stars indicate p < 0.01 relative to the 60 min control. Cross-hatches indicate p < 0.05 and double cross-hatches indicate p < 0.01 relative to the static condition at the same digestion time. p values for all comparisons are presented in the Source Data file.
Fig. 8
Fig. 8. Microfluidic platform results for murine heart.
Hearts (n = 5 to 8 independent samples) were resected, minced, processed with the microfluidic platform (both 50 and 15 µm membranes), and analyzed by flow cytometry. We employed shorter digestion device time points due to the sensitivity of cardiomyocytes. a Microfluidic processing produced ~12,000 cardiomyocytes per mg after 15 min, which was ~2-fold higher than the 60 min control. Interval recovery produced optimal results again, increasing by ~50% and ~3-fold relative to the 15 min static and 60 min control conditions. b Endothelial cell and c leukocyte yields were significantly lower than the 60 min control under both static and interval formats. Interval recovery did improve results, but remained ~2-fold lower than the 60 min controls. d Population distributions obtained for each processing condition. Microfluidic processing generally enriched for cardiomyocytes. Data are presented as mean values ± SEM from at least three independent experiments. Circles indicate values for experimental replicates. For stacked plots, experimental replicates are indicated by circles at 15 min, squares at 30 min, and triangles at 60 min. Two-sided T test was used for statistical testing. Stars indicate p < 0.05 and double stars indicate p < 0.01 relative to the 60 min control. Cross-hatches indicate p < 0.05 and double cross-hatches indicate p < 0.01 relative to the static condition at the same digestion time. p values for all comparisons are presented in the Source Data file.

Similar articles

Cited by

References

    1. Altschuler SJ, Wu LF. Cellular heterogeneity: do differences make a difference? Cell. 2010;141:559–563. doi: 10.1016/j.cell.2010.04.033. - DOI - PMC - PubMed
    1. Papalexi E, Satija R. Single-cell RNA sequencing to explore immune cell heterogeneity. Nat. Rev. Immunol. 2018;18:35–45. doi: 10.1038/nri.2017.76. - DOI - PubMed
    1. Nguyen QH, et al. Profiling human breast epithelial cells using single cell RNA sequencing identifies cell diversity. Nat. Commun. 2018;9:2028. doi: 10.1038/s41467-018-04334-1. - DOI - PMC - PubMed
    1. Park J, et al. Single-cell transcriptomics of the mouse kidney reveals potential cellular targets of kidney disease. Science. 2018;360:758–763. doi: 10.1126/science.aar2131. - DOI - PMC - PubMed
    1. MacParland SA, et al. Single cell RNA sequencing of human liver reveals distinct intrahepatic macrophage populations. Nat. Commun. 2018;9:4383. doi: 10.1038/s41467-018-06318-7. - DOI - PMC - PubMed

Publication types

MeSH terms