A Primer on RECIST 1.1 for Oncologic Imaging in Clinical Drug Trials
- PMID: 33988475
- PMCID: PMC8183261
- DOI: 10.1148/rycan.2021210008
A Primer on RECIST 1.1 for Oncologic Imaging in Clinical Drug Trials
Abstract
Drug discovery and approval in oncology is mediated by the use of imaging to evaluate drug efficacy in clinical trials. Imaging is performed while patients receive therapy to evaluate their response to treatment. Response criteria, specifically Response Evaluation Criteria in Solid Tumors version 1.1 (RECIST 1.1), are standardized and can be used at different time points to classify response into the categories of complete response, partial response, stable disease, or disease progression. At the trial level, categorical responses for all patients are summated into image-based trial endpoints. These outcome measures, including objective response rate (ORR) and progression-free survival (PFS), are characteristics that can be derived from imaging and can be used as surrogates for overall survival (OS). Similar to OS, ORR and PFS describe the efficacy of a drug. U.S. Food and Drug Administration (FDA) regulatory approval requires therapies to demonstrate direct evidence of clinical benefit, such as improved OS. However, multiple programs have been created to expedite drug approval for life-threatening illnesses, including advanced cancer. ORR and PFS have been accepted by the FDA as adequate predictors of OS on which to base drug approval decisions, thus substantially shortening the time and cost of drug development (1). Use of imaging surrogate markers for drug approval has become increasingly common, accounting for more than 90% of approvals through the Accelerated Approval Program and allowing for use of many therapies which have altered the course of cancer. Keywords: Oncology, Tumor Response RSNA, 2021.
Keywords: Oncology; Tumor Response.
Conflict of interest statement
Figures

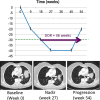
![Longitudinal response categorization. At each imaging time point, the patient will receive a single categorical response. When there is a partial treatment response (PR), the time point with the smallest tumor burden is the nadir (green arrow). Provided there are no changes in nontarget lesions and no new lesions, when the smallest tumor burden increases by more than 20% from nadir (or baseline [yellow arrow], if no nadir), this is the date of disease progression (PD) (red arrow). Lines on bottom images indicate tumor diameter.](https://cdn.ncbi.nlm.nih.gov/pmc/blobs/834e/8183261/d14b08b5d9dc/rycan.2021210008.fig2.gif)


Similar articles
-
Estimation of Study Time Reduction Using Surrogate End Points Rather Than Overall Survival in Oncology Clinical Trials.JAMA Intern Med. 2019 May 1;179(5):642-647. doi: 10.1001/jamainternmed.2018.8351. JAMA Intern Med. 2019. PMID: 30933235 Free PMC article.
-
Evaluation of objective response, disease control and progression-free survival as surrogate end-points for overall survival in anti-programmed death-1 and anti-programmed death ligand 1 trials.Eur J Cancer. 2019 Jan;106:1-11. doi: 10.1016/j.ejca.2018.10.011. Epub 2018 Nov 16. Eur J Cancer. 2019. PMID: 30453169
-
Relationship Between Progression-Free Survival, Objective Response Rate, and Overall Survival in Clinical Trials of PD-1/PD-L1 Immune Checkpoint Blockade: A Meta-Analysis.Clin Pharmacol Ther. 2020 Dec;108(6):1274-1288. doi: 10.1002/cpt.1956. Epub 2020 Jul 18. Clin Pharmacol Ther. 2020. PMID: 32564368 Free PMC article.
-
Trends in endpoint use in pivotal trials and efficacy for US Food and Drug Administration-approved solid tumor therapies, 1995-2021.J Manag Care Spec Pharm. 2022 Nov;28(11):1219-1223. doi: 10.18553/jmcp.2022.28.11.1219. J Manag Care Spec Pharm. 2022. PMID: 36282934 Free PMC article. Review.
-
Contemporary phase III clinical trial endpoints in advanced ovarian cancer: assessing the pros and cons of objective response rate, progression-free survival, and overall survival.Gynecol Oncol. 2015 Jan;136(1):121-9. doi: 10.1016/j.ygyno.2014.10.010. Epub 2014 Oct 24. Gynecol Oncol. 2015. PMID: 25455732 Review.
Cited by
-
Re-Induction of Avelumab for Patients with Metastatic Merkel Cell Carcinoma.Indian J Dermatol. 2023 Mar-Apr;68(2):234. doi: 10.4103/ijd.ijd_870_22. Indian J Dermatol. 2023. PMID: 37275807 Free PMC article. No abstract available.
-
Comparison of automated with manual 3D qEASL assessment based on MR imaging in hepatocellular carcinoma treated with conventional TACE.Abdom Radiol (NY). 2025 Mar;50(3):1180-1188. doi: 10.1007/s00261-024-04571-7. Epub 2024 Sep 19. Abdom Radiol (NY). 2025. PMID: 39297930 No abstract available.
-
Radiological Assessment of Different Retroperitoneal Lymph Node Measurements in Stage 1 Testicular Cancer Patients: Impact on Clinical Stage and Treatment.J Clin Med. 2024 Sep 19;13(18):5553. doi: 10.3390/jcm13185553. J Clin Med. 2024. PMID: 39337038 Free PMC article.
-
Twenty Years On: RECIST as a Biomarker of Response in Solid Tumours an EORTC Imaging Group - ESOI Joint Paper.Front Oncol. 2022 Jan 10;11:800547. doi: 10.3389/fonc.2021.800547. eCollection 2021. Front Oncol. 2022. PMID: 35083155 Free PMC article.
-
Circulating tumor DNA: Opportunities and challenges for pharmacometric approaches.Front Pharmacol. 2023 Mar 8;13:1058220. doi: 10.3389/fphar.2022.1058220. eCollection 2022. Front Pharmacol. 2023. PMID: 36968790 Free PMC article.
References
-
- Hsiue EHC, Moore TJ, Alexander GC. Estimated costs of pivotal trials for U.S. Food and Drug Administration-approved cancer drugs, 2015-2017. Clin Trials 2020;17(2):119–125. - PubMed
-
- Adams CP, Brantner VV. Spending on new drug development1. Health Econ 2010;19(2):130–141. - PubMed
-
- National Academies of Sciences, Engineering, and Medicine . The Drug Development Paradigm in Oncology: Proceedings of a Workshop. Washington, DC: The National Academies Press, 2018. - PubMed
-
- DiMasi JA. The value of improving the productivity of the drug development process: faster times and better decisions. Pharmacoeconomics 2002;20(Suppl 3):1–10. - PubMed
-
- Eisenhauer E, Vermorken J. Principles and process of cancer drug development. CME J Gynecol Oncol 2000;18(1):344–350. https://www.researchgate.net/publication/265355221_Principles_and_proces....
Publication types
MeSH terms
Substances
LinkOut - more resources
Full Text Sources
Other Literature Sources
Medical

