. 2021 May 21;49(9):5159-5176.
doi: 10.1093/nar/gkab267.

eIF4E3 forms an active eIF4F complex during stresses (eIF4FS) targeting mTOR and re-programs the translatome

Affiliations

eIF4E3 forms an active eIF4F complex during stresses (eIF4FS) targeting mTOR and re-programs the translatome

Benjamin Weiss et al. Nucleic Acids Res. .

Abstract

The eIF4E are a family of initiation factors that bind the mRNA 5' cap, regulating the proteome and the cellular phenotype. eIF4E1 mediates global translation and its activity is controlled via the PI3K/AKT/mTOR pathway. mTOR down-regulation results in eIF4E1 sequestration into an inactive complex with the 4E binding proteins (4EBPs). The second member, eIF4E2, regulates the translatome during hypoxia. However, the exact function of the third member, eIF4E3, has remained elusive. We have dissected its function using a range of techniques. Starting from the observation that it does not interact with 4EBP1, we demonstrate that eIF4E3 recruitment into an eIF4F complex occurs when Torin1 inhibits the mTOR pathway. Ribo-seq studies demonstrate that this complex (eIF4FS) is translationally active during stress and that it selects specific mRNA populations based on 5' TL (UTR) length. The interactome reveals that it associates with cellular proteins beyond the cognate initiation factors, suggesting that it may have 'moon-lighting' functions. Finally, we provide evidence that cellular metabolism is altered in an eIF4E3 KO background but only upon Torin1 treatment. We propose that eIF4E3 acts as a second branch of the integrated stress response, re-programming the translatome to promote 'stress resistance' and adaptation.


Figures

Figure 1.
Figure 1.
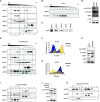
eIF4E3 binds the 5′ cap and is not regulated by 4EBP1. (A, B) Anti-HA Western blots following cap pull down using cell lysates from HEK293T cells transfected with WT or tryptophan mutants of eIF4E1HA (A) or eIF4E3HA (B). The input, non-binding fraction (NBF) and binding fractions (BF) are indicated. (C) Co-immunoprecipitation assays using either eIF4E3FLAG or eIF4E3FLAG transiently co-expressed with HIS-MYC4EBP1 in HEK293T cells. The FLAG tagged proteins were pulled down and the presence of the FLAG and MYC tagged proteins was monitored by Western blotting. (D) Western blot showing the phosphorylation status of 4EBP1 (indicated as β/γ with α being the non-phosphorylated form) in HEK293T cells transduced with empty vector, eIF4E1HA WT and tryptophan mutants or eIF4E3HA WT and tryptophan mutant.
Figure 2.
Figure 2.
eIF4E3 co-sediments with eIF4F when the AKT/mTOR pathway is inhibited. (A) Western blots showing the sedimentation profiles on glycerol gradients of members of the eIF4F complex and of 4EBP1 from HEK293T cell lysates. Fractions 2/3/4 and fraction 7 are highlighted as the regions in which we find eIF4F (based upon the sedimentation of eIF4G1) and eIF4E3, respectively (* indicates a faster migrating band observed in blots using the eIF4E3 antibody). (B) Western blots of the sedimentation profiles on glycerol gradients of RPS6 from HEK293T cells lysates treated or non-treated with SDS prior to loading. (C) Western blots of eIF4F complex members following resuspension of the gradient pellet. (D) Western blots showing the phosphorylation levels of AKT/mTOR pathway members following treatment of HEK293T cells with DMSO or with 250 nM Torin1 for 2 h. (E) Western blots showing the sedimentation profiles of members of the eIF4F complex and of 4EBP1 from a lysate of HEK293T cells treated with 250 nM Torin1 for 2 h. Fractions 2/3/4 and fractions 7/8/9 are highlighted as the regions in which we find eIF4F and the majority of eIF4E1, respectively. (F, G) Quantification of the level of eIF4E1 (F) and eIF4E3 (G) derived from the profiles in panels (A) and (E). (H) Western blots showing the phosphorylation status of AKT/mTOR pathway members following treatment of HEK293T cells with DMSO or with 50 μM LY294002 for 1 h. (I) Western blots showing the sedimentation profiles of members of the eIF4F complex and 4EBP1 from a lysate of HEK293T cells treated with 50 μM LY294002 for 1 h. The fractions containing the eIF4F complex are indicated by the rectangle. (J) Western blots showing the phosphorylation status of AKT/mTOR pathway members following glucose starvation of HEK293T cells for 2 h. (K) Western blots showing the sedimentation profiles of members of the eIF4F complex and 4EBP1 from a lysate of HEK293T cells glucose starved for 2 h. The fractions in which the eIF4F complex is located are indicated by the rectangle.
Figure 3.
Figure 3.
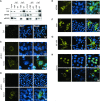
The eIF4E3 partners discovered by Y2H. (A) Western blot analysis of the co-IP assay using eIF4E3HA and endogenous eIF4G1 or eIF4G3 starting from a lysate of HEK293T cells transduced with eIF4E3HA treated with DMSO or with 250 nM Torin1 for 2 h. Beads carrying covalently cross-linked Anti-HA Ab (+IgG) were used to immunoprecipitate eIF4E3HA. Beads without Ab served as a control (–IgG). (B–H) Bimolecular complementation assay using Venus YFP in transfected HEK293T cells. Images were generated by confocal microscopy. Venus fragment 1 and Venus fragment 2 were fused to eIF4E3 and to one of the tested partners, respectively: empty vector (B), eIF4G1 (C), eIF4G3 (D), HSPA8 (E), XIAP (F), HIF1AN (G) and CDC5L (H).
Figure 4.
Figure 4.
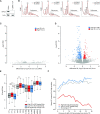
eIF4E3 is involved in translational re-programming during Torin1-induced stress. (A) Western blot showing the level of endogenous eIF4E3 in N2a cells after transfection with empty vector or vector containing gRNAs targeting eIF4E3 following antibiotic selection. (B) Polysome profiles of N2a cells control (ctrl) and eIF4E3 KO treated with DMSO or 250 nM Torin1 for 2 h. (C, D) Volcano plots of RiboDiff output, showing log2 fold change of differential translational efficiency (TE) comparing KO versus ctrl for DMSO (C) and Torin1 (D) against the resultant false discovery rate (FDR) of each comparison. Transcripts showing significantly higher or lower TE in KO are highlighted in red and blue, respectively. (E) Boxplot comparing lengths of 5′TL, CDS, 3′UTR and mRNA for High TE, Low TE and No TE change groups. We note that 5′TL lengths are significantly higher and lower than control for high TE and low TE groups, respectively. High TE and Low TE groups were defined (using RiboDiff output) as transcripts with FDR <0.05, showing log2 TE fold changes for KO/ctrl that are positive and negative, respectively. The no change group was defined as having log FC <0.05 and FDR >0.4 when comparing KO versus ctrl at the TE, ribo-seq and RNA-seq level. (F) Plot of mean GC percentage for 20bp windows beginning at the start of the TL and sliding base-by-base up to 30 bases from TL start. This is shown for the High TE, Low TE and No TE change groups defined in the legend of Figure 4E. **P-value < 0.01; ***P-value < 0.001; P-value < 0.001. P-values < 0.0001 are indicated. No value indicates no significant changes.
Figure 5.
Figure 5.
A role for eIF4E3 in the metabolic response during Torin1-induced stress. (A) Volcano plot of edgeR output, showing log2 fold change of differential expression of ribosome profiling footprint (RPF) counts for each CDS, comparing KO and ctrl in Torin1. (B, C) Barplot of FDR values for hypergeometric tests showing enrichment of various KEGG terms among genes downregulated (B) and upregulated (C) in KO vs ctrl, in Torin1. (D, E) Histogram showing the relative ATP (D) or NAD(P)H (E) levels over time: values represent the [KO treated]/[KO untreated] ratio relative to the [ctrl treated]/[ctrl untreated] ratio normalized to day 0. P-values are shown above. (F) Relative ATP linked respiration rate in treated relative to untreated ctrl or KO cells. (G) Relative oxygen consumption rate (OCR) relative to the extracellular acidification rate (ECAR) of ctrl or KO cells treated with Torin1 normalized to DMSO conditions as measured using the Mito Stress Test kit. (H) Western blots using Abs for eIF4E3, HA and actin from N2a ctrl or KO cells transduced with empty lentivector or a vector expressing ThHA. (I) Histogram of the dopamine levels in ctrl or KO cells treated with DMSO for 4 days. (J) Histogram of the dopamine level in ctrl or KO cells treated with Torin1 for 4 days. **P-value < 0.01; ***P-value < 0.001; P-value < 0.001; P-value < 0.0001 were indicated directly. No value: no significant changes.
Figure 6.
Figure 6.
Model for the role of eIF4E3 in re-programming the translational readout during stress.

Similar articles

Cited by

  • eIF4E-independent translation is largely eIF3d-dependent.
    Roiuk M, Neff M, Teleman AA. Roiuk M, et al. Nat Commun. 2024 Aug 6;15(1):6692. doi: 10.1038/s41467-024-51027-z. Nat Commun. 2024. PMID: 39107322 Free PMC article.
  • eIF4E1b is a non-canonical eIF4E protecting maternal dormant mRNAs.
    Lorenzo-Orts L, Strobl M, Steinmetz B, Leesch F, Pribitzer C, Roehsner J, Schutzbier M, Dürnberger G, Pauli A. Lorenzo-Orts L, et al. EMBO Rep. 2024 Jan;25(1):404-427. doi: 10.1038/s44319-023-00006-4. Epub 2023 Dec 14. EMBO Rep. 2024. PMID: 38177902 Free PMC article.
  • RNA modifications in cancer.
    Tang Q, Li L, Wang Y, Wu P, Hou X, Ouyang J, Fan C, Li Z, Wang F, Guo C, Zhou M, Liao Q, Wang H, Xiang B, Jiang W, Li G, Zeng Z, Xiong W. Tang Q, et al. Br J Cancer. 2023 Aug;129(2):204-221. doi: 10.1038/s41416-023-02275-1. Epub 2023 Apr 24. Br J Cancer. 2023. PMID: 37095185 Free PMC article. Review.
  • eIF4EHP promotes Ldh mRNA translation in and fruit fly adaptation to hypoxia.
    Liang M, Hody C, Yammine V, Soin R, Sun Y, Lin X, Tian X, Meurs R, Perdrau C, Delacourt N, Oumalis M, Andris F, Conrard L, Kruys V, Gueydan C. Liang M, et al. EMBO Rep. 2023 Jul 5;24(7):e56460. doi: 10.15252/embr.202256460. Epub 2023 May 5. EMBO Rep. 2023. PMID: 37144276 Free PMC article.
  • Non-canonical mRNA translation initiation in cell stress and cancer.
    Mahé M, Rios-Fuller T, Katsara O, Schneider RJ. Mahé M, et al. NAR Cancer. 2024 May 31;6(2):zcae026. doi: 10.1093/narcan/zcae026. eCollection 2024 Jun. NAR Cancer. 2024. PMID: 38828390 Free PMC article. Review.

References

    1. Pannevis M.C., Houlihan D.F.. The energetic cost of protein synthesis in isolated hepatocytes of rainbow trout (Oncorhynchus mykiss). J. Comp. Physiol. [B]. 1992; 162:393–400. - PubMed
    1. Hinnebusch A.G., Ivanov I.P., Sonenberg N.. Translational control by 5′-untranslated regions of eukaryotic mRNAs. Science (New York, N.Y.). 2016; 352:1413–1416. - PMC - PubMed
    1. Curran J.A., Weiss B.. What is the impact of mRNA 5′ TL heterogeneity on translational start site selection and the mammalian cellular phenotype. Front. Genet. 2016; 7:156. - PMC - PubMed
    1. Hinnebusch A.G., Lorsch J.R.. The mechanism of eukaryotic translation initiation: new insights and challenges. Cold Spring Harb. Perspect. Biol. 2012; 4:a011544. - PMC - PubMed
    1. Merrick W.C. eIF4F: a retrospective. J. Biol. Chem. 2015; 290:24091–24099. - PMC - PubMed

Publication types

MeSH terms

Substances