. 2021 May 3;220(5):e202010004.
doi: 10.1083/jcb.202010004.

VPS13D bridges the ER to mitochondria and peroxisomes via Miro

Affiliations

VPS13D bridges the ER to mitochondria and peroxisomes via Miro

Andrés Guillén-Samander et al. J Cell Biol. .

Erratum in

Abstract

Mitochondria, which are excluded from the secretory pathway, depend on lipid transport proteins for their lipid supply from the ER, where most lipids are synthesized. In yeast, the outer mitochondrial membrane GTPase Gem1 is an accessory factor of ERMES, an ER-mitochondria tethering complex that contains lipid transport domains and that functions, partially redundantly with Vps13, in lipid transfer between the two organelles. In metazoa, where VPS13, but not ERMES, is present, the Gem1 orthologue Miro was linked to mitochondrial dynamics but not to lipid transport. Here we show that Miro, including its peroxisome-enriched splice variant, recruits the lipid transport protein VPS13D, which in turn binds the ER in a VAP-dependent way and thus could provide a lipid conduit between the ER and mitochondria. These findings reveal a so far missing link between function(s) of Gem1/Miro in yeast and higher eukaryotes, where Miro is a Parkin substrate, with potential implications for Parkinson's disease pathogenesis.


Figures

Figure 1.
Figure 1.
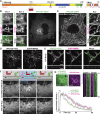
VPS13D recruitment by Miro GTPases. (A) Domain organization of human VPS13D and Miro1. TM, transmembrane. (B) Confocal images of COS7 cell expressing VPS13D^EGFP, showing that this protein decorates mitochondria, as shown by colocalization with mito-BFP (Box 1), in addition to being enriched in the Golgi area, visualized by the trans-Golgi marker ST-Halo (Box 2). (C) COS7 cell coexpressing VPS13D^EGFP and Halo-Miro1, showing dramatic increase in the localization of VPS13D^EGFP to mitochondria produced by Miro overexpression. The region within the white rectangle is shown at higher magnification next to the main field. Fig. 1, B and C, are also shown in Fig. S1, A and C. Scale bars, 10 µm in main panels, 3 µm in insets. (D) Recruitment of VPS13D to mitochondria can also be achieved by coexpression with Miro2. (E) VPS13D^Halo and EGFP-Miro1 colocalize in the cell body and processes of a mouse hippocampal neuron. (F) Optogenetic recruitment of the cytosolic domain of Miro1 to the OMM. Top panels: Schematic representation of the experiment, showing that Venus-iLID-Mito in the OMM recruits mCh-Miro1(ΔTM)-SspB upon blue light excitation. The recruitment of Miro1, in turn, triggers the recruitment of VPS13D. Middle and bottom panels: Confocal images of a COS7 cell show blue light–dependent recruitment and shedding of mCh-Miro1(ΔTM)-SspB and correspondingly of VPS13D^Halo. The illumination was started at time 0 s on a 5-µm2 area shown in the leftmost panel. See also Video 1. Scale bars for D–F, 10 µm. (G) Time course of the recruitment and shedding of VPS13D^Halo and mCh-Miro1(ΔTM)-SSPB to the OMM. Top left panel: Snapshots of an isolated mitochondrion at the peak of recruitment. Top right panel: Example kymographs showing the increase and decrease in fluorescence along the stippled line shown in the left panels. Note that while the mCh-Miro1(ΔTM)-SSPB signal on mitochondria is lower than in the surrounding cytosol before illumination and after recovery, this is not the case for VPS13D^Halo, as a pool of this protein is bound to endogenous Miro. The kymographs start 10 s before illumination. Bottom panel: Graph showing the normalized fluorescence intensity (average ± SEM) along the length of kymographs of 18 independently illuminated mitochondria in 14 different cells. Scale bars, 1 µm. The decay in intensity of VPS13D^Halo and mCh-Miro1(ΔTM)-SspB on mitochondria was fitted to an exponential equation: For VPS13D^Halo, time constant τ = 86.51 s; 95% confidence interval, 77.64, 97.56; for mCh-Miro1(ΔTM)-SspB, time constant τ = 54.11 s; 95% confidence interval, 51.07, 57.54; adjusted R2 of fits = 0.97 and 0.98, respectively.
Figure S1.
Figure S1.
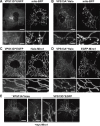
Both VPS13D and VPS13A interact with mitochondria, but only the interaction of VPS13D is mediated by Miro. (A and B) Confocal images of COS7 cells coexpressing either VPS13D^EGFP (A) or VPS13A^Halo (B) and the mitochondrial marker mito-BFP, but not Miro. The fluorescence of both VPS13 paralogues decorates mitochondria, with the fluorescence of VPS13A showing the typical discontinuous pattern that was shown (Kumar et al., 2018) to reflect its selective concentration at mitochondria–ER contact sites even without VAP overexpression. (C and D) Upon coexpression with Miro1, the localization of VPS13D^EGFP (C) but not VPS13A^Halo (D) at mitochondria is drastically enhanced. Note that VPS13D^EGFP colocalizes with Miro1 along the entire mitochondrial surface, while the punctate localization of VPS13A^Halo along mitochondria is unaffected by the overexpression of Miro1. (E) COS7 cell coexpressing VPS13A^Halo and VPS13D^EGFP as well as myc-Miro1 (not shown), showing the different localization of the two proteins on mitochondria: VPS13D^EGFP is enriched throughout the entire mitochondrial surface, while VPS13A^Halo localizes only to hot spots. Higher magnifications of the areas enclosed by stippled white rectangles are shown for all fields. Fig. S1, A and C, are also shown in Fig. 1, B and C. Scale bars, 10 µm in the main panels and 3 µm in insets.
Figure 2.
Figure 2.
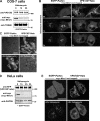
Miro is required for VPS13D recruitment to mitochondria. (A) Confocal images of HeLa cells showing the moderate recruitment of VPS13D^EGFP to mitochondria in control cells (left panel) and the loss of such signal upon knockdown of the two Miro genes via RNAi (right panel). Areas enclosed by stippled white rectangles are shown at higher magnification next to the main field, and they also show the localization of the mitochondrial marker mito-BFP. Scale bars, 30 µm in the main panel and 3 µm in the insets. (B) Immunoblot (IB) of mitochondrial fractions from HeLa cells showing the decrease of Miro1 and Miro2 levels upon RNAi treatment. Sizes in kD are indicated next to the blot. The black arrowhead indicates the Miro1 band. (C) Quantification of VPS13D^EGFP enrichment at mitochondria in control conditions and upon Miro knockdown or overexpression. The signal from mito-BFP was first used to generate a mitochondrial mask and a mask profiling a thin (1-pixel wide) cytosolic area surrounding mitochondria; the intensity from EGFP was then measured within each of these masks, and, for each cell analyzed, the ratio between these two measurements was plotted on the graph. Number of cells analyzed for scrambled (Scr) RNAi, Miro RNAi, and mCh-Miro1 conditions are 204, 204, and 96, respectively. ****, P < 0.0001 (Welch’s corrected ANOVA with Games-Howell's post hoc test).
Figure S2.
Figure S2.
Parkin-mediated Miro degradation correlates with the dissociation of VPS13D from mitochondria. COS7 or HeLa cells were cotransfected with myc-Miro1, VPS13D, and EGFP-Parkin. (A and D) Western blots showing the decrease of myc-Miro1 level upon 10 µM valinomycin treatment of COS7 (A) or HeLa cells (D). Scarlet, a modified RFP, was visualized by anti-RFP antibodies. Sizes in kD are indicated next to each blot. (B, C, and E) Confocal time lapses of COS7 (B and C) or HeLa cells (E) coexpressing EGFP-Parkin, VPS13D^Halo, and myc-Miro1. VPS13D, initially recruited to mitochondria by Miro, is shed from mitochondria and relocated to the cytosol upon treatment with valinomycin, which induces the recruitment of EGFP-Parkin. The boxed regions in B are shown in higher magnification in C. Scale bars, 30 µm in the main panels and 3 µm in insets.
Figure 3.
Figure 3.
A transcript variant of Miro1 preferentially targeted to peroxisomes recruits VPS13D to peroxisomes. (A) Domain organization of two splice variants of Miro1 (Okumoto et al., 2018). TM, transmembrane. In the alternative splice variant 4 (Miro1v4), two extra exons are included that encode 73 additional amino acids in the C-terminal region of Miro1. These amino acids promote the interaction of the protein with the chaperone Pex19, which leads to the predominant insertion of this variant into the peroxisomal membrane, although a pool of this variant still localizes to mitochondria. (B) COS7 cell showing the recruitment of VPS13D^Halo to peroxisomes (visualized by the peroxisomal luminal marker mScarlet-SRL) upon coexpression with transcript variant Miro1v4. The insets show colocalization with the peroxisomal marker (green arrowheads) and a weaker signal for both VPS13D and Miro1v4 on mitochondria (white arrowheads). Scale bars, 10 µm in the main panel and 3 µm in the insets.
Figure 4.
Figure 4.
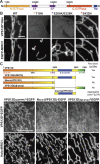
Recruitment of VPS13D by Miro GTPases requires their intact N-GTPase domain and EF-hand domains and the β-propeller region of VPS13D. (A) Domain organization of human Miro1 and mutations used for the experiments shown in B. TM, transmembrane. (B) Confocal images of COS7 cells showing that the recruitment of VPS13D^Halo by EGFP-Miro1 is impaired by mutations in the GTP binding site of its N-GTPase domain and in the Ca2+ binding sites of both its EF hands, but not by a mutation in the GTP binding site of its C-GTPase domain. Asterisks represent the point mutations in the Miro1 construct. Scale bar, 3 µm. (C) Top: Cartoons showing VPS13D constructs used for the experiments shown below. Bottom: Confocal images showing that removal of the C-terminal half of the protein or of the β-propeller region selectively, but not of the DH-PH domain, abolishes recruitment of VPS13D^EGFP by Halo-Miro1. All of several constructs encoding only the β-propeller region formed small aggregates, possibly due to misfolding. See also Fig. S4. Scale bar, 10 µm.
Figure S3.
Figure S3.
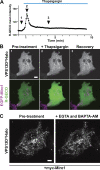
Recruitment of VPS13D to mitochondria by Miro is unaffected by changes in cytosolic Ca2+. (A and B) COS7 cell expressing EGFP-Miro1, VPS13D^Halo and the RFP genetically encoded Ca2+ indicator for optical imaging (R-GECO). (A) Cytosolic Ca2+ levels before and after addition of the sarco/endoplasmic reticulum Ca2+-ATPase pump inhibitor thapsigargin. (B) Time-lapse confocal images showing snapshot from the time points indicated in A and demonstrating that the localization of VPS13D^Halo on mitochondria in the presence of overexpressed Miro1 is not affected by the Ca2+ concentration. (C) Time-lapse confocal images showing that the binding of VPS13D^Halo to mitochondria in the presence of coexpressed myc-Miro1 is unaffected by the addition of EGTA and BAPTA-AM to lower intracellular cytosolic Ca2+. Scale bars, 10 µm.
Figure S4.
Figure S4.
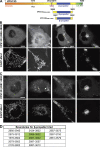
Localization of the constructs comprising the β-propeller region of VPS13D only. (A) Cartoon depicting full-length VPS13D and the VPS13D fragments used in the imaging experiment shown in B and C. (B and C) Confocal images of representative examples of the heterogeneous localization of two mCherry-tagged VPS13D fragments in COS7 cells coexpressing EGFP-Miro1. The first column shows a cytosolic localization; the second column shows the presence of small aggregates; and the third and fourth columns show the colocalization of VPS13D with Miro on mitochondria whose localization is disrupted. Scale bars, 10 µm. (D) List of VPS13D fragments containing the β-propeller region that were tested for Miro-induced recruitment to mitochondria. All of them behaved similarly. The constructs used for fields in B and C are highlighted in green.
Figure 5.
Figure 5.
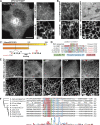
VPS13D binds VAP on the ER via a phospho-FFAT in its N-terminal region. (A) Left: Confocal image of a COS7 cell coexpressing Halo–VAP-B and VPS13D^EGFP showing weak recruitment of VPS13D^EGFP to the ER. Scale bar, 10 µm. Right: High-magnification view of Halo–VAP-B and VPS13D^EGFP fluorescence of the field enclosed by a rectangle. (B) VAP-dependent binding of the N-terminal portion of VPS13D to the ER. Left: Confocal images of a COS7 cell coexpressing the N-terminal portion of VPS13D fused to EGFP and mCherry-VAP-B. Right: Confocal images of a COS7 cell coexpressing the N-terminal portion of VPS13D fused to EGFP and Sec61β-RFP, but not VAP. Scale bar, 3 µm. (C) Cartoons showing VPS13D constructs used for the experiments shown in E, indicating the position of the predicted phospho-FFAT motif. (D) Comparison of the conventional FFAT motif with phospho-FFAT motifs, including the one found in VPS13D (Di Mattia et al., 2020). The aromatic residue indicated in green, present in both conventional and phospho-FFAT motifs, is essential for binding to VAP. Acidic amino acid residues in the region contribute to the binding in conventional FFAT motifs, but based on a previous study (Di Mattia et al., 2020), they can be replaced by phosphorylatable residues in phospho-FFAT motifs. (E) Evidence for a phospho-FFAT motif-dependent binding of the N-terminal region of VPS13D to VAP. First column: The N-terminal construct (1–1576) of VPS13D is recruited to the ER upon VAP overexpression. Second column: Two mutations in the MSP domain of VAP that disrupt the FFAT motif binding pocket also disrupt the recruitment of the VPS13D construct. Third column: Mutation to alanine of the aromatic residue of the phospho-FFAT motif disrupts binding. Fourth and fifth columns: No binding occurs when the threonine that corresponds to an aspartate in the conventional FFAT motif is replaced by a nonphosphorylatable alanine, but binding is restored when the threonine is replaced by aspartate, as long as the adjacent proline is also mutated (Di Mattia et al., 2020). Scale bar, 10 µm. (F) Alignment of the region of VPS13D orthologues from different species centered on the amino acid region required for Miro binding in human VPS13D. The alignment shows a high degree of conservation of the key residues of the phospho-FFAT motif among several chordates and also observed in flies. The phylogenetic tree was generated by maximum likelihood.
Figure S5.
Figure S5.
Mutations in the phospho-FFAT motif of VPS13D but not in conventional FFAT motifs disrupt VAP binding. (A) Cartoon depicting full-length VPS13D and the constructs used for C and D, displaying the localization of the predicted three conventional FFAT motifs and the single phospho-FFAT motif and the mutations that were introduced to disrupt them. (B) Sequence of each of the predicted conventional FFAT and phospho-FFAT motifs. *, Conventional FFAT motif score was calculated using a previously described algorithm; scores 3.5 and 4 are considered weak FFAT motifs (Slee and Levine, 2019). (C) Left: Coexpression of an EGFP-tagged N-terminal fragment of VPS13D (amino acid 1–1576) with the ER protein VAP-B shows robust recruitment of the fragment to the ER. Right: The combined disruption of the three best predicted conventional FFAT motifs as indicated in A did not affect ER recruitment of this VPS13D fragment by VAP-B. (D) The point mutation T770D alone (without the additional mutation of the adjacent proline to alanine; see Fig. 5 E and Di Mattia et al., 2020) abolishes the VAP-dependent recruitment of the N-terminal fragment of VPS13D to the ER. Scale bars, 10 µm.
Figure 6.
Figure 6.
VPS13D can tether the ER to mitochondria in a VAP- and Miro-dependent way. (A) COS7 cells coexpressing EGFP-Miro1, BFP–VAP-B, and VPS13D^Halo. Top: Single fluorescence images. Bottom: Merge of the different fluorescence channels as indicated. White arrowheads in the triple merge show that VPS13D^Halo (magenta) is enriched at hot spots where the ER (green) and mitochondria (blue) intersect. (B) Vesiculated ER and mitochondria induced by hypotonic treatment of COS7 cells coexpressing VPS13D^Halo, GFP-Miro1, and BFP–VAP-B remain tethered to each other, and VPS13D^Halo concentrates at these sites (white arrowheads). See also Video 2. Scale bars, 3 µm. (C) Schematic cartoon summarizing key findings of this study. Left: VPS13D can bridge the ER and either mitochondria or peroxisomes. Right: The interaction of VPS13D with the ER is mediated by VAP, and its interaction with either mitochondria or peroxisomes is mediated by Miro. Based on the reported properties of VPS13 family proteins, it is proposed that VPS13D allows flux of lipids between the two tethered bilayers.

Similar articles

Cited by

References

    1. Akşit, A. 2018. Peroxisomal Membrane Contact Sites in the Yeast Hansenula Polymorpha. PhD Thesis. University of Groningen, Groningen, Netherlands. Available at: https://research.rug.nl/en/publications/peroxisomal-membrane-contact-sit....
    1. Akşit, A., and van der Klei I.J.. 2018. Yeast peroxisomes: How are they formed and how do they grow? Int. J. Biochem. Cell Biol. 105:24–34. 10.1016/j.biocel.2018.09.019 - DOI - PubMed
    1. Anding, A.L., Wang C., Chang T.-K., Sliter D.A., Powers C.M., Hofmann K., Youle R.J., and Baehrecke E.H.. 2018. Vps13D encodes a ubiquitin-binding protein that is required for the regulation of mitochondrial size and clearance. Curr. Biol. 28:287–295.e6. 10.1016/j.cub.2017.11.064 - DOI - PMC - PubMed
    1. Antonicka, H., Lin Z.-Y., Janer A., Aaltonen M.J., Weraarpachai W., Gingras A.-C., and Shoubridge E.A.. 2020. A high-density human mitochondrial proximity interaction network. Cell Metab. 32:479–497.e9. 10.1016/j.cmet.2020.07.017 - DOI - PubMed
    1. Baldwin, H., Wang C., Kanfer G., Shah H., Velayos-Baeza A., Dulovic-Mahlow M., Brüggemann N., Anding A., Baehrecke E.H., Maric D., et al. . 2021. VPS13D promotes peroxisome biogenesis. J. Cell Biol. 220:e202001188. - PMC - PubMed

Publication types