Remodeling of the gut microbiome during Ramadan-associated intermittent fasting
- PMID: 33842951
- PMCID: PMC8106760
- DOI: 10.1093/ajcn/nqaa388
Remodeling of the gut microbiome during Ramadan-associated intermittent fasting
Abstract
Background: Intermittent fasting is a popular dietary intervention with perceived relatively easy compliance and is linked to various health benefits, including weight loss and improvement in blood glucose concentrations. The mechanistic explanations underlying the beneficial effects of intermittent fasting remain largely obscure but may involve alterations in the gut microbiota.
Objectives: We sought to establish the effects of 1 mo of intermittent fasting on the gut microbiome.
Methods: We took advantage of intermittent fasting being voluntarily observed during the Islamic faith-associated Ramadan and sampled feces and blood, as well as collected longitudinal physiologic data in 2 cohorts, sampled in 2 different years. The fecal microbiome was determined by 16S sequencing. Results were contrasted to age- and body weight-matched controls and correlated to physiologic parameters (e.g., body mass and calorie intake).
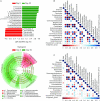
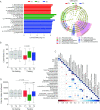
Results: We observed that Ramadan-associated intermittent fasting increased microbiome diversity and was specifically associated with upregulation of the Clostridiales order-derived Lachnospiraceae [no fasting 24.6 ± 13.67 compared with fasting 39.7 ± 15.9 in relative abundance (%); linear discriminant analysis = 4.9, P < 0.001 by linear discriminant analysis coupled with effect size measurements] and Ruminococcaceae [no fasting 13.4 ± 6.9 compared with fasting 23.2 ± 12.9 in relative abundance (%); linear discriminant analysis = 4.7, P < 0.001 by linear discriminant analysis coupled with effect size measurements] bacterial families. Microbiome composition returned to baseline upon cessation of intermittent feeding. Furthermore, changes in Lachnospiraceae concentrations mirrored intermittent fasting-provoked changes in physiologic parameters.
Conclusions: Intermittent fasting provokes substantial remodeling of the gut microbiome. The intermittent fasting-provoked upregulation of butyric acid-producing Lachnospiraceae provides an obvious possible mechanistic explanation for health effects associated with intermittent fasting.
Keywords: Lachnospiraceae; Ramadan; butyrate; calorie intake; gut microbiota; healthy volunteers; intermittent fasting.
© The Author(s) 2021. Published by Oxford University Press on behalf of the American Society for Nutrition.
Figures


Comment in
-
Toward a better understanding of intermittent fasting effects: Ramadan fasting as a model.Am J Clin Nutr. 2021 May 8;113(5):1075-1076. doi: 10.1093/ajcn/nqab017. Am J Clin Nutr. 2021. PMID: 33711099 Free PMC article. No abstract available.
Similar articles
-
Structural changes in gut microbiome after Ramadan fasting: a pilot study.Benef Microbes. 2020 May 11;11(3):227-233. doi: 10.3920/BM2019.0039. Epub 2020 Feb 19. Benef Microbes. 2020. PMID: 32073296
-
Investigating Ramadan Like Fasting Effects on the Gut Microbiome in BALB/c Mice.Front Nutr. 2022 May 12;9:832757. doi: 10.3389/fnut.2022.832757. eCollection 2022. Front Nutr. 2022. PMID: 35634379 Free PMC article.
-
Beneficial Gut Microbiome Remodeled During Intermittent Fasting in Humans.Rejuvenation Res. 2021 Jun;24(3):234-237. doi: 10.1089/rej.2021.0025. Rejuvenation Res. 2021. PMID: 34039011
-
Gut microbiota modulation as a possible mediating mechanism for fasting-induced alleviation of metabolic complications: a systematic review.Nutr Metab (Lond). 2021 Dec 14;18(1):105. doi: 10.1186/s12986-021-00635-3. Nutr Metab (Lond). 2021. PMID: 34906176 Free PMC article. Review.
-
Effects of Ramadan and Non-ramadan Intermittent Fasting on Gut Microbiome.Front Nutr. 2022 Mar 22;9:860575. doi: 10.3389/fnut.2022.860575. eCollection 2022. Front Nutr. 2022. PMID: 35392284 Free PMC article. Review.
Cited by
-
Comparative analysis of fasting effects on the cecum microbiome in three guinea pig breeds: Andina, Inti, and Peru.Front Microbiol. 2023 Dec 20;14:1283738. doi: 10.3389/fmicb.2023.1283738. eCollection 2023. Front Microbiol. 2023. PMID: 38173670 Free PMC article.
-
Gut microbiota and transcriptome dynamics in every-other-day fasting are associated with neuroprotection in rats with spinal cord injury.Front Microbiol. 2023 Jul 28;14:1206909. doi: 10.3389/fmicb.2023.1206909. eCollection 2023. Front Microbiol. 2023. PMID: 37577426 Free PMC article.
-
The Canadian Breast Cancer Symposium 2023 Meeting Report.Curr Oncol. 2024 Mar 29;31(4):1774-1802. doi: 10.3390/curroncol31040135. Curr Oncol. 2024. PMID: 38668038 Free PMC article.
-
Effect of Intermittent Fasting on Non-Alcoholic Fatty Liver Disease: Systematic Review and Meta-Analysis.Front Nutr. 2021 Jul 12;8:709683. doi: 10.3389/fnut.2021.709683. eCollection 2021. Front Nutr. 2021. PMID: 34322514 Free PMC article.
-
Metabolism and diabetes in Ramadan fasting: Exploring health trends and relationships through systematic literature network analysis.Narra J. 2024 Aug;4(2):e850. doi: 10.52225/narra.v4i2.850. Epub 2024 Jul 9. Narra J. 2024. PMID: 39280308 Free PMC article.
References
-
- de Cabo R, Mattson MP. Effects of intermittent fasting on health, aging, and disease. N Engl J Med. 2019;381(26):2541–51. - PubMed
-
- St-Onge MP, Ard J, Baskin ML, Chiuve SE, Johnson HM, Kris-Etherton P, Varady K; American Heart Association Obesity Committee of the Council on Lifestyle and Cardiometabolic Health; Council on Cardiovascular Disease in the Young; Council on Clinical Cardiology; and Stroke Council . Meal timing and frequency: implications for cardiovascular disease prevention: a scientific statement from the American Heart Association. Circulation. 2017;135(9):e96–e121. - PMC - PubMed
-
- Patterson RE, Sears DD. Metabolic effects of intermittent fasting. Annu Rev Nutr. 2017;37:371–93. - PubMed
Publication types
MeSH terms
Substances
LinkOut - more resources
Full Text Sources
Other Literature Sources

