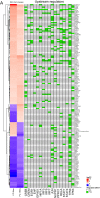
Therapeutic wavelengths of ultraviolet B radiation activate apoptotic, circadian rhythm, redox signalling and key canonical pathways in psoriatic epidermis
- PMID: 33812333
- PMCID: PMC8050411
- DOI: 10.1016/j.redox.2021.101924
Therapeutic wavelengths of ultraviolet B radiation activate apoptotic, circadian rhythm, redox signalling and key canonical pathways in psoriatic epidermis
Abstract
Ultraviolet B radiation (UVB) exerts pleiotropic effects on human skin. DNA damage response and repair pathways are activated by UVB; if damage cannot be repaired, apoptosis ensues. Although cumulative UVB exposure predisposes to skin cancer, UVB phototherapy is widely used as an effective treatment for psoriasis. Previous studies defined the therapeutic action spectrum of UVB and showed that psoriasis is resistant to apoptosis. This study aimed to investigate early molecular responses within psoriasis plaques following irradiation with single equi-erythemogenic doses of clinically-effective (311 nm, narrow-band) compared to clinically-ineffective (290 nm) UVB. Forty-eight micro-dissected epidermal samples from 20 psoriatic patients were analyzed using microarrays. Our bioinformatic analysis compared gene expression between 311 nm irradiated, 290 nm irradiated and control psoriasis epidermis to specifically identify 311 nm UVB differentially expressed genes (DEGs) and their upstream regulatory pathways. Key DEGs and pathways were validated by immunohistochemical analysis. There was a dynamic induction and repression of 311 nm UVB DEGs between 6 h and 18 h, only a limited number of DEGs maintained their designated expression status between time-points. Key disease and function pathways included apoptosis, cell death, cell migration and leucocyte chemotaxis. DNA damage response pathways, NRF2-mediated oxidative stress response and P53 signalling were key nodes, interconnecting apoptosis and cell cycle arrest. Interferon signalling, dendritic cell maturation, granulocyte adhesion and atherosclerotic pathways were also differentially regulated. Consistent with these findings, top transcriptional regulators of 311 nm UVB DEGs related to: a) apoptosis, DNA damage response and cell cycle control; b) innate/acquired immune regulation and inflammation; c) hypoxia/redox response and angiogenesis; d) circadian rhythmicity; f) EGR/AP1 signalling and keratinocyte differentiation; and g) mitochondrial biogenesis. This research provides important insights into the molecular targets of 311 nm UVB, underscoring key roles for apoptosis and cell death. These and the other key pathways delineated may be central to the therapeutic effects of 311 nm in psoriasis.
Keywords: Epidermal remodelling; Personalised therapy; Scalable biomarkers; Transcriptomics; UVB phototherapy; p53 signalling.
Copyright © 2021 The Author(s). Published by Elsevier B.V. All rights reserved.
Conflict of interest statement
NJR has received research grant funding from Novartis, PSORT partners (
Figures


Similar articles
-
312-nanometer ultraviolet B light (narrow-band UVB) induces apoptosis of T cells within psoriatic lesions.J Exp Med. 1999 Feb 15;189(4):711-8. doi: 10.1084/jem.189.4.711. J Exp Med. 1999. PMID: 9989986 Free PMC article.
-
Monochromatic excimer light (308 nm): an immunohistochemical study of cutaneous T cells and apoptosis-related molecules in psoriasis.J Eur Acad Dermatol Venereol. 2003 Jul;17(4):408-13. doi: 10.1046/j.1468-3083.2003.00758.x. J Eur Acad Dermatol Venereol. 2003. PMID: 12834450
-
Oxidation reduction is a key process for successful treatment of psoriasis by narrow-band UVB phototherapy.Acta Derm Venereol. 2015 Feb;95(2):140-6. doi: 10.2340/00015555-1905. Acta Derm Venereol. 2015. PMID: 24909845 Clinical Trial.
-
Effects of narrow band UVB (311 nm) irradiation on epidermal cells.Int J Mol Sci. 2013 Apr 17;14(4):8456-66. doi: 10.3390/ijms14048456. Int J Mol Sci. 2013. PMID: 23594996 Free PMC article. Review.
-
[Narrow-band UVB therapy in psoriasis vulgaris: good practice guideline and recommendations of the French Society of Photodermatology].Ann Dermatol Venereol. 2010 Jan;137(1):21-31. doi: 10.1016/j.annder.2009.12.004. Epub 2009 Dec 29. Ann Dermatol Venereol. 2010. PMID: 20110064 Review. French.
Cited by
-
Genomic correlation, shared loci, and causal relationship between insomnia and psoriasis: a large-scale genome-wide cross-trait analysis.Arch Dermatol Res. 2024 Jun 21;316(7):425. doi: 10.1007/s00403-024-03178-8. Arch Dermatol Res. 2024. PMID: 38904754
-
Circadian Oscillations of Minimal Erythema Dose (MED) are Also Influenced by Diet in Patients with Psoriasis: A Chronomedical Study.Dermatol Ther (Heidelb). 2023 Oct;13(10):2229-2246. doi: 10.1007/s13555-023-00987-z. Epub 2023 Aug 12. Dermatol Ther (Heidelb). 2023. PMID: 37573289 Free PMC article.
-
Phototherapy and DNA Damage: A Systematic Review.J Clin Aesthet Dermatol. 2023 Jun;16(6):55-58. J Clin Aesthet Dermatol. 2023. PMID: 37361361 Free PMC article.
-
Multiscale modelling of desquamation in the interfollicular epidermis.PLoS Comput Biol. 2022 Aug 29;18(8):e1010368. doi: 10.1371/journal.pcbi.1010368. eCollection 2022 Aug. PLoS Comput Biol. 2022. PMID: 36037236 Free PMC article.
-
Effects of UV-B and UV-C Spectrum Supplementation on the Antioxidant Properties and Photosynthetic Activity of Lettuce Cultivars.Int J Mol Sci. 2024 Aug 27;25(17):9298. doi: 10.3390/ijms25179298. Int J Mol Sci. 2024. PMID: 39273249 Free PMC article.
References
-
- Schuch A.P., Moreno N.C., Schuch N.J., Menck C.F.M., Garcia C.C.M. Sunlight damage to cellular DNA: focus on oxidatively generated lesions. Free Radic. Biol. Med. 2017;107:110–124. - PubMed
-
- Murphy G., Young A.R., Wulf H.C., Kulms D., Schwarz T. The molecular determinants of sunburn cell formation. Exp. Dermatol. 2001;10(3):155–160. - PubMed
-
- Qin J.-Z., Chaturvedi V., Denning M.F., Bacon P., Panella J., Choubey D., Nickoloff B.J. Regulation of apoptosis by p53 in UV-irradiated human epidermis, psoriatic plaques and senescent keratinocytes. Oncogene. 2002;21(19):2991–3002. - PubMed
-
- Zhang S., Xia C., Xu C., Liu J., Zhu H., Yang Y., Xu F., Zhao J., Chang Y., Zhao Q. Early growth response 3 inhibits growth of hepatocellular carcinoma cells via upregulation of Fas ligand. Int. J. Oncol. 2017;50 - PubMed
Publication types
MeSH terms
LinkOut - more resources
Full Text Sources
Other Literature Sources
Medical
Molecular Biology Databases
Research Materials
Miscellaneous

