

Metabolite Analysis of Jerusalem Artichoke (Helianthus tuberosus L.) Seedlings in Response to Polyethylene Glycol-Simulated Drought Stress
- PMID: 33804948
- PMCID: PMC8037225
- DOI: 10.3390/ijms22073294
Metabolite Analysis of Jerusalem Artichoke (Helianthus tuberosus L.) Seedlings in Response to Polyethylene Glycol-Simulated Drought Stress
Abstract
Jerusalem artichokes are a perennial crop with high drought tolerance and high value as a raw material to produce biofuels, functional feed, and food. However, there are few comprehensive metabolomic studies on Jerusalem artichokes under drought conditions.
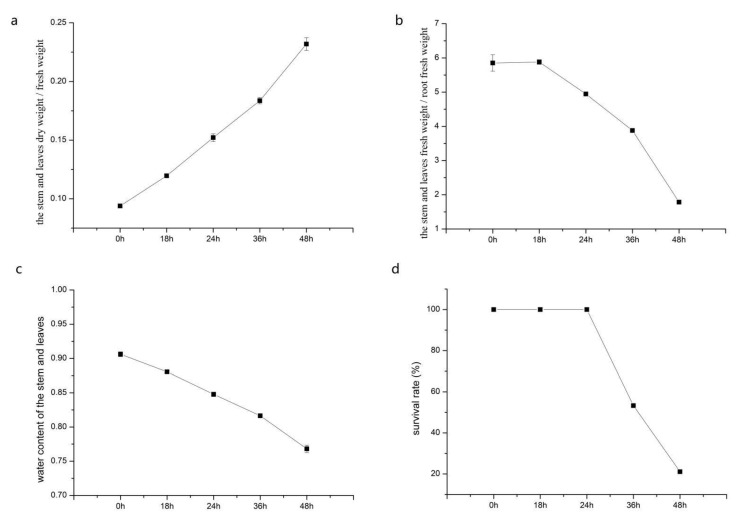
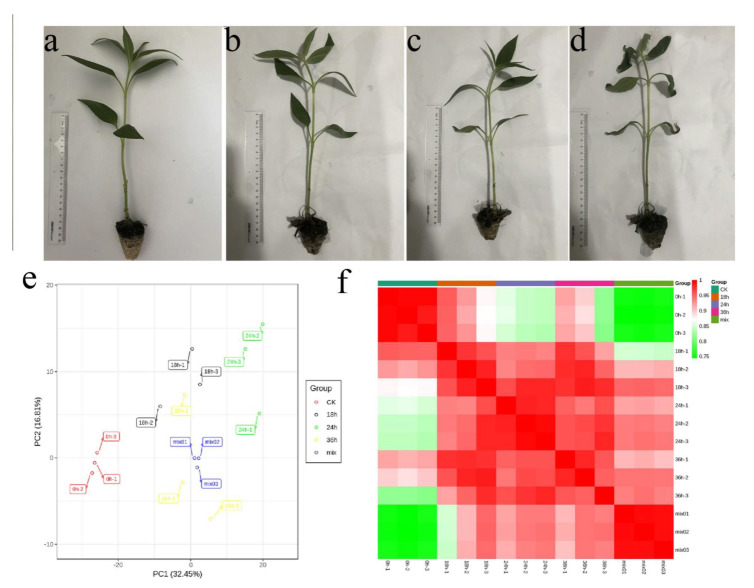
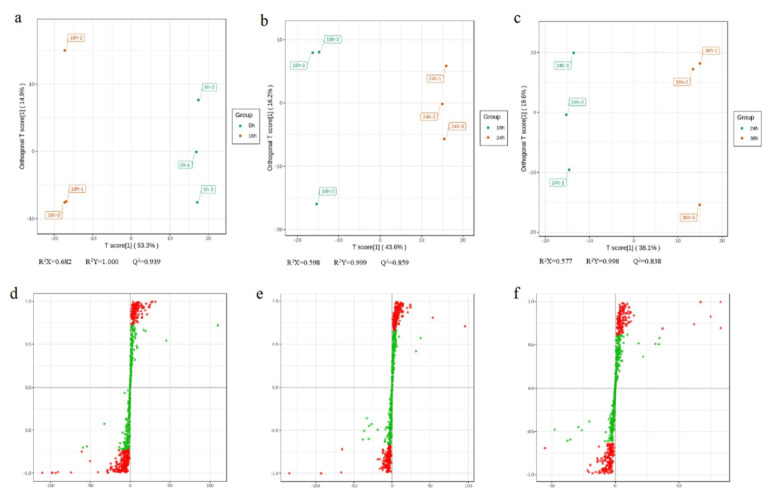
Methods: Ultra-performance liquid chromatography and tandem mass spectrometry were used to identify differential metabolites in Jerusalem artichoke seedling leaves under polyethylene glycol (PEG) 6000-simulated drought stress at 0, 18, 24, and 36 h.
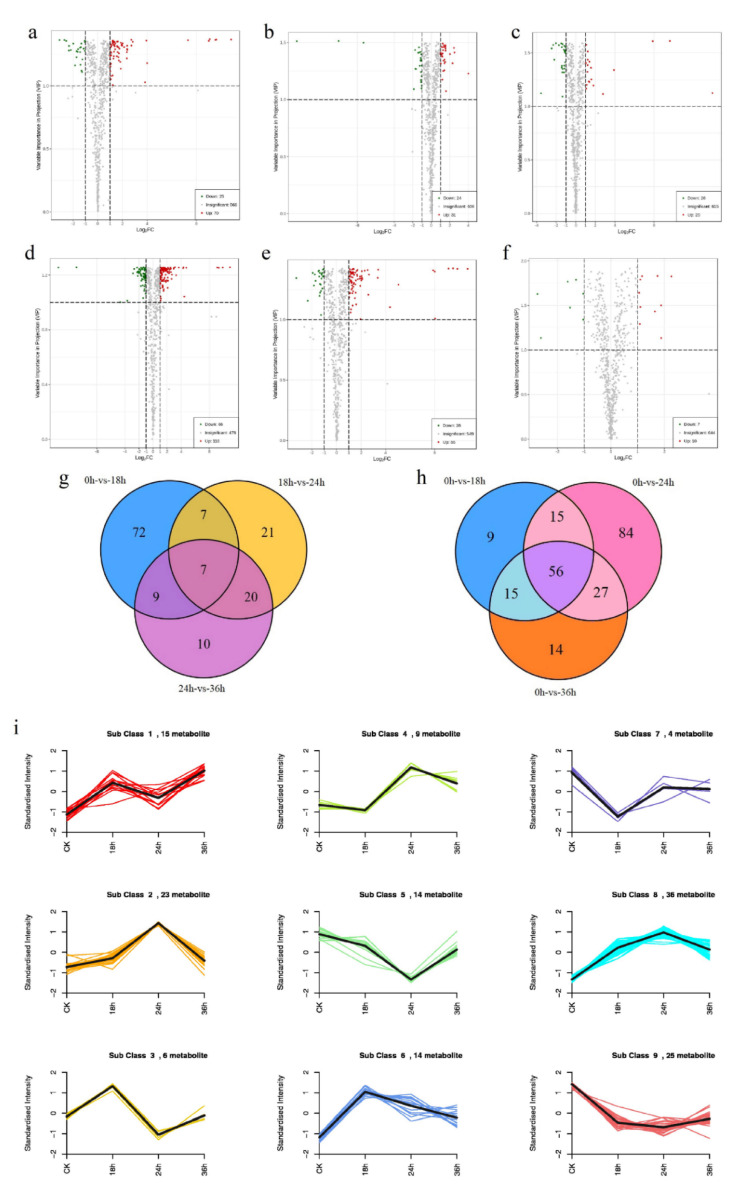
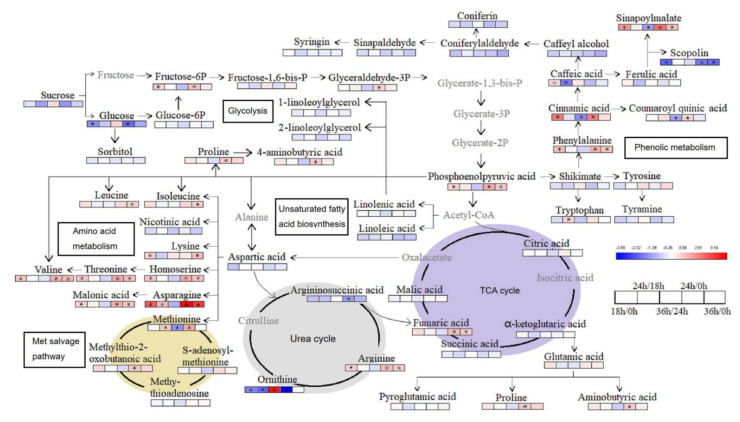
Results: A total of 661 metabolites and 236 differential metabolites were identified at 0 vs. 18, 18 vs. 24, and 24 vs. 36 h. 146 differential metabolites and 56 common were identified and at 0 vs. 18, 24, and 36 h. Kyoto Encyclopedia of Genes and Genomes enrichment identified 236 differential metabolites involved in the biosynthesis of secondary metabolites and amino acids. Metabolites involved in glycolysis, phenolic metabolism, tricarboxylic cycle, glutamate-mediated proline biosynthesis, urea cycle, amino acid metabolism, unsaturated fatty acid biosynthesis, and the met salvage pathway responded to drought stress.
Conclusion: A metabolic network in the leaves of Jerusalem artichokes under drought stress is proposed. These results will improve understanding of the metabolite response to drought stress in Jerusalem artichokes and develop a foundation for breeding drought-resistant varieties.
Keywords: Jerusalem artichoke; drought stress; metabolic network; metabolism.
Conflict of interest statement
The authors declare that they have no conflict of interest.
Figures
Similar articles
-
A fructan: the fructan 1-fructosyl-transferase gene from Helianthus tuberosus increased the PEG-simulated drought stress tolerance of tobacco.Hereditas. 2020 Apr 20;157(1):14. doi: 10.1186/s41065-020-00131-3. Hereditas. 2020. PMID: 32312318 Free PMC article.
-
Single and co-inoculum of endophytic bacteria promote growth and yield of Jerusalem artichoke through upregulation of plant genes under drought stress.PLoS One. 2023 Jun 2;18(6):e0286625. doi: 10.1371/journal.pone.0286625. eCollection 2023. PLoS One. 2023. PMID: 37267258 Free PMC article.
-
The antioxidant activities of flavonoids in Jerusalem artichoke (Helianthus tuberosus L.) leaves and their quantitative analysis.Nat Prod Res. 2022 Feb;36(4):1009-1013. doi: 10.1080/14786419.2020.1839464. Epub 2020 Oct 28. Nat Prod Res. 2022. PMID: 33111556
-
Jerusalem artichoke (Helianthus tuberosus L.) as a medicinal plant and its natural products.Cell Mol Biol (Noisy-le-grand). 2020 Jun 25;66(4):160-177. Cell Mol Biol (Noisy-le-grand). 2020. PMID: 32583794 Review.
-
Nutritional value, bioactivity, and application potential of Jerusalem artichoke (Helianthus tuberosus L.) as a neotype feed resource.Anim Nutr. 2020 Dec;6(4):429-437. doi: 10.1016/j.aninu.2020.09.001. Epub 2020 Sep 25. Anim Nutr. 2020. PMID: 33364459 Free PMC article. Review.
Cited by
-
Metabolomic changes in crown of alfalfa (Medicago sativa L.) during de-acclimation.Sci Rep. 2022 Sep 2;12(1):14977. doi: 10.1038/s41598-022-19388-x. Sci Rep. 2022. PMID: 36056096 Free PMC article.
-
Integrated analysis of transcriptome, metabolome, and histochemistry reveals the response mechanisms of different ages Panax notoginseng to root-knot nematode infection.Front Plant Sci. 2023 Sep 14;14:1258316. doi: 10.3389/fpls.2023.1258316. eCollection 2023. Front Plant Sci. 2023. PMID: 37780502 Free PMC article.
-
Metabolomics-based exploration the response mechanisms of Saussurea involucrata leaves under different levels of low temperature stress.BMC Genomics. 2023 Jun 1;24(1):297. doi: 10.1186/s12864-023-09376-4. BMC Genomics. 2023. PMID: 37264318 Free PMC article.
-
Combined transcriptome and metabolome reveal glutathione metabolism plays a critical role in resistance to salinity in rice landraces HD961.Front Plant Sci. 2022 Sep 7;13:952595. doi: 10.3389/fpls.2022.952595. eCollection 2022. Front Plant Sci. 2022. PMID: 36160959 Free PMC article.
-
Growth Properties and Metabolomic Analysis Provide Insight into Drought Tolerance in Barley (Hordeum vulgare L.).Int J Mol Sci. 2024 Jun 29;25(13):7224. doi: 10.3390/ijms25137224. Int J Mol Sci. 2024. PMID: 39000330 Free PMC article.
References
-
- Chen W., Gong L., Guo Z.L., Wang W.S., Zhang H.Y., Liu X.Q., Yu S.B., Xiong L.Z., Luo J. A novel integrated method for large-scale detection, identification, and quantification of widely targeted metabolites: Application in the study of rice metab-olomics. Mol. Plant. 2013;6:1769–1780. doi: 10.1093/mp/sst080. - DOI - PubMed
MeSH terms
Substances
Grants and funding
LinkOut - more resources
Full Text Sources
Other Literature Sources
Miscellaneous
