. 2021 Apr 2;372(6537):eaba1786.
doi: 10.1126/science.aba1786.

Transient rest restores functionality in exhausted CAR-T cells through epigenetic remodeling

Affiliations

Transient rest restores functionality in exhausted CAR-T cells through epigenetic remodeling

Evan W Weber et al. Science. .

Abstract

T cell exhaustion limits immune responses against cancer and is a major cause of resistance to chimeric antigen receptor (CAR)-T cell therapeutics. Using murine xenograft models and an in vitro model wherein tonic CAR signaling induces hallmark features of exhaustion, we tested the effect of transient cessation of receptor signaling, or rest, on the development and maintenance of exhaustion. Induction of rest through enforced down-regulation of the CAR protein using a drug-regulatable system or treatment with the multikinase inhibitor dasatinib resulted in the acquisition of a memory-like phenotype, global transcriptional and epigenetic reprogramming, and restored antitumor functionality in exhausted CAR-T cells. This work demonstrates that rest can enhance CAR-T cell efficacy by preventing or reversing exhaustion, and it challenges the notion that exhaustion is an epigenetically fixed state.


Figures

Figure 1:
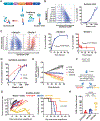
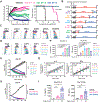
Figure 1:. A GD2-targeting CAR modified with a destabilizing domain (DD) exhibits drug-dependent control of expression, function, and tonic CAR signaling.
A) Schematic depicting drug-dependent control of DD CAR fusion protein. B) Flow cytometric analysis of GD2.28ζ.FKBP CAR surface expression at increasing concentrations of shield-1. C) Flow cytometric analysis of ON/OFF kinetics of GD2.28ζ.FKBP CAR surface expression at indicated time points after addition or removal shield-1. D) IL-2 and IFNγ secretion of GD2.28ζ.FKBP CAR-T cells pretreated with indicated concentrations of shield-1 16 hours prior to co-culture with Nalm6-GD2 leukemia. E) Cytotoxicity of GD2.28ζ.FKBP CAR-T cells treated as in (D) against Nalm6-GD2-GFP leukemia (1:2 E:T, normalized to t=0). Error bars represent mean ± SD of triplicate wells. Representative donor from 3 donors. F-H) 2x10⁶ GD2.28ζ.ecDHFR CAR-T cells expanded in the presence or absence of trimethoprim (TMP) for 15 days in vitro (F) were infused IV in NSG mice 7 days post-engraftment of 1x10⁶ Nalm6-GD2 leukemia cells. Mice were dosed 6 days per week with vehicle (water, OFF/OFF) or 200mg/kg TMP (ON/ON and OFF/ON). (G) Quantification of tumor growth by bioluminescent imaging (right) and survival (left) (p<0.0001 log-rank Mantel-Cox test). Representative experiment from 3 independent experiments (n=5 mice/group). (H) Detection of CAR-T cells in peripheral blood sampled on day 28 post-engraftment by flow cytometry after anti-human CD45 staining (n=10 mice/group from 2 independent experiments). B-C show histograms from one representative donor (n=3 donors). Curves in B-D show mean ± SEM from 3 donors. Statistics: G log-rank Mantel-Cox test, H Kruskal-Wallis and Dunn’s multiple comparisons test. **, p<0.01; ****p<0.0001; ns, p>0.05
Figure 2:
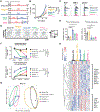
Figure 2:. Cessation of tonic CAR signaling redirects CAR-T cell fate.
A) Experimental design: HA.28ζ.FKBP CAR-T cells were cultured in the presence of shield-1 from D1-11 (Always ON) or treatment was discontinued on D7 (RestedD7-11) B) Co-expression of inhibitory receptors by flow cytometry on D11. Error bars represent mean ± SEM of 3 donors. C) IL-2 secretion in response to Nalm6-GD2 leukemia on D11. Error bars represent mean ± SD of triplicate wells from one representative donor (n=5 donors). D-H) Force-directed layout (FDL) constructed from 20,000 CAR+/CD8+ events analyzed by mass cytometry. Cells repel based on expression of 20 surface and 2 intracellular markers (Figure S2B) and grey edges connect cells from adjacent days (representative donor from n=3 donors). (D) Local polynomial regression fitting exhaustion (left panel) and memory (right panel) scores in 2,000 sampled cells from Always ON and RestedD7-11 conditions over time. Shaded regions indicate 95% confidence intervals. Refer to Methods for details. (E) FDL colored by timepoint. D11 cells are concentrated in phenotypically distinct regions 1-4 (Figure S2C). (F) FDL colored by treatment. Percent of Always ON and RestedD7-11 cells is shown for each D11 region. (G) FDL colored by expression of indicated proteins. (H) Violin plots of D11 cell exhaustion and memory scores contained within regions 1-4 show quartiles with a band at the mean. Statistics: B two-way ANOVA with Dunnett’s multiple comparisons test, C unpaired two-tailed student’s t test, H or Kruskal-Wallis with Dunn’s multiple comparisons test. **, p<0.01; ****, p<0.0001; ns, p>0.05
Figure 3:
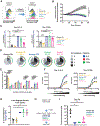
Figure 3:. Transient rest reverses phenotypic and transcriptomic hallmarks of exhaustion.
A) Experimental design: Activated human T cells were transduced with HA.28ζ.FKBP CAR lentivirus on D1. CAR-T cells were cultured in the presence (red) or absence (blue) of stabilizing drug for the indicated periods of time. Cells were collected on D7, D11, and D15 for FACS and bulk RNA sequencing. B) Cell growth curves (n=6-9 donors). C-E) Flow cytometric analysis of the expression of (C) inhibitory receptors and (D) effector or (E) stem cell memory markers on CD8+ CAR+ T cells. Histograms and contour plots of representative donor are shown. Bar graphs show mean ± SEM of 3 independent donors. Inset in C illustrates effector-memory-like (EM, top-left) and stem cell memory-like (SCM, bottom-right) phenotype quadrants. F-H) Bulk RNA sequencing analyses of mixed CD4+/CD8+ HA.28ζ.FKBP CAR-T cells. (F) Kinetics of the mean expression of genes upregulated (top) or downregulated (bottom) during exhaustion at each timepoint for every experimental group (Fig. S4G). Error bars represent the mean ± SEM of 2-3 independent donors. Two-way ANOVA demonstrates significant differences in mean exhaustion signature gene expression between Always ON and rested conditions on D15. (G) Unbiased principal component analysis of D15 cells. (H) Heatmap and hierarchical clustering of the top 500 genes driving principal component 1 (PC1), which identified clusters of exhaustion- and memory-associated genes that change in rested cells. Statistics: B paired two-tailed student’s t test, E and F one- or two-way ANOVA with Dunnett’s multiple comparisons test. *, p<0.05; **, p<0.01; ***, p<0.001; ****, p<0.0001; ns, p>0.05
Figure 4:
Figure 4:. Transient rest reinvigorates exhausted CAR-T cells and improves anti-tumor function.
A) Flow cytometric analysis of HA.28ζ.FKBP CAR expression before and after treatment with shield-1. B) Cytotoxic activity of D15 HA.28ζ.FKBP CAR-T cells from each treatment group against 143B-GL osteosarcoma (1:8 E:T, normalized to t=0). C) IL-2 (left) and IFNγ (right) secretion of D15 HA.28ζ.FKBP CAR-T cells co-cultured with 143B-GL osteosarcoma cells. Data were normalized to Always OFF values. D-E) Flow cytometry analyses after intracellular cytokine staining of CD8+ CAR+ T cells activated with 143B-GL. (D) shows SPICE analysis from 1 representative donor and (E) shows polyfunctionality. F-G) IL-2 and IFNγ secretion in response to crosslinking with increasing concentrations of immobilized 1A7 anti-CAR idiotype antibody for 24 hours. (F) shows non-linear dose-response curves and (G) shows IL-2 secretion in response to low density (1.25 μg/mL) idiotype where secretion levels were normalized to Always OFF. H-I) 1-2x10⁶ HA.28ζ.ecDHFR CAR-T cells expanded for 15 days in vitro (as depicted in Fig. 4A) (H) were infused IV 7 days post-engraftment of 1x10⁶ Nalm6-GD2 leukemia cells. Mice were dosed 200 mg/kg TMP 6 days/week. (I) Bioluminescent imaging of tumor growth 30 days post-engraftment. Error bars represent mean ± SEM of 3-5 mice from 1 representative experiment (n=3 independent experiments). In B and F error bars represent mean ± SD of 3 triplicate wells from one representative donor (n=3 donors). Error bars represent mean ± SEM of 4-6 individual donors in C and of 3 donors in E and G. Statistics: B, C, E, G one or two-way ANOVA with Dunnett’s multiple comparisons test, I Mann-Whitney test. *, p<0.05; **, p<0.01; ****, p<0.0001; ns, p>0.05
Figure 5:
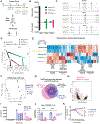
Figure 5:. Rested CAR-T cells exhibit wholescale remodeling of the exhaustion-associated epigenome.
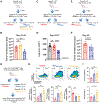
A) Experimental design and sample processing for ATAC-seq analyses. B) Peak accessibility changes between timepoints calculated based on p adjusted<0.05. Merged data from 2-3 donors is shown. C) Accessibility profiles in the ENTPD1, BATF, and TCF7 loci on D15. Representative donor (n=2-3 donors). D) Unbiased PCA of chromatin accessibility assessed across all timepoints. Green and magenta arrows indicate global epigenetic remodeling upon rest. Dashed boxes indicate D15 samples. Each dot represents merged data from 2-3 donors. E) Hierarchical clustering of differentially accessible TF motifs in D15 samples. The heatmap was generated using merged data from 2-3 donors. F-H) H3K27me3 chromatin immunoprecipitation sequencing on D15 CD8+ CAR-T cells (n=3 donors) from Always ON, Always OFF, and RestedD11-15 CAR-T cells treated with 0.1-1 μM (F) or 1 μM (G-K) tazemetostat (EZH2i) or vehicle from D11-15. F) PCA across all treatment groups. G) Venn diagrams showing differentially decreased H3K27me3 peaks in EZH2i-treated samples compared to vehicle. Numbers indicate unique peaks. H) Volcano plot of differentially decreased H3K27me3 peaks (filtered for p(adjusted)<0.05) in EZH2i-treated RestedD11-15 cells compared to controls. I) IL-2 secretion in CAR-T cells treated with increasing concentrations of tazemetostat in response to Nalm6-GD2 (mean ± SD of triplicate wells from 1 representative donor of n=4 donors). J) IL-2 secretion in response to Nalm6-GD2 or 143B-GL normalized to vehicle controls (mean ± SEM of n=7 individual donors). K) Cytotoxic activity against 143B-GL tumor (1:4 E:T, normalized to t=0). Mean of triplicate wells from 1 representative donor is shown (n=3 donors). Statistics: two-way ANOVA with Bonferroni’s (J) or Dunnett’s (K) multiple comparisons test. **, p<0.01; ****, p<0.0001; ns, p>0.05
Figure 6:
Figure 6:. Reinvigoration of exhausted CAR-T cells using the Src kinase inhibitor dasatinib.
A) Mice engrafted with Nalm6-GD2 were treated with D15 HA.28ζ CAR-T cells expanded in vitro in vehicle or dasatinib (4-11 days). Bioluminescent imaging of tumor growth (left) and survival curves (right) (p<0.0001 log-rank Mantel-Cox test) from a representative experiment (3 individual experiments, n=5 mice/group). B) HA.28ζ CAR-T cells were cultured with vehicle (red) or dasatinib (blue) for 3-21 days and collected on indicated days for further analysis. C-D) D25 flow cytometric analysis of (C) exhaustion and memory markers and (D) exhaustion- and stemness-associated transcription factors. Representative donor of 3 donors. E) Cytotoxicity of D25 CAR-T cells co-cultured with Nalm6-GD2 leukemia (1:4 E:T, normalized to t=0). F) D25 IL-2 and IFNγ secretion in response to Nalm6-GD2 leukemia. G) D15, D18, D22, and D25 IL-2 and IFNγ secretion levels in response to Nalm6-GD2 leukemia normalized to DasatinibD4-25 for each individual timepoint and plotted based on the number of days of dasatinib treatment. Graphs display data from 4-5 donors (IL-2, n=63 data points. IFNγ, n=85 data points) and a simple linear regression with 95% confidence intervals. D15 IL-2 and IFNγ data from one donor was not assessed. D18 IL-2 from one donor was excluded due to technical artifacts. H-I) HA.28ζ CAR-T cells were cultured with vehicle or dasatinib for 7 or 24 days starting on D46 or D29, respectively. (H) Cytotoxic activity of D53 CAR-T cells co-cultured with 143B-GL (1:2 E:T, normalized to t=0). (I) D53 IL-2 and IFNγ secretion in response to Nalm6-GD2 leukemia (mean ± SEM of 3 donors). In B-I Dasatinib was removed 16 hours prior to tumor challenge. In E, F and H error bars represent mean ± SD of triplicate wells from 1 representative donor (n=3 donors). Statistics: E (last timepoint) one-way ANOVA and Bonferroni multiple comparisons test, I paired or H (last timepoint) unpaired two-tailed student’s t test. *, p<0.05; **, p<0.01; ***, p<0.001; ****, p<0.0001; ns, p>0.05
Figure 7:
Figure 7:. Intermittent CAR-T cell rest mitigates exhaustion and prolongs anti-tumor responses in vivo.
A-B) Mice engrafted with Nalm6 leukemia and treated with CD19.BBζ CAR-T cells were (A) dosed with vehicle (red), dasatinib twice daily in a 3 day on/4 day off pulsed schedule (blue), or dasatinib every other day from D11-21 (green) (12 total doses/mouse for each condition). (B) D41-45 bioluminescence imaging of tumor growth (2 individual experiments, n=9-10 mice/group). C-D) Mice engrafted with 143B-GL osteosarcoma cells and treated with GD2.BBζ CAR-T cells were (C) dosed with vehicle (red) or dasatinib twice daily in a 3 day on/4 day off pulsed schedule (blue). (D) D20-27 caliper measurement of tumor growth (3 individual experiments, n=15 mice/group) E-F) Mice engrafted with Nalm6-GD2 leukemia and treated with GD2.28ζ.ecDHFR CAR-T cells were (E) dosed with TMP continuously (red) or pulsed in a 7 days TMP/7 days OFF schedule (blue). (F) D50 bioluminescence imaging of tumor growth (2 independent experiments, n=10 mice/group from; 1 mouse from each group did not survive until D50 and were thus excluded). G-I) Mice engrafted with 143B-GL osteosarcoma cells and treated with GD2.BBζ CAR-T cells were (G) dosed with vehicle (red) or dasatinib twice daily from D12-18 (green) or D16-18 (blue). Tumor-infiltrating CD8+ CAR-T cells (CAR-TIL) were isolated on D19 and analyzed by flow cytometry for (H) effector and stem memory markers and (I) for degranulation (CD107a+) and TNFα after 6-hour ex vivo stimulation with Nalm6-GD2. Statistics: B and H (Percent TTE-like) Kruskal-Wallis test and Dunn’s multiple comparisons test, D, H (Percent TSCM-like and TCM-like), and I one-way ANOVA and Dunnett’s multiple comparisons test, F Mann-Whitney test. *, p<0.05; **, p<0.01; ***, p<0.001; ****, p<0.0001 ns, p>0.05

Comment in

Similar articles

Cited by

References

    1. Weber EW, Maus MV, Mackall CL, The Emerging Landscape of Immune Cell Therapies. Cell 181, 46–62 (2020). - PMC - PubMed
    1. Lee DW et al., T cells expressing CD19 chimeric antigen receptors for acute lymphoblastic leukaemia in children and young adults: a phase 1 dose-escalation trial. Lancet 385, 517–528 (2015). - PMC - PubMed
    1. Majzner RG, Mackall CL, Clinical lessons learned from the first leg of the CAR T cell journey. Nat Med 25, 1341–1355 (2019). - PubMed
    1. Eyquem J et al., Targeting a CAR to the TRAC locus with CRISPR/Cas9 enhances tumour rejection. Nature 543, 113 (2017). - PMC - PubMed
    1. Fraietta JA et al., Determinants of response and resistance to CD19 chimeric antigen receptor (CAR) T cell therapy of chronic lymphocytic leukemia. Nat Med, 1–9 (2018). - PMC - PubMed

Publication types

MeSH terms