. 2021 Mar 15:12:619209.
doi: 10.3389/fimmu.2021.619209. eCollection 2021.

Wnt Inhibition Sensitizes PD-L1 Blockade Therapy by Overcoming Bone Marrow-Derived Myofibroblasts-Mediated Immune Resistance in Tumors

Affiliations

Wnt Inhibition Sensitizes PD-L1 Blockade Therapy by Overcoming Bone Marrow-Derived Myofibroblasts-Mediated Immune Resistance in Tumors

Tinglei Huang et al. Front Immunol. .

Abstract

Cancer-associated fibroblasts (CAFs) has been recognized as one cause of tumor resistance to immune checkpoint blockade therapy, but the underlying mechanisms still remain elusive. In the present study, a bone marrow-derived CAF (BMF) -rich tumor model is successfully established by subcutaneously mixed inoculation of BMFs and tumor cells into mice and the BMF-mixed tumor xenografts are demonstrated to be resistant to anti-PD-L1 antibody immunotherapy compared to the mere tumor xenografts. In vitro assays via the co-culture system of BMFs and tumor cells indicate that the co-cultured BMFs are induced to overexpress PD-L1, while there is no such a phenomenon in the co-cultured cancer cells. The further knock-out of PD-L1 in BMFs rescues the sensitivity of BMF-mixed tumor xenografts to PD-L1 blockade therapy. Mechanistically, via the microarray assay, we identify that the upregulation of PD-L1 in BMFs stimulated by cancer cells is medicated by the activation of the Wnt/β-catenin signaling pathway in BMFs. Moreover, the administration of Wnt/β-catenin signaling inhibitors, including XAV-939 and Wnt-C59, distinctly inhibits the upregulation of PD-L1 expression in the co-cultured BMFs. The further combination administration of XAV-939 significantly potentiates the therapeutic outcome of PD-L1 blockade therapy in BMF-mixed tumors. In summary, our study demonstrates that Wnt inhibition augments PD-L1 blockade efficacy by overcoming BMF-mediated immunotherapy resistance.

Keywords: Wnt/β-catenin signaling pathway; bone marrow-derived myofibroblasts; cancer-associated fibroblasts; immune checkpoint blockers; immunotherapy resistance; programmed cell death ligand 1.


Conflict of interest statement

The authors declare that the research was conducted in the absence of any commercial or financial relationships that could be construed as a potential conflict of interest.

Figures
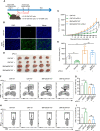
Figure 1
Figure 1
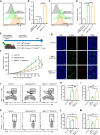
BMFs promote resistance to aPD-L1 immunotherapy by suppressing anti-tumor immune response. (A) Schematic diagram for the therapeutic regimen of anti-PD-L1 antibody in tumor-bearing mice injected subcutaneously with CMT167 cells (5*105) alone or mixed with BMFs (5*105). (B) Representative immunofluorescence staining of aSMA (green) in tumor samples implanted with CMT167 cells alone or CMT167 cells mixed with BMFs. DAPI was stained to visualize cell nuclei. Scale bar = 100 μm. (C–E) Average tumor growth curves (C), the images of tumor tissue dissected from animals (D) as well as individual tumor volume (E) at the end of the study. (F–I) Representative flow cytometry plots (F, H) and quantitative analysis (G, I) of tumor infiltration CD3+CD8+ and CD8+ IFN-γ+ subsets. The data were plotted as means ± SDs (n = 5 per group) and analyzed using two-tailed Student’s t-test for the comparisons between two groups and one-way analysis of variance (ANOVA) with Tukey’s post hoc analysis for multiple comparisons. Differences were considered statistically significant when P < 0.05 (*p < 0.05, **p < 0.01, ns stands for not significant).
Figure 2
Figure 2
BMFs enhance tumor progress by attenuating anti-tumor immune responses in a PD-L1 dependent manner. (A, B) Representative histograms (A) and quantitative analysis (B) displaying the expression level of PD-L1 in BMFs cultured alone or co-cultured with CMT167. The data were plotted as means ± SDs (n = 3 per group). MFI, mean fluorescence intensity. (C, D) Representative histograms (C) and quantitative analysis (D) displaying the expression level of PD-L1 in CMT167 cultured alone or co-cultured with BMFs. The data were plotted as means ± SDs (n = 3 per group). MFI, mean fluorescence intensity. (E) Schematic diagram for the tumor subcutaneous xenograft model of CMT167 cells (5*105) injected alone or mixed with BMFs (5*105) or BMFsPD-L1-KO (5*105). (F) Average tumor growth curves from animals of the study. The data were plotted as means ± SDs (n = 5 per group). (G–I) Representative immunofluorescence staining image (G) and quantitative analysis (H, I) of aSMA+ (green) and CD8+ (red) cells in tumor samples injected with CMT167 cells alone or mixed with BMFs or BMFsPD-L1-KO. DAPI was stained to visualize cell nuclei. Scale bar = 50μm. (J–M) Representative flow cytometry plots (J, K) and quantitative analysis (L, M) of tumor infiltrating CD3+CD8+ and CD8+IFN-γ+ T cells. The data were plotted as means ± SDs (n = 5 per group). The data were analyzed using two-tailed Student’s t-test for the comparisons between two groups and one-way analysis of variance (ANOVA) with Tukey’s post hoc analysis for multiple comparisons. Differences were considered statistically significant when P < 0.05 (*p < 0.05, **p < 0.01, ***p < 0.001, and ****p < 0.0001. ns stands for not significant).
Figure 3
Figure 3
Knockout of PD-L1 in BMFs potentiates the PD-L1 blockade immunotherapy in BMF-rich tumors. (A) Schematic diagram for the therapeutic regimen of anti-PD-L1 antibody in tumor-bearing mice subcutaneously injected with CMT167 cells (5*105) mixed with BMFsPD-L1-KO (5*105), followed by treatments with isotype control antibody or aPD-L1 antibody. (B, C) Average tumor growth curves(B) and individual tumor volume (C) of tumor tissue dissected from animals at the end of the study. (D) The tumor inhibitory rate of aPD-L1 immunotherapy in tumor xenografts implanted with CMT167 alone, CMT167 mixed with BMFs and CMT167 mixed with BMFsPD-L1-KO. (E–H) Representative flow cytometry plots (E, F) and quantitative analysis (G, H) of tumor infiltration CD3+CD8+ and CD8+ IFN-γ+ T cell. The data were plotted as means ± SDs (n = 5 per group) and analyzed using two-tailed Student’s t-test for the comparisons between two groups and one-way analysis of variance (ANOVA) with Tukey’s post hoc analysis for multiple comparisons. Differences were considered statistically significant when P < 0.05 (*p < 0.05, **p < 0.01, ns stands for not significant).
Figure 4
Figure 4
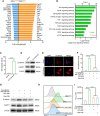
Tumor cell spur the PD-L1 express of BMFs by stimulating wnt/β-catenin signaling pathway. (A) The 20 most up-regulated and down-regulated genes from the microarray results of BMFs co-cultured with tumor cells vs. BMFs cultured alone. (B) Gene ontology analysis indicates significantly changed canonical pathways in BMFs after the co-culturing with tumor cells, (DAVID Bioinformatics Resources 6.8). (C) Relative Wnt reporter activity of BMFs cells cultured alone or co-cultured with CMT167. (D) Representative immunoblotting result of β-catenin and CylinD1 in BMFs cultured alone or co-cultured with CMT167. β-actin was used as the loading control. (E) Representative image of β-catenin (red) immunofluorescence staining in BMFs cultured alone or co-cultured with CMT167. DAPI was stained to visualize cell nuclei. Scale bar = 10 μm. (F–I) Relative Wnt reporter activity (F), representative immunoblotting result of b-catenin, CylinD1 and b-actin (G) and PDL1 express level measured by flow cytometry (H, I) in BMFs cells cultured alone or co-cultured with CMT167 while the co-cultured group treated with 939(1 mM)/Wnt-C59(5 mM) or not. MFI, mean fluorescence intensity. Representative results were from one of at least three independent experiments. The data were plotted as means ± SDs (n = 3 per group) and analyzed using two-tailed Student’s t-test for the comparisons between two groups and one-way analysis of variance (ANOVA) with Tukey’s post hoc analysis for multiple comparisons. Differences were considered statistically significant when P < 0.05 (***p < 0.001, and ****p < 0.0001).
Figure 5
Figure 5
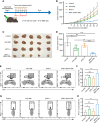
Wnt/β-catenin inhibitor XAV-939 boost the efficacy of aPD-L1 immunotherapy in BMF-rich tumors. (A) Schematic diagram for the therapeutic regimen of aPD-L1 antibody combined with XAV-939 in tumor-bearing mice injected subcutaneously with CMT167 cells (5*105) mixed with BMFs (5*105). (B–D) Average tumor growth curves (B), the images of tumor tissue dissected from animals (C) as well as individual tumor volume (D) at the end of the study. (E–H) Representative flow cytometry plots (E, G) and quantitative analysis (F, H) of tumor infiltration CD3+CD8+ and CD8+ IFN-γ+ T cell. The data were plotted as means ± SDs (n = 5 per group). The data were analyzed using two-tailed Student’s t-test for the comparisons between two groups and one-way analysis of variance (ANOVA) with Tukey’s post hoc analysis for multiple comparisons. Differences were considered statistically significant when P < 0.05 (*p < 0.05, **p < 0.01, ***p < 0.001, and ****p < 0.0001. ns stands for not significant).
Figure 6
Figure 6
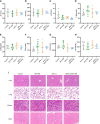
Safety evaluation of therapeutic regimen of aPD-L1 antibody combined with XAV-939. (A–H) The level of ALT (A), AST (B), r-GT (C), T-Bil (D), BUN (E), SCr (F), LDH-L (G), and CK-MB (H) in the serum of tumor-bearing mice at the endpoint of the therapeutic study illustrated in Figure 5A (n = 5, data presented as means ± SDs). (I) Representative H&E-stained images of heart, kidney, liver and lung from mice of each group at the endpoint of the therapeutic study illustrated in Figure 5A . Scale bar = 50 µm.

Similar articles

Cited by

References

    1. Galluzzi L, Chan TA, Kroemer G, Wolchok JD, Lopez-Soto A. The hallmarks of successful anticancer immunotherapy. Sci Transl Med (2018) 10(459):eaat7807. 10.1126/scitranslmed.aat7807 - DOI - PubMed
    1. Topalian SL, Drake CG, Pardoll DM. Immune checkpoint blockade: a common denominator approach to cancer therapy. Cancer Cell (2015) 27(4):450–61. 10.1016/j.ccell.2015.03.001 - DOI - PMC - PubMed
    1. Robert C, Long GV, Brady B, Dutriaux C, Maio M, Mortier L, et al. . Nivolumab in previously untreated melanoma without BRAF mutation. N Engl J Med (2015) 372(4):320–30. 10.1056/NEJMoa1412082 - DOI - PubMed
    1. Ran X, Yang K. Inhibitors of the PD-1/PD-L1 axis for the treatment of head and neck cancer: current status and future perspectives. Drug Des Devel Ther (2017) 11:2007–14. 10.2147/dddt.S140687 - DOI - PMC - PubMed
    1. Yeo MK, Choi SY, Seong IO, Suh KS, Kim JM, Kim KH. Association of PD-L1 expression and PD-L1 gene polymorphism with poor prognosis in lung adenocarcinoma and squamous cell carcinoma. Hum Pathol (2017) 68:103–11. 10.1016/j.humpath.2017.08.016 - DOI - PubMed

Publication types

MeSH terms