Development and validation for prognostic nomogram of epithelial ovarian cancer recurrence based on circulating tumor cells and epithelial-mesenchymal transition
- PMID: 33753862
- PMCID: PMC7985206
- DOI: 10.1038/s41598-021-86122-4
Development and validation for prognostic nomogram of epithelial ovarian cancer recurrence based on circulating tumor cells and epithelial-mesenchymal transition
Abstract
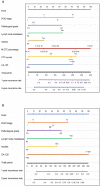
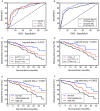
We aimed to determine the prognosis value of circulating tumor cells (CTCs) undergoing epithelial-mesenchymal transition in epithelial ovarian cancer (EOC) recurrence. We used CanPatrol CTC-enrichment technique to detect CTCs from blood samples and classify subpopulations into epithelial, mesenchymal, and hybrids. To construct nomogram, prognostic factors were selected by Cox regression analysis. Risk stratification was performed through Kaplan-Meier analysis among the training group (n = 114) and validation group (n = 38). By regression screening, both CTC counts (HR 1.187; 95% CI 1.098-1.752; p = 0.012) and M-CTC (HR 1.098; 95% CI 1.047-1.320; p = 0.009) were demonstrated as independent factors for recurrence. Other variables including pathological grade, FIGO stage, lymph node metastasis, ascites, and CA-125 were also selected (p < 0.005) to construct nomogram. The C-index of internal and external validation for nomogram was 0.913 and 0.874. We found significant predictive values for the nomogram with/without CTCs (AUC 0.8705 and 0.8097). Taking CTC counts and M-CTC into separation, the values were 0.8075 and 0.8262. Finally, survival curves of risk stratification based on CTC counts (p = 0.0241), M-CTC (p = 0.0107), and the nomogram (p = 0.0021) were drawn with significant differences. In conclusion, CTCs could serve as a novel factor for EOC prognosis. Nomogram model constructed by CTCs and other clinical parameters could predict EOC recurrence and perform risk stratification for clinical decision-making.Trial registration Chinese Clinical Trial Registry, ChiCTR-DDD-16009601, October 25, 2016.
Conflict of interest statement
The authors declare no competing interests.
Figures


Similar articles
-
Establishment and verification of the nomogram that predicts the 3-year recurrence risk of epithelial ovarian carcinoma.BMC Cancer. 2020 Sep 29;20(1):938. doi: 10.1186/s12885-020-07402-2. BMC Cancer. 2020. PMID: 32993522 Free PMC article.
-
The prognostic and therapeutic implications of circulating tumor cell phenotype detection based on epithelial-mesenchymal transition markers in the first-line chemotherapy of HER2-negative metastatic breast cancer.Cancer Commun (Lond). 2019 Jan 3;39(1):1. doi: 10.1186/s40880-018-0346-4. Cancer Commun (Lond). 2019. PMID: 30606259 Free PMC article. Clinical Trial.
-
Circulating tumor cell phenotype detection based on epithelial-mesenchymal transition markers combined with clinicopathological risk has potential to better predict recurrence in stage III breast cancer treated with neoadjuvant chemotherapy: a pilot study.Breast Cancer Res Treat. 2024 Oct;207(3):517-527. doi: 10.1007/s10549-024-07430-7. Epub 2024 Jul 11. Breast Cancer Res Treat. 2024. PMID: 38990453
-
Current and future role of circulating tumor cells in patients with epithelial ovarian cancer.Eur J Surg Oncol. 2016 Dec;42(12):1772-1779. doi: 10.1016/j.ejso.2016.05.010. Epub 2016 May 25. Eur J Surg Oncol. 2016. PMID: 27265041 Review.
-
Circulating Tumor Cells and Implications of the Epithelial-to-Mesenchymal Transition.Adv Clin Chem. 2018;83:121-181. doi: 10.1016/bs.acc.2017.10.004. Epub 2017 Dec 21. Adv Clin Chem. 2018. PMID: 29304900 Review.
Cited by
-
High-Grade Serous Ovarian Cancer-A Risk Factor Puzzle and Screening Fugitive.Biomedicines. 2024 Jan 19;12(1):229. doi: 10.3390/biomedicines12010229. Biomedicines. 2024. PMID: 38275400 Free PMC article. Review.
-
Potential clinical utility of liquid biopsies in ovarian cancer.Mol Cancer. 2022 May 11;21(1):114. doi: 10.1186/s12943-022-01588-8. Mol Cancer. 2022. PMID: 35545786 Free PMC article. Review.
-
Development and External Validation of a Novel Model for Predicting Postsurgical Recurrence and Overall Survival After Cytoreductive R0 Resection of Epithelial Ovarian Cancer.Front Oncol. 2022 Mar 23;12:859409. doi: 10.3389/fonc.2022.859409. eCollection 2022. Front Oncol. 2022. PMID: 35402239 Free PMC article.
-
Advances and challenges in the use of liquid biopsy in gynaecological oncology.Heliyon. 2024 Oct 15;10(20):e39148. doi: 10.1016/j.heliyon.2024.e39148. eCollection 2024 Oct 30. Heliyon. 2024. PMID: 39492906 Free PMC article. Review.
-
Predictive Value of Circulating Tumor Cells in Prognosis of Stage III/IV Colorectal Cancer After Oxaliplatin-based First-line Chemotherapy.In Vivo. 2022 Mar-Apr;36(2):806-813. doi: 10.21873/invivo.12767. In Vivo. 2022. PMID: 35241536 Free PMC article.
References
Publication types
MeSH terms
Substances
LinkOut - more resources
Full Text Sources
Other Literature Sources
Research Materials
Miscellaneous

