

Antibody testing for COVID-19: A report from the National COVID Scientific Advisory Panel
- PMID: 33748431
- PMCID: PMC7941096
- DOI: 10.12688/wellcomeopenres.15927.1
Antibody testing for COVID-19: A report from the National COVID Scientific Advisory Panel
Abstract
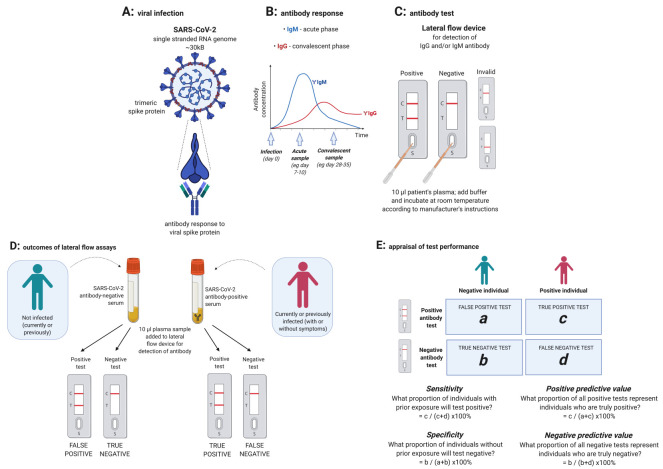
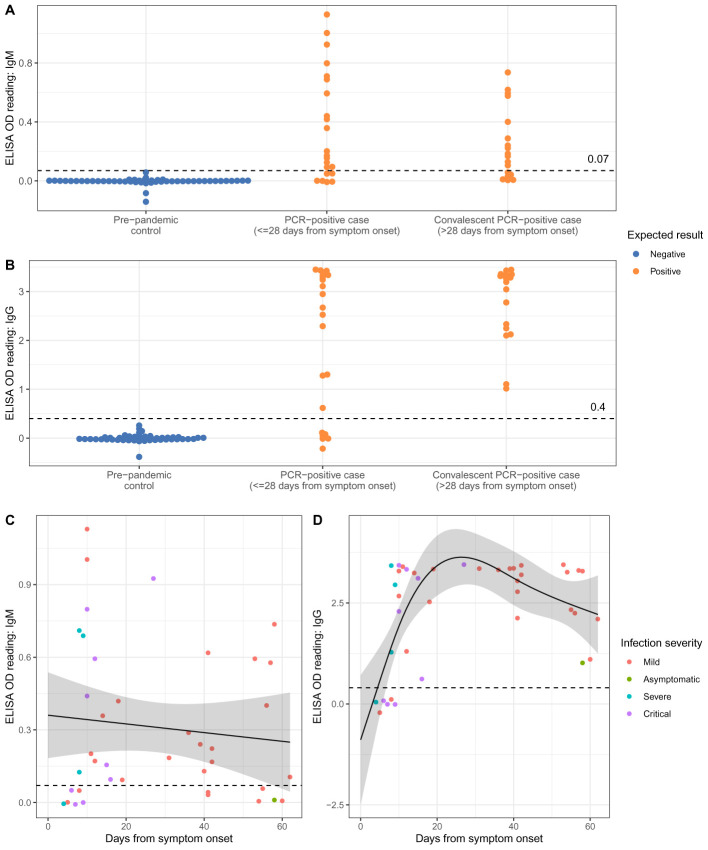
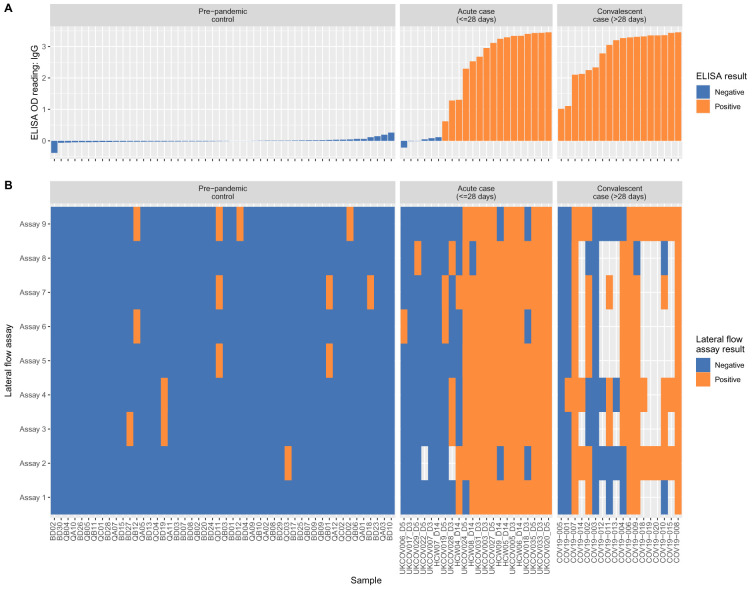
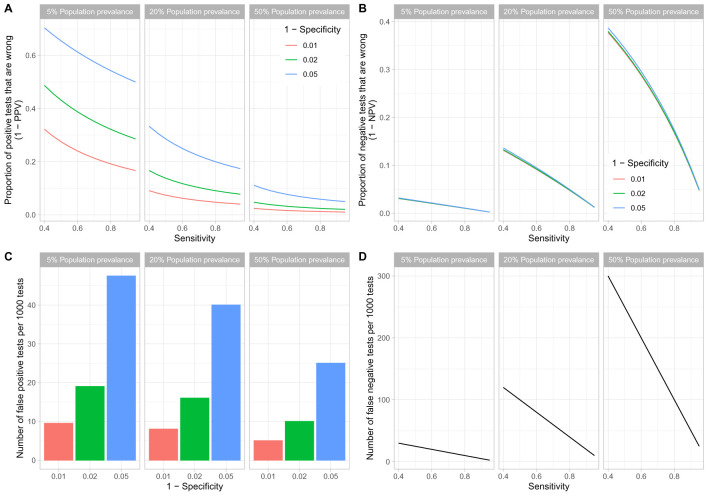
Background: The COVID-19 pandemic caused >1 million infections during January-March 2020. There is an urgent need for reliable antibody detection approaches to support diagnosis, vaccine development, safe release of individuals from quarantine, and population lock-down exit strategies. We set out to evaluate the performance of ELISA and lateral flow immunoassay (LFIA) devices. Methods: We tested plasma for COVID (severe acute respiratory syndrome coronavirus 2; SARS-CoV-2) IgM and IgG antibodies by ELISA and using nine different LFIA devices. We used a panel of plasma samples from individuals who have had confirmed COVID infection based on a PCR result (n=40), and pre-pandemic negative control samples banked in the UK prior to December-2019 (n=142). Results: ELISA detected IgM or IgG in 34/40 individuals with a confirmed history of COVID infection (sensitivity 85%, 95%CI 70-94%), vs. 0/50 pre-pandemic controls (specificity 100% [95%CI 93-100%]). IgG levels were detected in 31/31 COVID-positive individuals tested ≥10 days after symptom onset (sensitivity 100%, 95%CI 89-100%). IgG titres rose during the 3 weeks post symptom onset and began to fall by 8 weeks, but remained above the detection threshold. Point estimates for the sensitivity of LFIA devices ranged from 55-70% versus RT-PCR and 65-85% versus ELISA, with specificity 95-100% and 93-100% respectively. Within the limits of the study size, the performance of most LFIA devices was similar. Conclusions: Currently available commercial LFIA devices do not perform sufficiently well for individual patient applications. However, ELISA can be calibrated to be specific for detecting and quantifying SARS-CoV-2 IgM and IgG and is highly sensitive for IgG from 10 days following first symptoms.
Keywords: COVID-19; ELISA; IgG; IgM; SARS-CoV-2; antibodies; epidemiology; exposure; immunoassay; lateral flow; serology.
Copyright: © 2020 Adams ER et al.
Conflict of interest statement
Competing interests: RC reports personal fees and other from MIROBIO Ltd, outside the submitted work. DWE reports personal fees from Gilead, outside the submitted work. SH reports grants from NIHR, during the conduct of the study. AJP reports grants from NIHR Oxford Biomedical Research Centre, outside the submitted work; and AJP is Chair of UK Dept. Health and Social Care’s (DHSC) Joint Committee on Vaccination & Immunisation (JCVI) and is a member of the WHO’s SAGE. The views expressed in this article do not necessarily represent the views of DHSC, JCVI, NIHR or WHO. GRS reports personal fees from GSK Vaccines SAB. MGS reports grants from National Institute of Health Research, grants from Medical Research Council UK, grants from Health Protection Research Unit in Emerging & Zoonotic Infections, University of Liverpool, during the conduct of the study; other from Integrum Scientific LLC, Greensboro, NC, USA, outside the submitted work. ASW reports grants from NIHR, during the conduct of the study. No other author has a conflict of interest to declare.
Figures
Similar articles
-
Assessment of SARS-CoV-2 IgG and IgM antibody detection with a lateral flow immunoassay test.Heliyon. 2021 Oct;7(10):e08192. doi: 10.1016/j.heliyon.2021.e08192. Epub 2021 Oct 19. Heliyon. 2021. PMID: 34693063 Free PMC article.
-
Assessment of SARS-CoV-2 serological tests for the diagnosis of COVID-19 through the evaluation of three immunoassays: Two automated immunoassays (Euroimmun and Abbott) and one rapid lateral flow immunoassay (NG Biotech).J Clin Virol. 2020 Aug;129:104511. doi: 10.1016/j.jcv.2020.104511. Epub 2020 Jun 15. J Clin Virol. 2020. PMID: 32593133 Free PMC article.
-
Evaluation of a Lateral Flow Immunoassay COVIDTECH® SARS-CoV-2 IgM/IgG Antibody Rapid Test.Jpn J Infect Dis. 2022 Jul 22;75(4):334-340. doi: 10.7883/yoken.JJID.2021.273. Epub 2021 Dec 28. Jpn J Infect Dis. 2022. PMID: 34980703
-
A systematic and meta-analysis review on the diagnostic accuracy of antibodies in the serological diagnosis of COVID-19.Syst Rev. 2021 May 26;10(1):155. doi: 10.1186/s13643-021-01689-3. Syst Rev. 2021. PMID: 34039423 Free PMC article. Review.
-
Development and Efficacy of Lateral Flow Point-of-Care Testing Devices for Rapid and Mass COVID-19 Diagnosis by the Detections of SARS-CoV-2 Antigen and Anti-SARS-CoV-2 Antibodies.Diagnostics (Basel). 2021 Sep 24;11(10):1760. doi: 10.3390/diagnostics11101760. Diagnostics (Basel). 2021. PMID: 34679458 Free PMC article. Review.
Cited by
-
Using serological data to understand unobserved SARS-CoV-2 risk in health-care settings.Lancet Infect Dis. 2020 Dec;20(12):1351-1352. doi: 10.1016/S1473-3099(20)30579-X. Epub 2020 Aug 3. Lancet Infect Dis. 2020. PMID: 32758436 Free PMC article. No abstract available.
-
Rapid point-of-care testing for COVID-19: quality of supportive information for lateral flow serology assays.BMJ Open. 2021 Mar 19;11(3):e047163. doi: 10.1136/bmjopen-2020-047163. BMJ Open. 2021. PMID: 33741675 Free PMC article.
-
Characteristics of Anti-SARS-CoV-2 Antibodies in Recovered COVID-19 Subjects.Viruses. 2021 Apr 16;13(4):697. doi: 10.3390/v13040697. Viruses. 2021. PMID: 33923828 Free PMC article.
-
The real life performance of 7 automated anti-SARS-CoV-2 IgG and IgM/IgA immunoassays.Pract Lab Med. 2021 May;25:e00212. doi: 10.1016/j.plabm.2021.e00212. Epub 2021 Mar 13. Pract Lab Med. 2021. PMID: 33748381 Free PMC article.
-
The prevalence of SARS-CoV-2 antibodies within the community of a private tertiary university in the Philippines: A serial cross sectional study.PLoS One. 2022 Dec 5;17(12):e0268145. doi: 10.1371/journal.pone.0268145. eCollection 2022. PLoS One. 2022. PMID: 36469505 Free PMC article.
References
-
- World Health Organisation: Coronavirus disease (COVID-19) Situation Dashboard.2020. [Cited 2020 Mar 31]. Reference Source
-
- Public Health England: Guidance and standard operating procedure COVID-19 virus testing in NHS laboratories.2020. [Cited 2020, April 10]. Reference Source
Associated data
Grants and funding
LinkOut - more resources
Full Text Sources
Other Literature Sources
Miscellaneous
