Increased mortality in community-tested cases of SARS-CoV-2 lineage B.1.1.7
- PMID: 33723411
- PMCID: PMC9170116
- DOI: 10.1038/s41586-021-03426-1
Increased mortality in community-tested cases of SARS-CoV-2 lineage B.1.1.7
Abstract
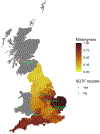
SARS-CoV-2 lineage B.1.1.7, a variant that was first detected in the UK in September 20201, has spread to multiple countries worldwide. Several studies have established that B.1.1.7 is more transmissible than pre-existing variants, but have not identified whether it leads to any change in disease severity2. Here we analyse a dataset that links 2,245,263 positive SARS-CoV-2 community tests and 17,452 deaths associated with COVID-19 in England from 1 November 2020 to 14 February 2021. For 1,146,534 (51%) of these tests, the presence or absence of B.1.1.7 can be identified because mutations in this lineage prevent PCR amplification of the spike (S) gene target (known as S gene target failure (SGTF)1). On the basis of 4,945 deaths with known SGTF status, we estimate that the hazard of death associated with SGTF is 55% (95% confidence interval, 39-72%) higher than in cases without SGTF after adjustment for age, sex, ethnicity, deprivation, residence in a care home, the local authority of residence and test date. This corresponds to the absolute risk of death for a 55-69-year-old man increasing from 0.6% to 0.9% (95% confidence interval, 0.8-1.0%) within 28 days of a positive test in the community. Correcting for misclassification of SGTF and missingness in SGTF status, we estimate that the hazard of death associated with B.1.1.7 is 61% (42-82%) higher than with pre-existing variants. Our analysis suggests that B.1.1.7 is not only more transmissible than pre-existing SARS-CoV-2 variants, but may also cause more severe illness.
Figures


Update of
-
Increased mortality in community-tested cases of SARS-CoV-2 lineage B.1.1.7.medRxiv [Preprint]. 2021 Mar 5:2021.02.01.21250959. doi: 10.1101/2021.02.01.21250959. medRxiv. 2021. Update in: Nature. 2021 May;593(7858):270-274. doi: 10.1038/s41586-021-03426-1 PMID: 33564794 Free PMC article. Updated. Preprint.
Similar articles
-
Increased mortality in community-tested cases of SARS-CoV-2 lineage B.1.1.7.medRxiv [Preprint]. 2021 Mar 5:2021.02.01.21250959. doi: 10.1101/2021.02.01.21250959. medRxiv. 2021. Update in: Nature. 2021 May;593(7858):270-274. doi: 10.1038/s41586-021-03426-1 PMID: 33564794 Free PMC article. Updated. Preprint.
-
Risk of hospital admission for patients with SARS-CoV-2 variant B.1.1.7: cohort analysis.BMJ. 2021 Jun 15;373:n1412. doi: 10.1136/bmj.n1412. BMJ. 2021. PMID: 34130987 Free PMC article.
-
Mortality and critical care unit admission associated with the SARS-CoV-2 lineage B.1.1.7 in England: an observational cohort study.Lancet Infect Dis. 2021 Nov;21(11):1518-1528. doi: 10.1016/S1473-3099(21)00318-2. Epub 2021 Jun 23. Lancet Infect Dis. 2021. PMID: 34171232 Free PMC article.
-
Assessing transmissibility of SARS-CoV-2 lineage B.1.1.7 in England.Nature. 2021 May;593(7858):266-269. doi: 10.1038/s41586-021-03470-x. Epub 2021 Mar 25. Nature. 2021. PMID: 33767447
-
A particle swarm optimization approach for predicting the number of COVID-19 deaths.Sci Rep. 2021 Aug 16;11(1):16587. doi: 10.1038/s41598-021-96057-5. Sci Rep. 2021. PMID: 34400735 Free PMC article. Review.
Cited by
-
Tackling COVID-19 with neutralizing monoclonal antibodies.Cell. 2021 Jun 10;184(12):3086-3108. doi: 10.1016/j.cell.2021.05.005. Epub 2021 May 26. Cell. 2021. PMID: 34087172 Free PMC article. Review.
-
Homologous and heterologous booster vaccinations of S-268019-b, a recombinant S protein-based vaccine with a squalene-based adjuvant, enhance neutralization breadth against SARS-CoV-2 Omicron subvariants in cynomolgus macaques.Vaccine. 2022 Dec 12;40(52):7520-7525. doi: 10.1016/j.vaccine.2022.10.092. Epub 2022 Nov 8. Vaccine. 2022. PMID: 36372670 Free PMC article.
-
Classification of SARS-CoV-2 sequences as recombinants via a pre-trained CNN and identification of a mathematical signature relative to recombinant feature at Spike, via interpretability.PLoS One. 2024 Aug 26;19(8):e0309391. doi: 10.1371/journal.pone.0309391. eCollection 2024. PLoS One. 2024. PMID: 39186542 Free PMC article.
-
Problems associated with antiviral drugs and vaccines development for COVID-19: approach to intervention using expression vectors via GPI anchor.Nucleosides Nucleotides Nucleic Acids. 2021;40(6):665-706. doi: 10.1080/15257770.2021.1914851. Epub 2021 May 13. Nucleosides Nucleotides Nucleic Acids. 2021. PMID: 33982646 Free PMC article. Review.
-
Lack of detail in population-level data impedes analysis of SARS-CoV-2 variants of concern and clinical outcomes.Lancet Infect Dis. 2021 Sep;21(9):1195-1197. doi: 10.1016/S1473-3099(21)00201-2. Epub 2021 Apr 12. Lancet Infect Dis. 2021. PMID: 33857407 Free PMC article. No abstract available.
References
-
- Chand M et al. Investigation of Novel SARS-COV-2 Variant: Variant of Concern 202012/01. Technical Briefing 1 https://assets.publishing.service.gov.uk/govemment/uploads/system/upload... (Public Health England, 2020).
-
- McLennan D et al. English Indices of Deprivation 2019. https://www.gov.uk/government/publications/english-indices-of-deprivatio... (Ministry of Housing, Communities & Local Government; 2019).
-
- Cox DR Regression models and life-tables. J. R. Stat. Soc. B 34, 187–202 (1972).
-
- Seaman SR & White IR Review of inverse probability weighting for dealing with missing data. Stat. Methods Med. Res 22, 278–295 (2013). - PubMed
Publication types
MeSH terms
Grants and funding
LinkOut - more resources
Full Text Sources
Other Literature Sources
Medical
Miscellaneous

