. 2021 Apr;592(7853):309-314.
doi: 10.1038/s41586-021-03314-8. Epub 2021 Mar 10.

A high-resolution protein architecture of the budding yeast genome

Affiliations

A high-resolution protein architecture of the budding yeast genome

Matthew J Rossi et al. Nature. 2021 Apr.

Abstract

The genome-wide architecture of chromatin-associated proteins that maintains chromosome integrity and gene regulation is not well defined. Here we use chromatin immunoprecipitation, exonuclease digestion and DNA sequencing (ChIP-exo/seq)1,2 to define this architecture in Saccharomyces cerevisiae. We identify 21 meta-assemblages consisting of roughly 400 different proteins that are related to DNA replication, centromeres, subtelomeres, transposons and transcription by RNA polymerase (Pol) I, II and III. Replication proteins engulf a nucleosome, centromeres lack a nucleosome, and repressive proteins encompass three nucleosomes at subtelomeric X-elements. We find that most promoters associated with Pol II evolved to lack a regulatory region, having only a core promoter. These constitutive promoters comprise a short nucleosome-free region (NFR) adjacent to a +1 nucleosome, which together bind the transcription-initiation factor TFIID to form a preinitiation complex. Positioned insulators protect core promoters from upstream events. A small fraction of promoters evolved an architecture for inducibility, whereby sequence-specific transcription factors (ssTFs) create a nucleosome-depleted region (NDR) that is distinct from an NFR. We describe structural interactions among ssTFs, their cognate cofactors and the genome. These interactions include the nucleosomal and transcriptional regulators RPD3-L, SAGA, NuA4, Tup1, Mediator and SWI-SNF. Surprisingly, we do not detect interactions between ssTFs and TFIID, suggesting that such interactions do not stably occur. Our model for gene induction involves ssTFs, cofactors and general factors such as TBP and TFIIB, but not TFIID. By contrast, constitutive transcription involves TFIID but not ssTFs engaged with their cofactors. From this, we define a highly integrated network of gene regulation by ssTFs.


Conflict of interest statement

Competing Interests. The authors declare the following competing interests: B.F.P. has a financial interest in Peconic, LLC, which offers the ChIP-exo technology (US Patent 20100323361A1) implemented in this study as a commercial service and could potentially benefit from the outcomes of this research. The remaining authors declare no competing interests.

Figures

Extended Data Fig. 1 |
Extended Data Fig. 1 |. ChIP-exo targets within meta-assemblages.
a, Simplified view of transcriptional regulation. A TF (e.g., Gal4) binds to its cognate motif (UAS) within promoters in competition with chromatin/nucleosomes (red line). The TF recruits cofactors (e.g., SAGA and Mediator) that assist in PIC (TBP, TFIIB, etc.) and Pol II assembly (green arrow) at the transcript start site (TSS) of genes. Pol II then traverses the gene to the transcript end site (TES). b, Schematic of the ChIP-exo assay. Proteins are crosslinked to DNA, which is then fragmented. Specific proteins are captured through an engineered TAP tag that is captured by the common Fc region of any IgG. Near-bp resolution is achieved via strand-specific lambda exonuclease. c, Pie chart of assayed targets separated by broad GO-based classifications (inner), or by UMAP clustering labels of genome-wide binding locations (outer). The list reports the common names of ChIP-exo targets that generated significantly enriched locations, grouped by their UMAP/Kmeans-derived meta-assemblage abbreviations (along with membership count), which are further grouped by simplified Gene Ontology categories (also shown as a pie chart). See also Supplementary Data 22H.
Extended Data Fig. 2 |
Extended Data Fig. 2 |. Yeastepigenome.org data visualization and discovery.
Shown is an example web browser view at yeastepigenome.org of ChIP-exo occupancy patterns for all targets (e.g., Reb1) around pre-defined genomic features. Rows are sorted by gene or promoter (NFR/NDR) length, or by distance from the indicated reference feature (where x = 0). Promoter classes include (from top to bottom) RP, STM, TFO, UNB, and others. See Supplementary Data 11G,J,C for respective row feature ID, coordinates, and sort order of features that are constant in all target display windows. Lower right (when present) provides strand-separated tag 5’ ends distributed around the protein’s cognate DNA motif, with the motif opposite strand (red) inverted in the composite plot. Corresponding color-coded nucleotide sequences are shown. All images, underlying data values, and datasets can be downloaded through embedded “META DATA” target-specific links at yeastepigenome.org. Each dataset download includes a ReadMe file describing the contents of the download. Warning: Targets with only a single replicate did not pass our significance threshold. See Supplementary Data 11C Internal ID for sort orders that are not provided in the download.
Extended Data Fig. 3 |
Extended Data Fig. 3 |. UMAP granularity.
UMAP projection from Fig. 1c, along with zoomed-in inserts. Labels are 40 Kmeans-based abbreviations (Supplementary Data 21J). For coordinate values for individual targets see Supplementary Data 21C,D.
Extended Data Fig. 4 |
Extended Data Fig. 4 |. Example of data variance among members of a feature class.
Left, Plots report the ChIP-exo patterns for Orc6 and Mcm5. The bold line represents the mean and the dashed lines represent the 5% to 95% Confidence Interval (CI). The CI was calculated for each base pair in the 1 kb window across all ACSs (n=253). Right, heatmaps of Orc6 and Mcm5. Blue indicates ChIP-exo data on the ACS motif strand, and red indicates data on the opposite strand.
Extended Data Fig. 5 |
Extended Data Fig. 5 |. Architecture at classes of Pol II-transcribed regions.
Shown are the top 200 coding (middle), or the top 200 noncoding (bottom) genes (based on Sua7 occupancy). See also Fig. 3c legend. Note that the RP panels are identical to Fig. 3c.
Extended Data Fig. 6 |
Extended Data Fig. 6 |. Architecture at LTRs.
Shown are heatmaps of PIC occupancy for Pol III (TFIIIB – Bdp1 and TBP) and Pol II (TFIIB and TBP) at the five Ty LTR classes, along with the nucleotide composition (−/+100 bp from the LTR start; from yeastepignome.org). Nucleotide sequence: GATC are yellow, red, green, and blue, respectively. All rows are linked and sorted by LTR class, then length.
Extended Data Fig. 7 |
Extended Data Fig. 7 |. Properties of inducible (STM), insulated (TFO), and constitutive (UNB) Pol II promoters.
a, NDRs are nucleosomal in vitro, while NFRs are nucleosome-free. Heat map of in vitro reconstituted MNase H3 nucleosomes (right) aligned by in vivo +1 nucleosome dyads and sorted by distance between the in vivo +1 nucleosome dyad and the first upstream stable nucleosome dyad (in vivo, left). b, Insulator TFs uncouple divergent PIC assembly and transcription. PIC (Sua7) occupancy (100 bp window centered on TSS). Data are presented as mean values +/− SD, from N=6 biologically independent experiments, using two-tailed T-test, no multiple comparisons. RP and STM promoters were merged. c, Insulation at tandem genes. Shown are composite plots of PIC occupancy (green, TFIIB/Sua7 ChIP-exo) for promoter regions sharing an upstream termination region (i.e., tandem genes). Pcf11 as a representative termination factor is shown in light brown, along with TFs (cyan), either collectively (“TF”, top two panels) or individually, as indicated. STM, TFO, and UNB composites are shown. Top 10 insulators are based on the number of genes bound.
Extended Data Fig. 8 |
Extended Data Fig. 8 |. ChIP-exo patterning reveals distinct local TF environments.
a, Shown are strand-separated composite plots of 78 TFs bound at their cognate sites, and grouped by their meta-assemblage label (colored borders). Plots are oriented and centered by motif, and extend from −100 to +100 bp. Patterns were highly penetrant across individual sites for each TF (e.g., see lower right in Extended Data Fig. 2 for Reb1 and yeastepigenome.org for other TFs). b, ChIP-exo composite profiles of individual subunits of the Mediator complex at TF Yrr1 motifs (from −500 to +500), showing consistency of patterning across Mediator subunits.
Extended Data Fig. 9 |
a, Venn diagram of promoters having overlapping locations of STM cofactors (>0 ChExMix calls in dataset SampleIDs listed in Supplementary Data 210A). Z scores for pair-wise overlaps are shown. b, Representative architecture of STM cofactors or PIC components at a consolidated set of TF motifs at 984 STM promoters (not strand-separated; see Methods and Supplementary Data 11AI), and oriented by TSS. c, Frequency distribution of promoters having the indicated GTF/TFIID ratio. Shown are individual GTFs that were averaged in Fig. 5c.
Extended Data Fig. 10 |
Extended Data Fig. 10 |. TF/cofactor interaction “circuits”.
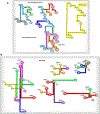
TF genes are indicated with capitalized gene names and are connected to their encoded TFs (spheres). Arrows connect TFs to other TF-encoding genes to which they are bound via their cognate motif. TFs that bound to their own genes or created a loop used blue arrows (light blue where a motif was not detected for TFs binding their own gene). TFs are color-coded based on their meta-assemblage membership (see key). Those TFs that are also particularly enriched with cofactors have colored halos. Short diagonal arrows point to the total number of all ~6,000 coding genes that are bound by that TF to its cognate motif (first number) or where no motif was detected (second number). Average relative PIC (TFIIB/Sua7) occupancy levels for those sets of genes is indicated by (•) count.
Extended Data Fig. 11 |
Extended Data Fig. 11 |. Isolated “circuits”.
a, Colors demarcate series paths. b, Colors emphasize different meta-assemblages as defined in Extended Data Fig. 10.
Fig. 1 |
Fig. 1 |. Genome-wide meta-assemblages.
a, Genomic feature classes with N memberships analyzed (Supplementary Data 11D). Pol II classes are from this study along with relative PIC occupancy levels (•). b, Hierarchical clustering of genome-wide co-localization of 371 targets (Supplementary Data 3). c, UMAP projection of 371 target co-locations (colored based on K-means, Supplementary Data 21C,D).
Fig. 2 |
Fig. 2 |. Architecture at nontranscribed features.
a-c, Averaged distribution of strand-separated ChIP-exo tag 5’ ends (exonuclease stop sites, left to right is 5’−3’) for representative targets around strand-oriented annotated features. Opposite-strand data are inverted (right to left is 5’−3’). The Y-axes are linear arbitrary units (a.u.), which are not comparable in magnitude across different datasets. Nucleosome dyads are H3 MNase paired-end ChIP-seq (strands averaged).
Fig. 3 |
Fig. 3 |. Architecture at transcribed features.
a-d, See Fig. 2. c, Panels are for ribosomal protein genes (RP), showing only the sense strand. Gray arrows are nucleosome dyads.
Fig. 4 |
Fig. 4 |. Classification of inducible, insulated, and constitutive Pol II promoters.
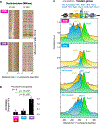
a, Four architectural themes at individual promoters (rows), with black denoting target (columns) binding (Supplementary Data 23). b, Schematic and example composite data for STM, TFO, and UNB classes. “TFs & Cofactors” are a combined set of ChExMix calls for targets labeled as such in Supplementary Data 21K, including TFs, SAGA, TUP, and Mediator. c, STM promoters have NDRs, while TFO/UNB have NFRs. In vitro nucleosomes assembled with purified genomic DNA and histones (black fill) had ATP plus either purified RSC (yellow) or INO80 (purple) added (data from Ref. ). Poly (T:A) are sense-strand tracts (>5) of A (red) or T (green). d, Insulator TFs uncouple divergent transcription. Nascent transcription (CRAC data from Ref. ) for control or Rap1/Reb1 anchor-away (AA) depleted strains was collected for N divergent gene pairs sharing the same promoter region, then correlated between the gene pairs. e, Pcf11 termination factor accumulates at insulator TFs. Architecture at promoters adjacent to an upstream termination region (tandem genes) and having (TFO) or lacking (UNB) an insulator TF.
Fig. 5 |
Fig. 5 |. TFs stably interact with STM cofactors but not GTFs.
a, Architecture at Yrr1 motifs in two classes of Yrr1-bound promoters: “STM-bound” (left-side labels) and “Not STM-bound” (right-side cyan and black labels) (see Methods). The arrow points to where cofactor crosslinking permeates Yrr1 crosslinking. b, Representative architecture of STM cofactors or PIC components at a consolidated set of TF motifs at RSTM promoters (strand averaged; see Methods and Supplementary Data 11AI), and oriented by TSS. Taf12 is in SAGA and TFIID. c, Frequency distribution of promoters having the indicated PIC/TFIID ratio (average of six GTFs, 3-bin moving average), separated by promoter class (RP, STM, TFO, UNB) or promoter sets based on cofactor enrichment. “SAGA-bound” excludes RP promoters, which are highly enriched with SAGA and shown separately. The “STM-bound” promoter set required all of the following to be present: SAGA, Mediator/ SWI/SNF, and TUP; “RSTM-bound” additionally required the presence of RPD3-L complex. The x-axis is in arbitrary units.

Similar articles

Cited by

References

    1. Rossi MJ, Lai WKM & Pugh BF Simplified ChIP-exo assays. Nat Commun 9, 2842 (2018). - PMC - PubMed
    1. Rhee HS & Pugh BF Comprehensive genome-wide protein-DNA interactions detected at single-nucleotide resolution. Cell 147, 1408–1419 (2011). - PMC - PubMed
    1. Hahn S & Young ET Transcriptional regulation in Saccharomyces cerevisiae: transcription factor regulation and function, mechanisms of initiation, and roles of activators and coactivators. Genetics 189, 705–736 (2011). - PMC - PubMed
    1. Levine M, Cattoglio C & Tjian R Looping back to leap forward: transcription enters a new era. Cell 157, 13–25 (2014). - PMC - PubMed
    1. Cramer P Organization and regulation of gene transcription. Nature 573, 45–54 (2019). - PubMed

Publication types

MeSH terms

LinkOut - more resources