. 2021 Mar 10;12(1):1557.
doi: 10.1038/s41467-021-21820-1.

Missense mutation of Fmr1 results in impaired AMPAR-mediated plasticity and socio-cognitive deficits in mice

Affiliations

Missense mutation of Fmr1 results in impaired AMPAR-mediated plasticity and socio-cognitive deficits in mice

Marta Prieto et al. Nat Commun. .

Abstract

Fragile X syndrome (FXS) is the most frequent form of inherited intellectual disability and the best-described monogenic cause of autism. CGG-repeat expansion in the FMR1 gene leads to FMR1 silencing, loss-of-expression of the Fragile X Mental Retardation Protein (FMRP), and is a common cause of FXS. Missense mutations in the FMR1 gene were also identified in FXS patients, including the recurrent FMRP-R138Q mutation. To investigate the mechanisms underlying FXS caused by this mutation, we generated a knock-in mouse model (Fmr1R138Q) expressing the FMRP-R138Q protein. We demonstrate that, in the hippocampus of the Fmr1R138Q mice, neurons show an increased spine density associated with synaptic ultrastructural defects and increased AMPA receptor-surface expression. Combining biochemical assays, high-resolution imaging, electrophysiological recordings, and behavioural testing, we also show that the R138Q mutation results in impaired hippocampal long-term potentiation and socio-cognitive deficits in mice. These findings reveal the functional impact of the FMRP-R138Q mutation in a mouse model of FXS.


Conflict of interest statement

The authors declare no competing interests.

Figures

Fig. 1
Fig. 1. Generation and characterization of the Fmr1R138Q Knock-in (KI) mouse line.
a Schematic representation of the Fmr1 WT allele, the targeting vector used and the allele carrying the missense FXS R138Q mutation. Representative PCR profiles and DNA sequences obtained upon genotyping and genomic DNA sequencing of WT and Fmr1R138Q littermates. b Immunoblots showing FMRP protein levels at the indicated postnatal days (PND) in WT and Fmr1R138Q mice. β3-tubulin loading control is also shown. Data are presented as mean values ± s.e.m. of normalized FMRP-WT and FMRP-R138Q protein levels in developing brains of age-matched littermate animals. N = 3 biologically independent experiments. Statistical significance determined by Two-way analysis of variance (ANOVA) with Sidak’s post test; *p = 0.0219 versus PND3–21; ns not significant. c Relative abundance of several mRNA targets of FMRP measured by qPCR in PND90 WT and Fmr1R138Q brains. Data are presented as mean values ± s.e.m. of three biologically independent experiments. No significant differences were observed between the genotypes. d Representative images of the hippocampal formation in PND90 WT and Fmr1R138Q littermates. Scale bar, 300 μm. Source data are provided as a Source Data file.
Fig. 2
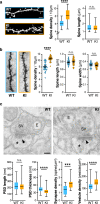
Fig. 2. The Fmr1R138Q hippocampus exhibits increased dendritic spine density and ultrastructural alterations.
a Confocal images of secondary dendrites from GFP-expressing WT and Fmr1R138Q KI cultured hippocampal neurons. Scale bar, 5 µm. Box plots indicate median (middle line), 25th, 75th percentile (box), and min to max values (whiskers) obtained for spine density and length in WT and Fmr1R138Q neurons. N = 48–54 neurons for ~1400–2200 spines analyzed per genotype from six biologically independent experiments. Two-tailed Mann–Whitney test. ****p < 0.0001. b Representative images of Golgi-stained basal secondary dendrites of CA1 hippocampal neurons from PND90 WT and Fmr1R138Q littermates. Histograms show the density of spines, spine length and width from WT and Fmr1R138Q CA1 secondary dendrites. Error bars represent the mean ± s.e.m. N = 30 neurons per genotype from three biologically independent experiments (1500–2000 spines analyzed per genotype). Two-sided Mann–Whitney test; ****p < 0.0001. c Representative EM images of pre- and postsynaptic (*) elements in CA1 synapses of PND90 WT and Fmr1R138Q hippocampi. E endosomes, SV synaptic vesicles, Arrowheads, postsynaptic densities (PSD). Scale bar, 100 nm. Box plots indicate median (line), 25th, 75th percentile (box), and min to max values (whiskers) for PSD length and thickness, the density of synapses and synaptic vesicles in WT and Fmr1R138Q CA1 hippocampal neurons. Approximately 130 PSD (length and thickness), 60 presynaptic boutons, and 350 µm2 of total surface area (synapse density) per genotype were analyzed from three independent sets of the experiment. Unpaired t test. ns not significant. ***p = 0.0003; ****p < 0.0001. Source data are provided as a Source Data file.
Fig. 3
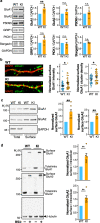
Fig. 3. Increased surface expression of AMPAR in hippocampal neurons of Fmr1R138Q KI mice.
a Immunoblots showing the levels of the indicated synaptic proteins in brain homogenates from PND21 WT and Fmr1R138Q littermate animals. GAPDH was used as a loading control. Quantification shows the mean ± s.e.m. of the total levels of the indicated proteins. N = 6 (GluA1, GluA2), N = 7 (PSD95), and N = 4 (GRIP1, PICK1, Stargazin) biologically independent experiments. Unpaired t test. ns not significant. **p = 0.0034. b Secondary dendrites from TTX-treated WT and Fmr1R138Q hippocampal neurons at 15 DIV stained for surface GluA1 (green) and MAP2 (red). Scale bar, 5 µm. Histograms show mean ± s.e.m. of both surface intensity and cluster density for GluA1 in WT and Fmr1R138Q neurons. Values were normalized to their respective basal conditions. N = 47 neurons per genotype from five biologically independent experiments. Two-tailed Mann–Whitney test. *p = 0.0147 (intensity) and *p = 0.0124 (density). c Immunoblots showing the surface expression of GluA1 and GluA2 in TTX-treated WT and Fmr1R138Q cultured hippocampal neurons at 15 DIV using biotinylation assays. Histograms show the mean ± s.e.m. of the normalized level of GluA1 and GluA2 subunits at the neuronal surface in WT and Fmr1R138Q neurons. N = 7 (GluA1) and 4 (GluA2) biologically independent experiments respectively. Two-sided ratio t test. **p = 0.0011 (GluA1); **p = 0.0074 (GluA2). d Immunoblots showing the basal surface expression of GluA1 and GluA2 in PND90 TTX-treated WT and Fmr1R138Q hippocampal slices using the BS3-crosslinking assay. Control tubulin immunoblot is included to confirm the absence of BS3 crosslinking intracellularly. The surface/intracellular ratio in the WT was set to 1 and Fmr1R138Q values were calculated respective to the WT. Error bars show the mean values ± s.e.m. N = 6 independent experiments. Two-tailed ratio t test. **p = 0.0041 (GluA1); **p = 0.0056 (GluA2). Source data are provided as a Source Data file.
Fig. 4
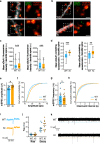
Fig. 4. Increased synaptic surface expression of AMPAR and basal excitatory transmission in hippocampal Fmr1R138Q neurons.
a, b Super-resolution STED images of surface-expressed GluA1 and GluA2 (STED, green) in postsynaptic Homer1 sites (confocal, red) of TTX-treated WT and Fmr1R138Q hippocampal neurons. Scale bar, 500 nm. c, d Quantification of (a) and (b). Box plots indicate median (middle line), 25th, 75th percentile (box), and min to max values (whiskers) obtained for the mean surface GluA1 and GluA2 fluorescence intensity (c) and nanodomains (d) in WT and Fmr1R138Q neurons. N = 17–30 (WT) and 15–30 (Fmr1R138Q) neurons were analyzed from three biologically independent experiments with a total of dendritic spines analyzed ranging from 878 to 4246. Unpaired t test. ***p < 0.0001; **p = 0.0011. ek mEPSCs recordings from acute hippocampal slices obtained from PND90 WT and Fmr1R138Q littermates. Quantification shows the mean values ± s.e.m. (e, g) and cumulative curves ± s.e.m. (f, h) of mEPSC amplitude and frequency. N = 10–11 neurons per genotype from three independent experiments. Unpaired t test. ns not significant. *p = 0.0111. i Example traces of WT and Fmr1R138Q single events. j Computed Tau rise and decay. k Representative traces of mEPSC recordings from WT and Fmr1R138Q hippocampal slices. Source data are provided as a Source Data file.
Fig. 5
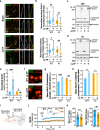
Fig. 5. LTP is impaired in Fmr1R138Q mice.
a Secondary dendrites from TTX-treated WT and Fmr1R138Q 15 DIV neurons stained for MAP2-positive microtubule (green) and surface-expressed GluA1 (red) in basal conditions and upon cLTP induction. Bar, 20 µm. b Boxplots indicate median (line), 25th, 75th percentile (box), and min-to-max values (whiskers) obtained for surface GluA1 intensity and cluster density in WT and Fmr1R138Q neurons in control and cLTP conditions. Values were normalized to their basal conditions. N = 39–42 neurons per genotype from four independent experiments. Two-tailed Mann–Whitney test. *p = 0.0103; **p = 0.0053 (WT sGluA1 intensity); **p = 0.0034 (KI sGluA1 intensity); **p = 0.0036 (KI sGluA1 cluster). c, d Immunoblots showing the surface expression of GluA1 in basal and cLTP-induced conditions in PND90 TTX-treated WT (c) and Fmr1R138Q (d) hippocampal slices using BS3-crosslinking assays. Control Tubulin immunoblot is included to control the absence of intracellular BS3-crosslinking. e The surface/intracellular ratio in the WT was set to 1 and Fmr1R138Q values were calculated respective to the WT. Bars show the mean ± s.e.m. N = 7 independent experiments. Two-tailed ratio t test. *p = 0.0358; ***p = 0.0004. f STED images of surface-expressed GluA1 (STED, green) in postsynaptic Homer1 sites (confocal, red) of cLTP induced WT and Fmr1R138Q hippocampal neurons. Scale bar, 500 nm. g, h Box plots indicate median (middle line), 25th, 75th percentile (box), and min to max values (whiskers) obtained for the postsynaptic surface-associated GluA1 fluorescent intensity (g) and nanocluster density (h) computed from STED imaging data in basal and cLTP-treated WT and Fmr1R138Q neurons. N = 13–17 (WT) and 15–18 (Fmr1R138Q) neurons were analyzed from three independent experiments. g, h Unpaired t test. ***p < 0.0001; **p = 0.0079. ns not significant. Values for control surface GluA1 in (fh) are taken from Fig. 4 (c, d) since these experiments were performed in parallel. i Schematic diagram of the stimulating and recording areas in the mouse hippocampus. j fEPSPs were recorded at CA1 synapses on hippocampal slices from P35-42 WT and Fmr1R138Q littermates in basal conditions and upon LTP induction by high-frequency stimulation (HFS, 3 x 100Hz, 1 s). k Histograms show the mean ± s.e.m. of fiber volley (FV) and fEPSP slopes from 12–16 neurons per genotype in four independent experiments. Unpaired t test with Welch’s correction. ns not significant; **p = 0.0092. Source data are provided as a Source Data file.
Fig. 6
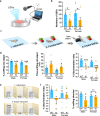
Fig. 6. Fmr1R138Q mice show communication deficits and socio-cognitive alterations.
a Schematic of the isolation-induced ultrasonic vocalizations (USVs) test. b Compared to WT animals, Fmr1R138Q KI mice (PND7) emit ~50% less USVs when removed from the nest. Histogram shows the mean values ± s.e.m. of USVs in WT and Fmr1R138Q males and females. WT, N = 13 males, 11 females; Fmr1R138Q, N = 10 males, 8 females. *p = 0.028. c Schematic of the object recognition test used to assess the cognitive domain. d Quantification shows the mean values ± s.e.m. of time sniffing the new object (%), the old object (s), and the discrimination index (%) for both PND40–45 WT and Fmr1R138Q males and females. WT, N = 10 males, 9 females; Fmr1R138Q, N = 10 males, 10 females. *p = 0.011 (male), *p = 0.028 (female), ***p < 0.001. e Scheme of the three-chamber test used to assess sociability. f Histograms show the mean percentage ± s.e.m. of discrimination index and time sniffing the stimulus mouse for both PND40–45 WT and Fmr1R138Q males and females. WT, N = 7 males, 8 females; Fmr1R138Q, N = 7 males, 8 females. *p = 0.017. Two-way ANOVA with genotype and sex as factors followed by Newman–Keuls post-hoc test for individual group comparisons were computed for all behavioral studies. Source data are provided as a Source Data file.

Similar articles

Cited by

References

    1. Bassell GJ. Fragile balance: RNA editing tunes the synapse. Nat. Neurosci. 2011;14:1492–1494. doi: 10.1038/nn.2982. - DOI - PubMed
    1. Wang LW, Berry-Kravis E, Hagerman RJ. Fragile X: leading the way for targeted treatments in autism. Neurotherapeutics. 2010;7:264–274. doi: 10.1016/j.nurt.2010.05.005. - DOI - PMC - PubMed
    1. Darnell JC, Klann E. The translation of translational control by FMRP: therapeutic targets for FXS. Nat. Neurosci. 2013;16:1530–1536. doi: 10.1038/nn.3379. - DOI - PMC - PubMed
    1. Prieto M, Folci A, Martin S. Post-translational modifications of the Fragile X Mental Retardation Protein in neuronal function and dysfunction. Mol. Psychiatry. 2020;25:1688–1703. doi: 10.1038/s41380-019-0629-4. - DOI - PubMed
    1. Santoro MR, Bray SM, Warren ST. Molecular mechanisms of fragile X syndrome: a twenty-year perspective. Annu. Rev. Pathol. 2012;7:219–245. doi: 10.1146/annurev-pathol-011811-132457. - DOI - PubMed

Publication types

MeSH terms

Substances