. 2021 Apr 22;6(8):e143285.
doi: 10.1172/jci.insight.143285.

VEGFA165 gene therapy ameliorates blood-labyrinth barrier breakdown and hearing loss

Affiliations

VEGFA165 gene therapy ameliorates blood-labyrinth barrier breakdown and hearing loss

Jinhui Zhang et al. JCI Insight. .

Abstract

Millions of people are affected by hearing loss. Hearing loss is frequently caused by noise or aging and often associated with loss of pericytes. Pericytes populate the small vessels in the adult cochlea. However, their role in different types of hearing loss is largely unknown. Using an inducible and conditional pericyte depletion mouse model and noise-exposed mouse model, we show that loss of pericytes leads to marked changes in vascular structure, in turn leading to vascular degeneration and hearing loss. In vitro, using advanced tissue explants from pericyte fluorescence reporter models combined with exogenous donor pericytes, we show that pericytes, signaled by VEGF isoform A165 (VEGFA165), vigorously drive new vessel growth in both adult and neonatal mouse inner ear tissue. In vivo, the delivery of an adeno-associated virus serotype 1-mediated (AAV1-mediated) VEGFA165 viral vector to pericyte-depleted or noise-exposed animals prevented and regenerated lost pericytes, improved blood supply, and attenuated hearing loss. These studies provide the first clear-cut evidence that pericytes are critical for vascular regeneration, vascular stability, and hearing in adults. The restoration of vascular function in the damaged cochlea, including in noise-exposed animals, suggests that VEGFA165 gene therapy could be a new strategy for ameliorating vascular associated hearing disorders.

Keywords: Angiogenesis; Cardiovascular disease.


Conflict of interest statement

Conflict of interest: The authors have declared that no conflict of interest exists.

Figures

Figure 1
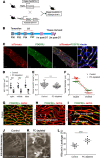
Figure 1. Loss of pericytes impairs vascular structure and function.
(A) Schematic of the transgenic Pdgfrb-CreERT2/iDTR mouse model incorporating an inducible Cre-loxP system. (B) The diagram shows the timeline of tamoxifen and diphtheria toxin (DT) administration and the time point for tissue harvest. (C) Colocalization of Cre and PDGFR-β signals (green) is seen in the strial vasculature of Pdgfrb-CreERT2/tdTomato mice (middle right and right: low-magnification and high-magnification images, n = 4). (D) Pericyte density in the strial vasculature is significantly reduced in pericyte-depleted mice (n = 7) compared with control mice (n = 6) at the apical, middle, and basal turn (****P < 0.0001 by Student’s t test). (E) Total vascular density in the stria is also significantly reduced in pericyte-depleted mice (****P < 0.0001 by Student’s t test). (F) Maximum and minimum vessel diameter in control and pericyte-depleted animals (maximum diameter is approximately 12.9 ± 1.8 μm in control mice (n = 6, total 153 vessels analyzed), 16.2 ± 2.6 μm in pericyte-depleted mice (n = 7, total 180 vessels analyzed); minimum vessel diameter is approximately 4.6 ± 1.1 μm in control mice, 1.9 ± 0.8 μm in pericyte-depleted mice. (GI) Representative figures show the capillaries of the stria in control (G) and pericyte-depleted mice 2 weeks after DT injection (arrows, H and I). The depletion of pericytes leads to some vessel enlargement (arrows, H) and shrinkage (arrows, I). (J and K) Albumin-FITC leakage was identified under IVM in pericyte-depleted mice (white arrows, K) but not in the control animals (J). (L) Statistical difference in vascular leakage between control and pericyte-depleted animals (n = 3, ***P < 0.001 by Student’s t test). Data are presented as mean ± SEM. Scale bars: 10 μm (C left, middle left, middle right), 30 μm (C right). 20 μm (G, H, I). 50 μm (J, K).
Figure 2
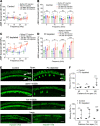
Figure 2. Loss of pericytes causes hearing loss.
(A and B) Control iDTR mice receiving the same 4 doses of DT as the Pdgfrb-CreERT2/iDTR mice showed no significant hearing threshold change at 1 week and 2 weeks (n = 7, P > 0.05 by repeated measures 1-way ANOVA). (C and D) The depletion of pericytes led to hearing loss at all measured frequencies. The hearing threshold in pericyte-depleted animals was significantly elevated at 1 week after DT injection (n = 6, **P < 0.01, and ****P < 0.0001) and persisted 2 weeks after DT injection (n = 6, **P < 0.01, and ****P < 0.0001 by repeated measures 1-way ANOVA). (E and F) Significant HC loss is seen at the middle and basal turns in the pericyte-depleted animals. (E) Representative high-magnification confocal images from control and pericyte-depleted animals, labeled with antibody for myosin VIIa in the different cochlear regions. (F) Total percentage of inner HC (IHC) and outer HC (OHC) (see arrows in E) loss along the entire length of the cochlea in each group was calculated. The pericyte-depleted group showed significantly more IHC and OHC loss (ncontrol = 3, nPC depleted = 6, **P < 0.01 for apical IHC loss, ***P = 0.001 for middle to base IHC loss, ***P < 0.001 for base to hook IHC loss, **P < 0.01 for apical OHC loss, **P < 0.01 for middle to base OHC loss, and ***P = 0.001 for base to hook OHC loss by unpaired Student’s t test). Scale bars: 30 μm.
Figure 3
Figure 3. Pericytes, signaled by VEGFA165, lead cochlear angiogenesis in adult and neonatal mouse cochleae in vitro.
(A) Confocal image of the stria from an NG2+DsRed mouse (n = 4) shows pericytes situated on microvessels labeled with an antibody for glucose transporter I (Glut, green). (B) Strial explant from an NG2+DsRed mouse cochlea labeled with Phalloidin and DAPI on day 5 after VEGFA165 treatment. A high-magnification image (inset in B) highlights how NG2-derived pericytes lead new vessel growth (n = 4). (C) An example of sprouting angiogenesis on day 5 from the control group. (D) Pericyte depletion with APB5 treatment impairs angiogenesis. (E) Quantitation of branch number in control and APB5-treated groups shows significant differences (n = 5 for each group, **P < 0.01, and ****P < 0.001 by 1-way ANOVA). (F) Pericytes encoded with pmOrange2-N1. (G) An explant cografted with fluorescence-labeled exogenous pericytes shows some pericytes convert to tip cells (red arrows) and some invest on sprouting branches (white arrows) on day 5 after treatment with VEGFA165. (H) A high-magnification image from an inset in G shows 2 exogenous pericytes with long filopodia situated on the distal end of sprouts. (Background color of inset in H was changed using Photoshop for better visualization of tip cells originating from donor pericytes.) (I and J) Confocal images show sprouting angiogenesis on day 4 in control and pericyte-depleted groups from neonatal mice. Zoomed-in images from insets in I and J better show NG2-derived pericyte-led branch formation in the control (I) and pericyte-depleted groups (J). (M and N) Reconstructions in 3D of confocal images from control and pericyte-depleted groups show less branch formation when pericytes are depleted. (O) Quantitative analysis of branch number in the 2 groups for each day (n = 6 for each group, **P < 0.01, and ****P < 0.0001 by Student’s t test) or (P) on day 4 (n = 6, ****P < 0.0001 by Student’s t test). Scale bars: 10 μm (A, B inset), 100 μm (BD, F, G, IN), 50 μm (H).
Figure 4
Figure 4. Pericyte-driven angiogenesis is controlled by VEGFA165 signaling.
(A) The illustration shows selective blockage of VEGFA165 signaling with the drug BAW2881, which targets 2 VEGFA receptors, Flt1 and KDR/Flk1. (B) The number of new vessels is significantly reduced in a dose-dependent manner when VEGFA receptors are blocked with the specific VEGFA blocker, BAW2881 (n = 3 for control group, n = 4 for 1 nM, n = 3 for 4 nM, n = 3 for 40 nM, and ****P < 0.0001 by 1-way ANOVA). (C and D) Representative confocal projection images show branch formation in the VEGFA165 and VEGFA receptor blocked groups. (E) Illustration of construction of the AAV1-FLEX-VEGFA165-GFP viral vector, a Cre-dependent inversion gene switch (FLEX) vector, which specifically targets pericytes to produce VEGFA165. (F) Pericytes (red, genetically labeled by tdTomato) drive sprouting angiogenesis, as seen on day 5 in a Pdgfrb-CreER/tdTomato mouse cochlea. (G) The green AAV1-FLEX-VEGFA165-GFP signal is primarily targeted in tdTomato-labeled pericytes. (H) Merged image from F and G. (I and J) Sprouting growth in the AAV1-GFP control and AAV1-FLEX-VEGFA165 viral vector groups. (K) The number of branches is significantly higher in the AAV1-FLEX-VEGFA165 viral vector–transfected strial explant (n = 4 for AVV1-GFP group, n = 5 for AAV1-VEGFA165 group, and *P < 0.05 by Student’s t test). Data are presented as mean ± SEM. Scale bars: 100 μm (C, D, FH), 150 μm (I, J).
Figure 5
Figure 5. AAV1-HRE-VEGFA165 transfer to pericytes significantly promotes pericyte survival under hypoxic conditions.
(A) AAV1-HRE-VEGFA165-GFP successfully infected a cochlear pericyte cell line with a multiplicity of infection (MOI) of 1 × 10⁵ when imaged 48 hours later. (B) Real time-quantitative PCR shows significant upregulation of Vegfa mRNA (n = 3 for each group, *P < 0.05, and **P < 0.01 by 1-way ANOVA). (C) ELISA shows high production of VEGFA protein in an AAV1-HRE-VEGFA165 gene-infected pericyte relative to an AAV1-GFP null-infected pericyte (n = 3 for each group, *P < 0.05, and **P < 0.01 by 1-way ANOVA). (DG) Distribution of live (green) and dead pericytes under hypoxia as measured with a Live/Dead Cell Viability Assay Kit (MilliporeSigma). (H) Statistical analysis shows increased pericyte survival (green) under hypoxic conditions when pericytes were pretransfected with AAV1-HRE-VEGFA165 for 48 hours (n = 4 for control, n = 4 for hypoxia 1h, n = 5 for AAV1-GFP hypoxia 1h, n = 6 for AAV1-VEGFA165 hypoxia 1h, and ***P < 0.001 by 1-way ANOVA). Data are presented as mean ± SEM. Scale bars: 100 μm.
Figure 6
Figure 6. VEGFA165 gene therapy enhances pericyte survival, promotes pericyte regeneration, and attenuates vascular damage.
(A and B) Time points of gene delivery and related measurements. (C and D) VEGFA165 mRNA and protein are significantly increased in the AAV1-VEGFA165 gene–treated cochleae compared with the control AAV1-treated cochleae (VEGFA165 mRNA: n = 3 for each group; VEGFA165 protein: n = 6 for each group; and **P < 0.01 by Student’s t test). (E) The pericyte population is higher in the AAV1-VEGFA165 gene–treated group (n = 7) compared with the control AAV1-treated group (n = 4, ****P < 0.0001 by Student’s t test). (F) Increased EdU+ cells in the VEGFA165 gene–treated group (n = 7) compared with the control AAV1 group (n = 4, *P < 0.05, and **P < 0.01 by Student’s t test). (G) Decreased vascular density is attenuated by AAV1-VEGFA165 gene treatment (n = 7) but not by control AAV1 treatment (n = 4, ***P < 0.001 by Student’s t test). (H and I) Confocal images show EdU+ pericytes, endothelial cells, and an unidentified cell type in the stria of control AAV1 (H) and AAV1-VEGFA165 groups (l). (J) Zoomed-in images highlight different types of EdU+ cells in the stria of an AAV1-VEGFA165–treated animal. (K) Blood flow volume in the AAV1-VEGFA165–treated group is significantly greater than in the control AAV1 group (n = 3, ****P < 0.0001 by Student’s t test). (L) Vascular leakage is markedly attenuated in the AAV1-VEGFA165–treated group relative to the control AAV1 group (n = 3 for each group, **P < 0.01 by Student’s t test). (M and N) IVM images from control AAV1 and AAV1-VEGFA165 groups (white arrows, leaking sites). Data are presented as a mean ± SEM. Scale bars: 50 μm (H, I), 10 μm (J), 100 μm (M, N). PC, pericyte; EC, endothelial cell.
Figure 7
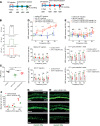
Figure 7. VEGFA165 gene therapy markedly attenuates the loss of HCs and improves hearing sensitivity.
(A) An illustration of time points for gene delivery. (B) Representative EP waveforms from different groups. (C) Average EP in the AAV1-VEGFA165–transfected group is significantly higher than in the control and control AAV1 groups (n = 6 for the control, n = 5 for the AAV1 control, n = 5 for the AAV1-VEGFA165, *P < 0.05, **P < 0.01, and ****P < 0.0001 by 1-way ANOVA). (D) Hearing thresholds at different frequencies are significantly elevated after DT injection, but hearing sensitivity is not improved at 1 or 2 weeks in the control AAV1 gene group. In contrast, (E) hearing sensitivity is significantly improved at 1 week after AAV1-VEGFA165 gene delivery and further improved at 2 weeks (n = 3 for control group, n = 7 for AAV1-VEGFA165 group, **P < 0.01, and ****P < 0.0001 by Student’s t test). (F) Significant HC loss is seen at the middle and basal turns in the pericyte-depleted group, but HC loss is significantly attenuated in the AAV1-VEGFA165–transfected group (n = 3 for each group, *P < 0.05 for apical loss, and ****P < 0.0001 for middle and base HC loss by Student’s t test). (G and H) Representative confocal projection images of the organ of Corti in different cochlear regions recorded from a control AAV1 and AAV1-VEGFA165–treated group, demonstrating HC loss at the different cochlear turns. HCs were labeled with an antibody for myosin VIIa. Data are presented as mean ± SEM. EP, endocochlear potential; OHC, outer hair cell; IHC, inner hair cell. Scale bars: 50 μm.
Figure 8
Figure 8. Therapeutic VEGFA165 gene treatment attenuates reduction in strial vascular density and improves hearing sensitivity after acoustic trauma.
(A) Strial microvasculature labeled with lectin and EdU+ cells in control, 4 weeks after noise exposure (NE) without gene treatment, noise-exposed + control AAV1-null gene treatment, and noise-exposed + AAV1-VEGFA165 gene treatment 2 weeks after acoustic trauma groups. Arrows indicate vessel enlargement and shrinkage after noise exposure, and arrowheads show representative EdU+ pericytes, ECs, and an unidentified cell type in the stria. (B and C) Data analysis of EdU+ cells/vessel area and capillary density in control, NE, NE+AAV1 null (control); and NE+AAV1 VEGFA165 (n = 8 for each group, *P < 0.05, **P < 0.01, ***P < 0.001, and ****P < 0.0001 by 1-way ANOVA). (D) Hearing thresholds at different frequencies are significantly elevated after noise exposure but improved after delivery of the AAV1-VEGFA165 (n = 6 for each group, *P < 0.05, and **P < 0.01 by 1-way ANOVA). Data are presented as mean ± SEM. Scale bars: 100 μm.
Figure 9
Figure 9. A model of VEGFA165-controlled angiogenesis in the cochlea.
(A and B) VEGFA165 induces pericytes to migrate. (C) The pericytes “sense” the VEGFA165 diffusing from vessels and align along the VEGFA165 gradient to form a “sprout.” The proliferation of ECs behind the tip cells drives the precapillary to elongate. (D) Newly proliferated pericytes on the new branch tube establish focal contacts with ECs.

Similar articles

Cited by

References

    1. Neng L, Shi X. Vascular pathology and hearing disorders. Curr Opin Physiol. 2020;18:79–84. doi: 10.1016/j.cophys.2020.09.004. - DOI
    1. Hibino H, et al. How is the highly positive endocochlear potential formed? The specific architecture of the stria vascularis and the roles of the ion-transport apparatus. Pflugers Arch. 2010;459(4):521–533. doi: 10.1007/s00424-009-0754-z. - DOI - PubMed
    1. Shi X. Physiopathology of the cochlear microcirculation. Hear Res. 2011;282(1–2):10–24. - PMC - PubMed
    1. Greenhalgh SN, et al. Origins of fibrosis: pericytes take centre stage. F1000Prime Rep. 2013;5:37. - PMC - PubMed
    1. Hall CN, et al. Capillary pericytes regulate cerebral blood flow in health and disease. Nature. 2014;508(7494):55–60. doi: 10.1038/nature13165. - DOI - PMC - PubMed

Publication types

Substances