. 2021 Apr 6;49(6):3217-3241.
doi: 10.1093/nar/gkab099.

Epstein-Barr virus inactivates the transcriptome and disrupts the chromatin architecture of its host cell in the first phase of lytic reactivation

Affiliations

Epstein-Barr virus inactivates the transcriptome and disrupts the chromatin architecture of its host cell in the first phase of lytic reactivation

Alexander Buschle et al. Nucleic Acids Res. .

Abstract

Epstein-Barr virus (EBV), a herpes virus also termed HHV 4 and the first identified human tumor virus, establishes a stable, long-term latent infection in human B cells, its preferred host. Upon induction of EBV's lytic phase, the latently infected cells turn into a virus factory, a process that is governed by EBV. In the lytic, productive phase, all herpes viruses ensure the efficient induction of all lytic viral genes to produce progeny, but certain of these genes also repress the ensuing antiviral responses of the virally infected host cells, regulate their apoptotic death or control the cellular transcriptome. We now find that EBV causes previously unknown massive and global alterations in the chromatin of its host cell upon induction of the viral lytic phase and prior to the onset of viral DNA replication. The viral initiator protein of the lytic cycle, BZLF1, binds to >105 binding sites with different sequence motifs in cellular chromatin in a concentration dependent manner implementing a binary molar switch probably to prevent noise-induced erroneous induction of EBV's lytic phase. Concomitant with DNA binding of BZLF1, silent chromatin opens locally as shown by ATAC-seq experiments, while previously wide-open cellular chromatin becomes inaccessible on a global scale within hours. While viral transcripts increase drastically, the induction of the lytic phase results in a massive reduction of cellular transcripts and a loss of chromatin-chromatin interactions of cellular promoters with their distal regulatory elements as shown in Capture-C experiments. Our data document that EBV's lytic cycle induces discrete early processes that disrupt the architecture of host cellular chromatin and repress the cellular epigenome and transcriptome likely supporting the efficient de novo synthesis of this herpes virus.


Figures

Figure 1.
Figure 1.
Identification of ChIP-seq peaks and BZLF1 binding motifs in chromatin of Raji iBZLF1 cells. (A) Numbers of peaks at 0 and 15 h levels of BZLF1 (i.e. in the non-induced and induced states, respectively) in EBV-positive Raji iBZLF1 cells after ChIP-seq with the BZLF1 specific BZ1 antibody. (B) The intersections of the 0 and 15 h peak sets with at least one identified motif indicate that the majority of 0 h-level peaks are maintained when BZLF1 is induced. The abundance of peaks increases more than 5-fold at 15 h BZLF1 levels compared with the peak number at 0 h BZLF1 levels. (C) At 0 h BZLF1 levels, the known BZLF1 binding motif TGWGCGA predominates in individual peaks. At 15 h BZLF1 levels, the less specific TGWGYVA motif was identified as the major motif, which encompasses the previously identified meZRE motif TGWGCGA (12). (D) The average frequencies of the number of BZLF1 motifs per ChIP-seq peak is provided.
Figure 2.
Figure 2.
Motif abundance as a function of BZLF1 levels in Raji and DG75 iBZLF1 cells. (AD) The Venn diagram shows the number of peaks that contain either the TGWGYVA (A) or the TGWGYVT (T) motifs, both (A/T) or no identifiable motif (none). In Raji and DG75 iBZLF1 cells at 15 h BZLF1 levels 54 % and 46 % of the peaks contain both motifs (A/T), respectively. Within 96 % and 95 % of all peaks in Raji and DG75 iBZLF1 cells, respectively, at least one motif could be identified. (BE) The number of the four BZLF1 binding motifs found in ChIP-seq peaks is plotted at 0 h and 15 h expression levels of BZLF1. At both levels and in both cell lines, the number of motifs ending with the residue A exceeds the number of motifs ending with T. The finding suggests that BZLF1’s ranked motif preference is TGWGCGA > TGWGCGT > TGWGYVA > TGWGYVT. (CF) Calculation of the number of motifs per peak.
Figure 3.
Figure 3.
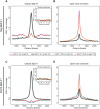
Changes in cellular chromatin accessibility after induction of BZLF1 in Raji and DG75 iBZLF1 cells. (AC) The meta-plot summarizes the accessibility at the 145,477 and 231,019 BZLF1 binding sites (Figure 1A and Supplementary Figure S2E) in Raji and DG75 cell chromatin, respectively, prior to and after induction of full-length or AD-truncated BZLF1. The average ATAC-seq coverages in the four different Raji and DG75 cell samples are plotted according to the nucleotide coordinates of the centers of the 145,477 and 231,019 BZLF1 peaks. In non-induced Raji and DG75 iBZLF1 cells (BZLF1 full-length, 0 h) the average ATAC-seq coverage is congruent with the coverage found in induced and non-induced Raji and DG75 cells that carry the conditional AD-truncated BZLF1 allele. At induced BZLF1 levels (full-length, 15 h) the average ATAC-seq coverage is substantially increased indicating a gain in chromatin accessibility. The inset provides the ATAC-seq coverage of 145,477 and 231,019 randomly sampled sequences in the chromatin of Raji and DG75 iBZLF1 cells, respectively, expressing full-length BZLF1 at 15 h levels after doxycycline-mediated induction. (BD) The meta-plot summarizes the ATAC-seq coverage at the about 81,000 and 105,000 called peaks of open host chromatin identified prior to the induction of BZLF1 in both Raji and DG75 iBZLF1 cell lines, respectively. After induced expression of full-length BZLF1 the chromatin accessibility is strongly reduced in Raji iBZLF1 cells indicating that previously open host chromatin becomes globally inaccessible upon induction of EBV’s lytic phase. In DG75 iBZLF1 cells the effect is apparent, but less pronounced. Compared with non-induced cells (0 h), the ATAC-seq coverage is barely affected when the AD-truncated BZLF1 protein is expressed in both cell lines. The data summarize three independent biological replicates.
Figure 4.
Figure 4.
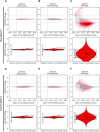
Gene regulation in Raji and DG75 cells upon doxycycline-induced expression of full-length BZLF1 compared with a BZLF1 variant lacking its transcriptional activation domain. Three pairs of cell lines, parental Raji (A) and DG75 (D) cells, Raji iBZLF1 AD-truncated (B) and DG75 iBZLF1 AD-truncated (E) cells, and Raji iBZLF1 (C) and DG75 iBZLF1 (F) were induced with doxycycline for 6 h and compared with their non-induced counterparts. The analyses are based on the hg19 reference genome and three replicates of each condition and cell line. Viral genes and NGFR (used as a doxycycline-regulated reporter gene) were excluded from the analyses. (AD) The transcriptomes of parental Raji and DG75 cells were analysed by comparing their untreated versus doxycycline-treated (6 h) states. No gene with more than 20 sequencing reads (vertical purple line) was found to be up- (>2.5×) or down-regulated (<0.4×) in the MA plots (upper and lower green horizontal lines, respectively) in both parental cell lines. The median is centered at zero in the violin plot (lower panel). The distance between the quantiles that encompass 95 % of all data points describes the spread of the gene populations which was determined to be 20.28 and 20.5, in parental Raji and DG75 cells, respectively. (BE) RNA expression in Raji and DG75 cells with a conditional activation-domain (AD)-truncated BZLF1 allele upon doxycycline induction for 6 h. No gene was considered up- or down-regulated when the previously introduced parameters were applied. The violin plots reveal the very narrow spread of the gene population of 20.42 and 20.41, respectively, comparable to the results shown in panel A and D. (CF) RNA expression in Raji and DG75 cells upon doxycycline induction of full-length wild-type BZLF1 (iBZLF1) after data normalisation according to ERCC spike-in RNA reads. The MA plot shows a strong global reduction of cellular mRNA transcripts 6 h after induction of BZLF1 in the Raji iBZLF1 cells, while this effect was not observed in the DG75 iBZLF1 cells. 91 and 109 genes were upregulated (upper horizontal green line), while transcripts of 7174 and 93 genes were reduced by a factor of at least 0.4 (lower horizontal green line), in Raji and DG75 iBZLF1 cells, respectively. In the Raji iBZLF1 cells the violin plot shows that the median of the gene population is reduced by a factor of almost three (2–1.56) indicating a global reduction of mRNA steady state levels, while the median is around zero (2–0.03) and unchanged in DG75 iBZLF1 cells. The distance between the 2.5 and 97.5 quantiles shows a spread of the gene population of 23.00 for Raji iBZLF1 and 21.86 for DG75 iBZLF1 cells.
Figure 5.
Figure 5.
Regulated genes and their association with BZLF1 ChIP-seq peaks and binding motifs in promoter regions. (AE) The numbers of ChIP-seq defined peaks are plotted on the x-axis versus the magnitude of gene regulation expressed as ‘log2 fold change’ on the y-axis after doxycycline induced expression of full-length BZLF1 in Raji iBZLF1 (A) and DG75 iBZLF1 cells (E) for 6 h. Among the regulated genes that did not encompass BZLF1 peaks within their defined promoter regions 41 and 52 genes were found up-regulated (45 resp. 48 % of all up-regulated genes) and about 4,500 and 63 genes were down-regulated (63 resp. 68 % of all down-regulated genes) in Raji and DG75 iBZLF1 cells, respectively, as indicated by the dashed horizontal green lines. Among the regulated genes with BZLF1 peaks in their promoter regions, 50 and 57 were found up-regulated (55 resp. 52 % of all up-regulated genes) and about 2.600 and 30 genes were down-regulated (37 resp. 32 % of all down-regulated genes) in Raji and DG75 iBZLF1 cells, respectively. (BF) The number of BZLF1 motifs as defined in Figure 1C and Supplementary Figure S2 (panels C, G and K) are plotted on the x-axis versus the magnitude of gene regulation on the y-axis as in panel A. BZLF1 motifs downstream and upstream of TSSs entered the analysis. The distribution of regulated genes (y-axis) with or without BZLF1 binding sites follows the scheme in panel A. (C). The peak analysis includes the promoter proximal region −5 kb/+1 kb of the transcriptional start sites (TSS) as indicated. (D) The cartoon schematically depicts two single peaks upstream and downstream of a TSS with three and one BZLF1 motifs, respectively, illustrating the basics of this analysis and the principal location of the BZLF1 motifs.
Figure 6.
Figure 6.
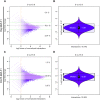
Gain and loss of chromatin interactions in Capture-C experiments 15 h after induction of BZLF1 in Raji iBZLF1 and DG75 iBZLF1 cells. The two MA plots summarize the dynamics of interactions between the promoter regions of 53 and 49 analysed genes and their captured distal DpnII fragments in Raji and DG75 iBZLF1 cells, respectively. The x-axis shows the number of identified interactions in log2 scale, the y-axis shows the log2 fold change between the paired time points (0 h versus 15 h). (AC) After 15 h of doxycycline-induced BZLF1 expression, almost 23.4 % and 8.9 % fragments lost more than half of their interactions (lower green horizontal line) compared with the status prior to induction of the lytic phase in Raji and DG75 iBZLF1 cells, respectively. Conversely, 0.4 % and 1.2 % DpnII fragments showed a more than two-fold increase of interactions (upper green horizontal line) in Raji and DG75 BZLF1 cells, respectively. The two percentages correspond to about 17,000 and 33,000 DpnII fragments in total that reached or exceeded the threshold of four interactions (dashed horizontal orange line). (BD) The violin plots summarize panels A and C and show a median of –0.61 and –0.28 and a population spread of 22.37 and 22.18 comparing induced versus non-induced Raji and DG75 iBZLF1 cells, respectively.
Figure 7.
Figure 7.
Loss of chromatin interactions between the MYC locus and the heavy chain enhancer in Raji iBZLF1 cells. On the x-axis, individual chromatin interactions are shown as thin vertical lines of different heights that indicate their interaction frequencies (plotted on the y-axis as ‘number of interactions’) with the MYC promoter region (approximate −5/ +5 kb of the TSS). The promoter region is depicted as a green bar in the center of the plot, a gray arrow head points in the direction of transcription, and the light blue line at position ‘1’ indicates the TSS. Gray vertical lines indicate the chromatin interactions prior to BZLF1 induction (0 h), orange and blue lines enumerate interactions 6 and 15 h after adding doxycycline, respectively. The bottom part of the graph shows the positions of BZLF1 binding sites prior to (big, pink dots) and 15 h after adding doxycycline (small, green dots). The x-axis indicates the relative nucleotide coordinates (hg19 genome reference) encompassing two flanking regions 400 kb up- and downstream of the TSS. Due to a chromosomal translocation (vertical dashed red line), the heavy chain enhancer (HCE) on chromosome 14 drives the expression of the MYC locus on chromosome 8 in Raji cells. Prior to induction of BZLF1, two regions of the heavy chain enhancer (HCE) indicated A and B make frequent contacts (gray vertical lines) with the captured MYC locus. Chromatin interactions decrease after 6 h (orange lines) and are further reduced to about 20 % (blue lines) 15 h after BZLF1 induction. Both interacted HCE regions A (chr14:106,031,165–106,031,487) and B (chr14:106,150,744–106,151,066) harbor the exact same DNA sequence of 324 bp in length and contain numerous BZLF1 ChIP-seq peaks with 18 BZLF1 motifs. In Raji cells, 6 h after BZLF1 induction the level of MYC transcripts is reduced to 2 % compared with the non-induced cells.
Figure 8.
Figure 8.
Expression of the late lytic viral glycoprotein gp350 as a function of nuclear levels of BZLF1. The HEK293 cell line 9G10 was engineered to study the induction of EBV’s lytic phase with increasing doses of tamoxifen. The cell line carries several copies of a recombinant EBV genome and expresses a chimeric BZLF1:ERT2 protein, which is cytoplasmic. Upon addition of tamoxifen, BZLF1:ERT2 shuttles to the nucleus where BZLF1 binds to its cognate DNA binding motifs. Depending on a threshold concentration of nuclear BZLF1, tamoxifen can induce the lytic phase of EBV’s life cycle, which is monitored by the expression of viral gp350 glycoprotein at the plasma membrane. (A) Cytoplasmic and nuclear BZLF1 signals 12 h after the addition of different concentrations of tamoxifen as indicated. Scale bar indicates 10 micron. (B) Visualisation of the gp350 signal 72 h after the addition of different concentrations of tamoxifen. No gp350 signal was visible at the cell membrane in the absence and up to 20 nM tamoxifen. A clear gp350 signal becomes apparent at 160 nM tamoxifen in the series of selected microscopic images shown. Supplementary Figure S19 provides a complete set of images covering all four channels analysed (DAPI, BZLF1, CD147, gp350) and all incremental doses of tamoxifen and at both time points. The images are example derived from four biological and technical replicates. (C) Summary data from a total of about 18,000 cells per replicate (72,000 cells in total) analysed for cytoplasmic and nuclear BZLF1 signals 12 h after the addition of escalating doses of tamoxifen (left and middle plots; small numbers underneath the error bars indicate nM concentrations of tamoxifen). Expression of gp350 was determined 72 h after tamoxifen addition (right plot). Means and standard errors of fours experiments are shown for all tamoxifen concentrations tested (5, 10, 20, 40, 80, 160, 320, 640 and 1,000 nM) normalised to the situation without tamoxifen (0). BZLF1 signals are colored in red, gp350 signals are shown in orange. The y-axes show normalised intensity values. Supplementary Figure S20 describes the analysis pipeline of the microscopic images that led to the data shown in panel C.

Similar articles

Cited by

References

    1. Qian S., Fan W., Liu T., Wu M., Zhang H., Cui X., Zhou Y., Hu J., Wei S., Chen H.et al. .. Seneca Valley virus suppresses host type I interferon production by targeting adaptor proteins MAVS, TRIF, and TANK for cleavage. J. Virol. 2017; 91:e00823-17. - PMC - PubMed
    1. Zheng Y.H., Jeang K.T., Tokunaga K.. Host restriction factors in retroviral infection: promises in virus-host interaction. Retrovirology. 2012; 9:112. - PMC - PubMed
    1. Albanese M., Tagawa T., Buschle A., Hammerschmidt W.. microRNAs of Epstein-Barr virus control innate and adaptive anti-viral immunity. J. Virol. 2017; 91:e01667-16. - PMC - PubMed
    1. Marazzi I., Ho J.S., Kim J., Manicassamy B., Dewell S., Albrecht R.A., Seibert C.W., Schaefer U., Jeffrey K.L., Prinjha R.K.et al. .. Suppression of the antiviral response by an influenza histone mimic. Nature. 2012; 483:428–433. - PMC - PubMed
    1. Quinlan M.P., Chen L.B., Knipe D.M.. The intranuclear location of a herpes simplex virus DNA-binding protein is determined by the status of viral DNA replication. Cell. 1984; 36:857–868. - PubMed

Publication types

LinkOut - more resources