

Mesoscopic protein-rich clusters host the nucleation of mutant p53 amyloid fibrils
- PMID: 33653952
- PMCID: PMC7958401
- DOI: 10.1073/pnas.2015618118
Mesoscopic protein-rich clusters host the nucleation of mutant p53 amyloid fibrils
Abstract
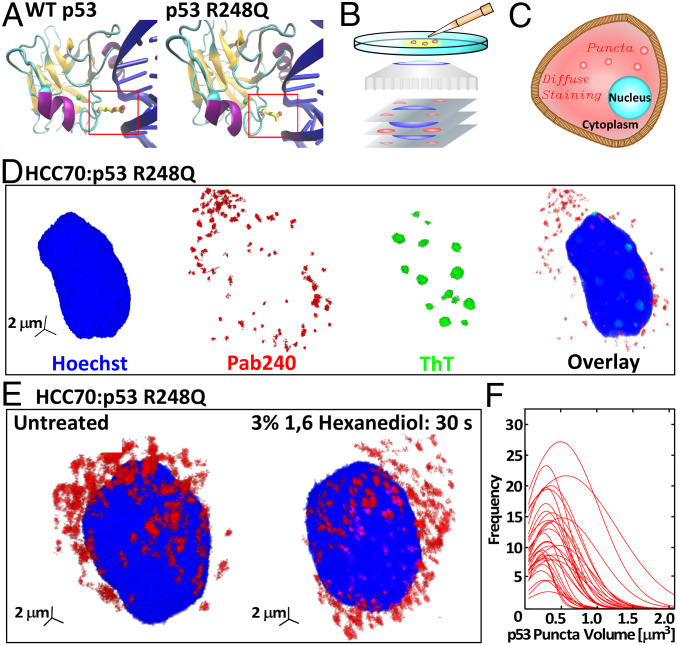
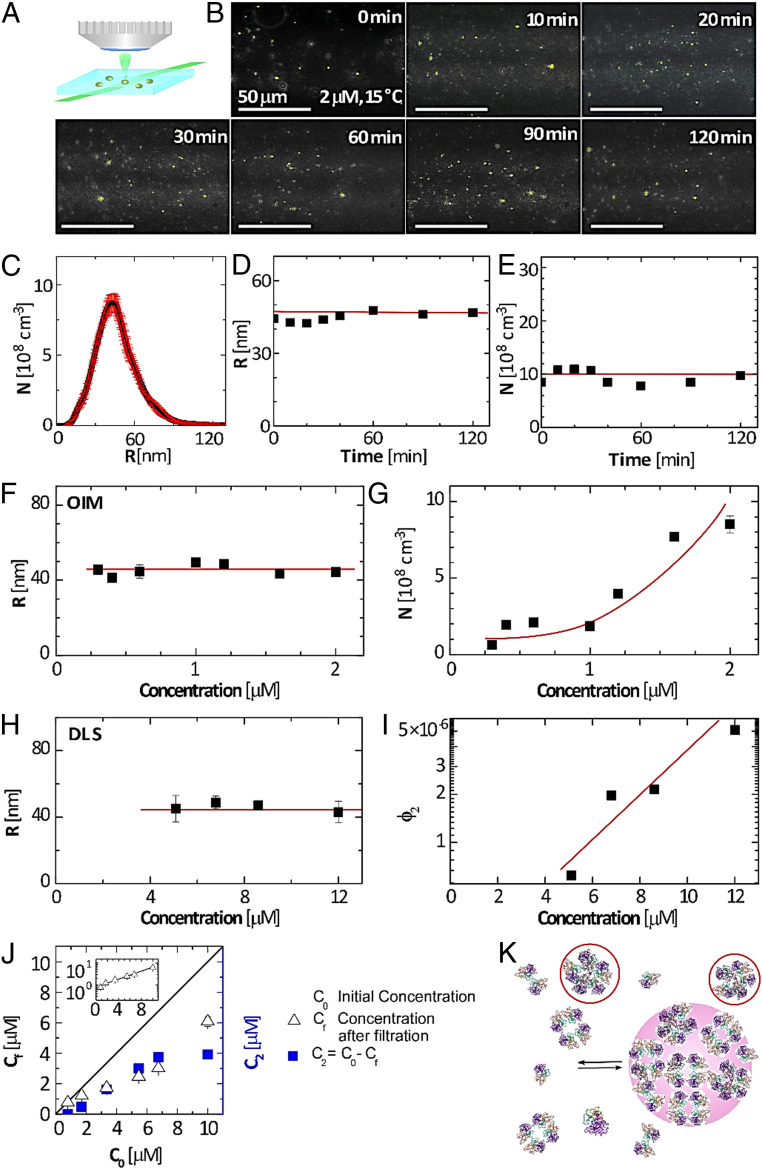
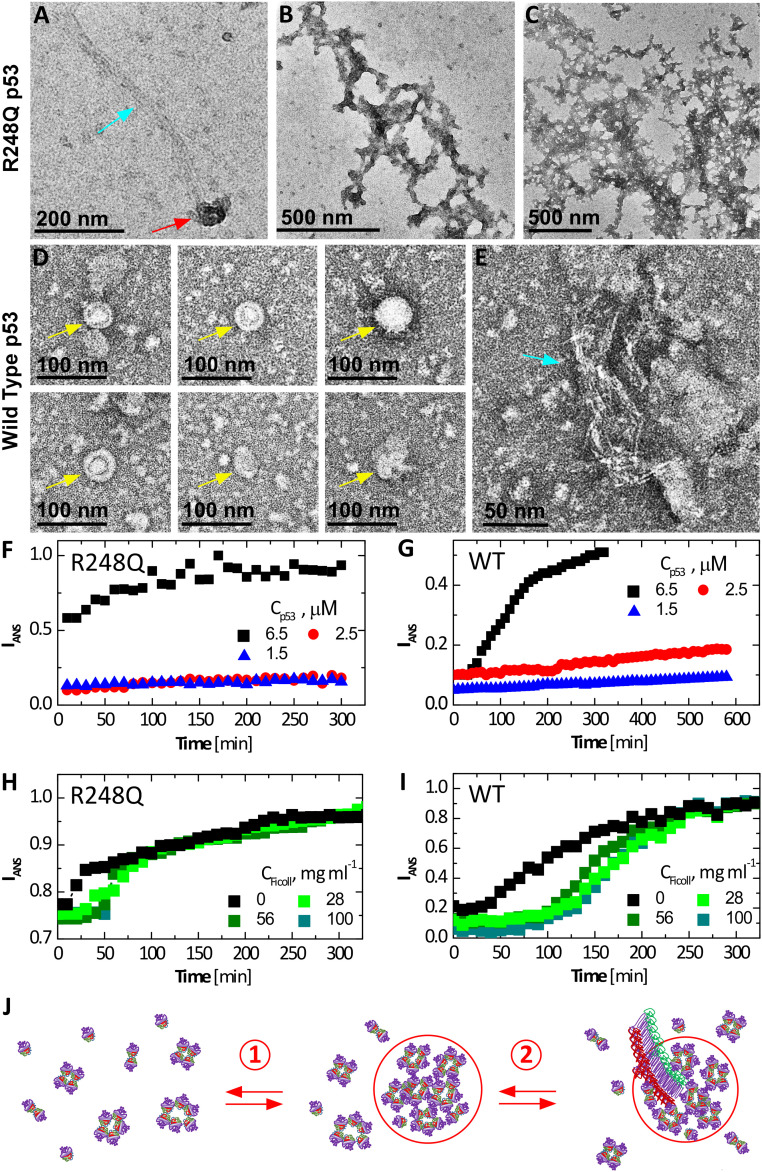
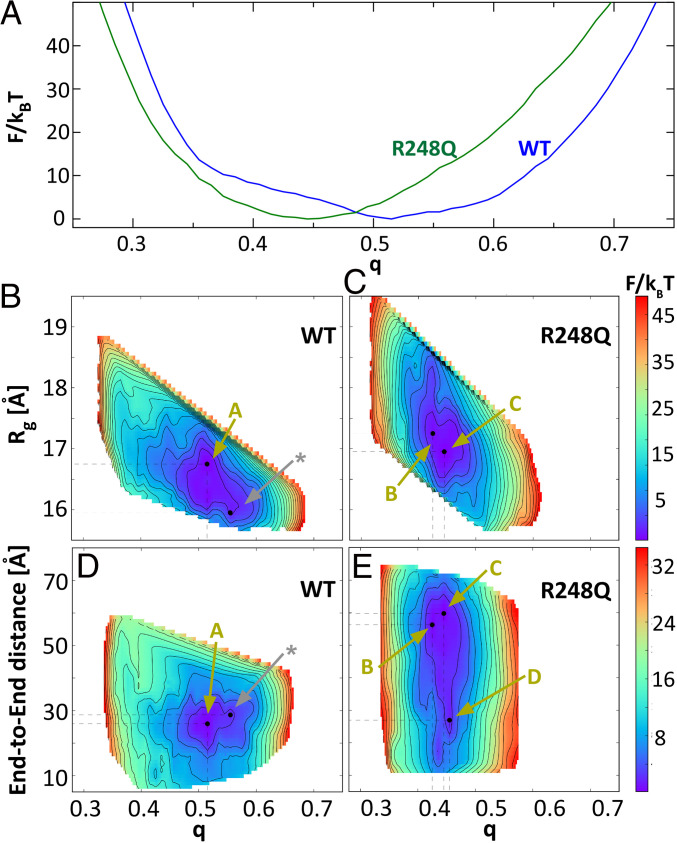
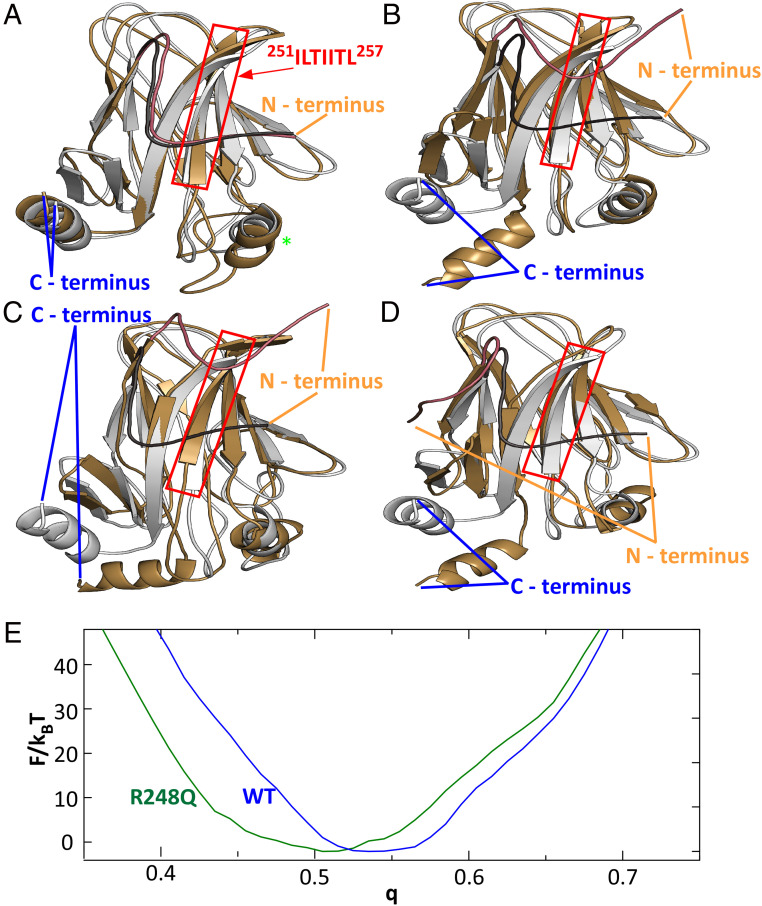
The protein p53 is a crucial tumor suppressor, often called "the guardian of the genome"; however, mutations transform p53 into a powerful cancer promoter. The oncogenic capacity of mutant p53 has been ascribed to enhanced propensity to fibrillize and recruit other cancer fighting proteins in the fibrils, yet the pathways of fibril nucleation and growth remain obscure. Here, we combine immunofluorescence three-dimensional confocal microscopy of human breast cancer cells with light scattering and transmission electron microscopy of solutions of the purified protein and molecular simulations to illuminate the mechanisms of phase transformations across multiple length scales, from cellular to molecular. We report that the p53 mutant R248Q (R, arginine; Q, glutamine) forms, both in cancer cells and in solutions, a condensate with unique properties, mesoscopic protein-rich clusters. The clusters dramatically diverge from other protein condensates. The cluster sizes are decoupled from the total cluster population volume and independent of the p53 concentration and the solution concentration at equilibrium with the clusters varies. We demonstrate that the clusters carry out a crucial biological function: they host and facilitate the nucleation of amyloid fibrils. We demonstrate that the p53 clusters are driven by structural destabilization of the core domain and not by interactions of its extensive unstructured region, in contradistinction to the dense liquids typical of disordered and partially disordered proteins. Two-step nucleation of mutant p53 amyloids suggests means to control fibrillization and the associated pathologies through modifying the cluster characteristics. Our findings exemplify interactions between distinct protein phases that activate complex physicochemical mechanisms operating in biological systems.
Keywords: fibrillization; nucleation mechanism; precursors.
Conflict of interest statement
The authors declare no competing interest.
Figures
Similar articles
-
Mutant p53 aggregates into prion-like amyloid oligomers and fibrils: implications for cancer.J Biol Chem. 2012 Aug 10;287(33):28152-62. doi: 10.1074/jbc.M112.340638. Epub 2012 Jun 19. J Biol Chem. 2012. PMID: 22715097 Free PMC article.
-
Disruption of an intermonomer salt bridge in the p53 tetramerization domain results in an increased propensity to form amyloid fibrils.Protein Sci. 2005 Dec;14(12):2993-3003. doi: 10.1110/ps.051622005. Epub 2005 Oct 31. Protein Sci. 2005. PMID: 16260757 Free PMC article.
-
Unfolding, aggregation, and amyloid formation by the tetramerization domain from mutant p53 associated with lung cancer.Biochemistry. 2006 Feb 14;45(6):1608-19. doi: 10.1021/bi051192j. Biochemistry. 2006. PMID: 16460008 Free PMC article.
-
Expanding the prion concept to cancer biology: dominant-negative effect of aggregates of mutant p53 tumour suppressor.Biosci Rep. 2013 Jul 25;33(4):e00054. doi: 10.1042/BSR20130065. Biosci Rep. 2013. PMID: 24003888 Free PMC article. Review.
-
Amyloidogenicity of p53: a hidden link between protein misfolding and cancer.Curr Protein Pept Sci. 2015;16(2):135-46. Curr Protein Pept Sci. 2015. PMID: 25692950 Review.
Cited by
-
Protein conformation and biomolecular condensates.Curr Res Struct Biol. 2022 Sep 14;4:285-307. doi: 10.1016/j.crstbi.2022.09.004. eCollection 2022. Curr Res Struct Biol. 2022. PMID: 36164646 Free PMC article. Review.
-
A dual growth mode unique for organic crystals relies on mesoscopic liquid precursors.Commun Chem. 2024 Aug 28;7(1):190. doi: 10.1038/s42004-024-01275-3. Commun Chem. 2024. PMID: 39198705 Free PMC article.
-
Multiscale simulations reveal the driving forces of p53C phase separation accelerated by oncogenic mutations.Chem Sci. 2024 Jul 15;15(32):12806-12818. doi: 10.1039/d4sc03645j. eCollection 2024 Aug 14. Chem Sci. 2024. PMID: 39148776 Free PMC article.
-
Characterization of full-length p53 aggregates and their kinetics of formation.Biophys J. 2022 Nov 15;121(22):4280-4298. doi: 10.1016/j.bpj.2022.10.013. Epub 2022 Oct 13. Biophys J. 2022. PMID: 36230002 Free PMC article.
-
Anticancer Therapeutic Strategies Targeting p53 Aggregation.Int J Mol Sci. 2022 Sep 20;23(19):11023. doi: 10.3390/ijms231911023. Int J Mol Sci. 2022. PMID: 36232329 Free PMC article. Review.
References
-
- Levine A. J., Targeting therapies for the p53 protein in cancer treatments. Annu. Rev. Cancer Biol. 3, 21–34 (2019).
-
- Muller P. A. J., Vousden K. H., p53 mutations in cancer. Nat. Cell Biol. 15, 2–8 (2013). - PubMed
-
- Joerger A. C., Fersht A. R., The p53 pathway: Origins, inactivation in cancer, and emerging therapeutic approaches. Annu. Rev. Biochem. 85, 375–404 (2016). - PubMed
Publication types
MeSH terms
Substances
Grants and funding
LinkOut - more resources
Full Text Sources
Other Literature Sources
Research Materials
Miscellaneous
