. 2021 Feb 24;11(1):4509.
doi: 10.1038/s41598-021-84011-4.

Notch signaling drives development of Barrett's metaplasia from Dclk1-positive epithelial tuft cells in the murine gastric mucosa

Affiliations

Notch signaling drives development of Barrett's metaplasia from Dclk1-positive epithelial tuft cells in the murine gastric mucosa

Bettina Kunze et al. Sci Rep. .

Abstract

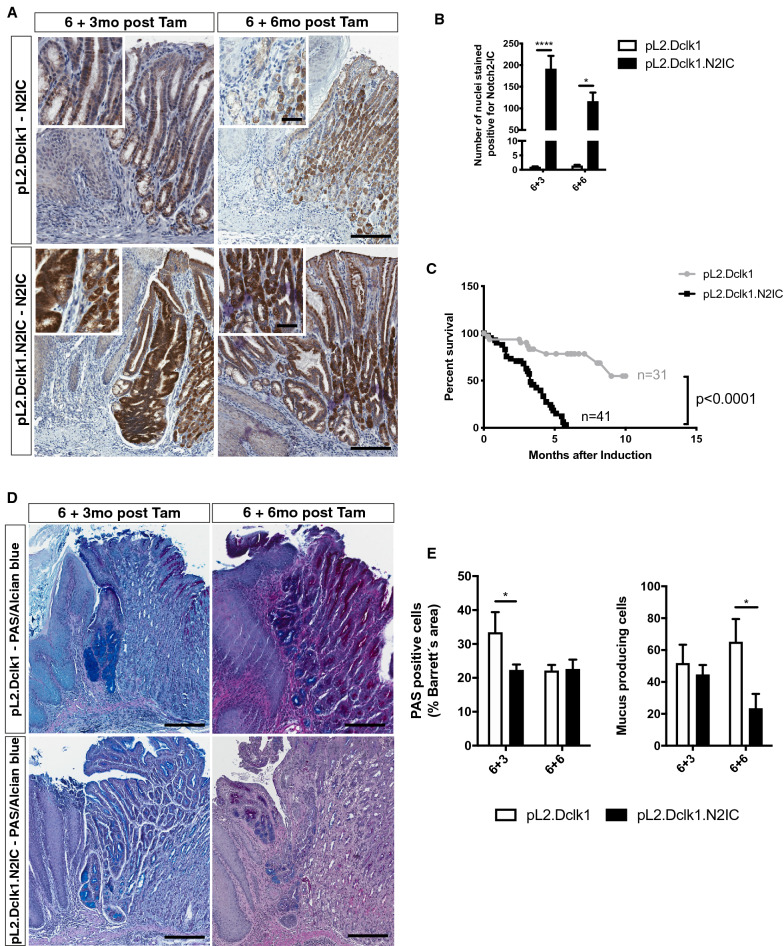
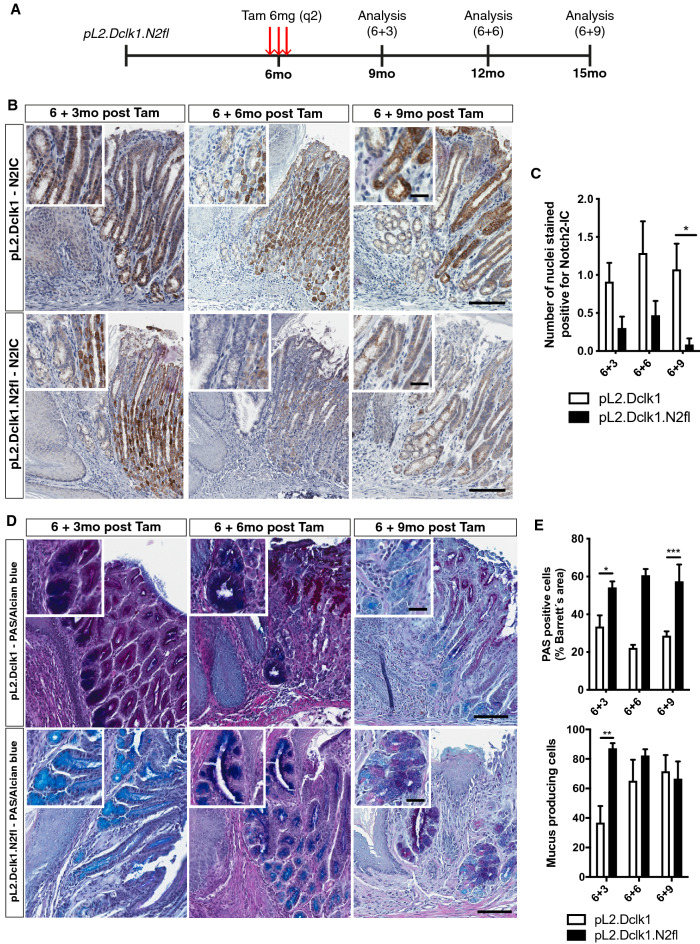
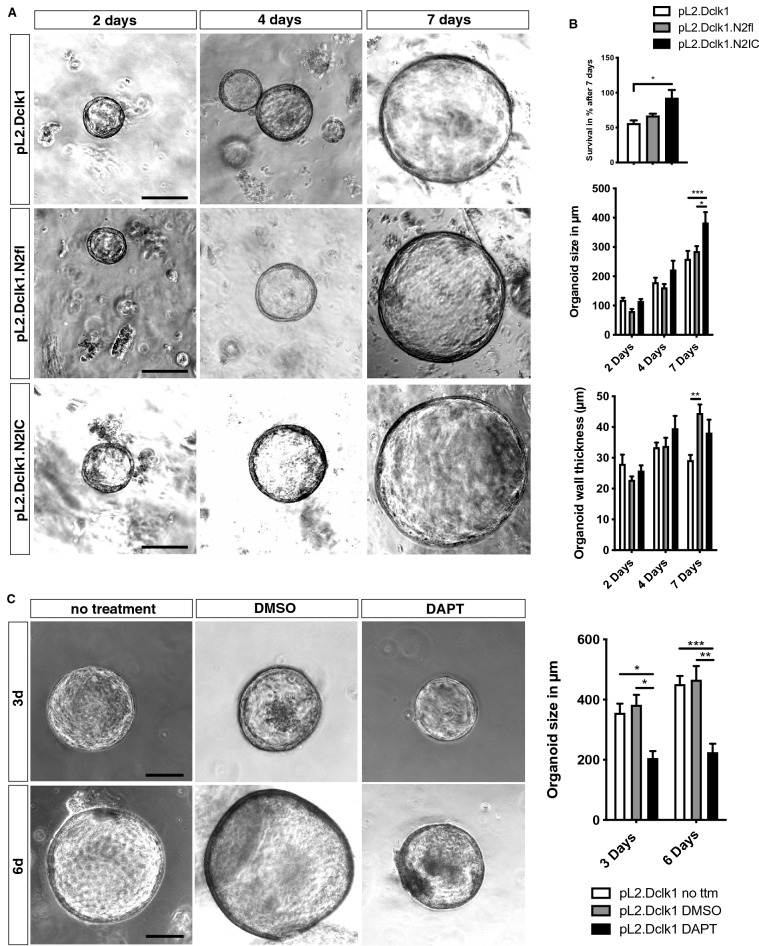
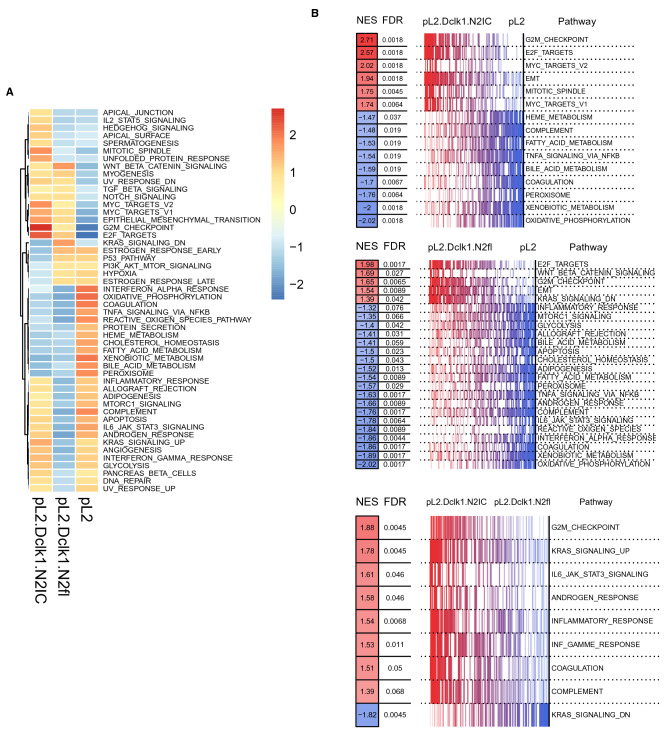
Barrett's esophagus (BE) is a precursor to esophageal adenocarcinoma (EAC), but its cellular origin and mechanism of neoplastic progression remain unresolved. Notch signaling, which plays a key role in regulating intestinal stem cell maintenance, has been implicated in a number of cancers. The kinase Dclk1 labels epithelial post-mitotic tuft cells at the squamo-columnar junction (SCJ), and has also been proposed to contribute to epithelial tumor growth. Here, we find that genetic activation of intracellular Notch signaling in epithelial Dclk1-positive tuft cells resulted in the accelerated development of metaplasia and dysplasia in a mouse model of BE (pL2.Dclk1.N2IC mice). In contrast, genetic ablation of Notch receptor 2 in Dclk1-positive cells delayed BE progression (pL2.Dclk1.N2fl mice), and led to increased secretory cell differentiation. The accelerated BE progression in pL2.Dclk1.N2IC mice correlated with changes to the transcriptomic landscape, most notably for the activation of oncogenic, proliferative pathways in BE tissues, in contrast to upregulated Wnt signalling in pL2.Dclk1.N2fl mice. Collectively, our data show that Notch activation in Dclk1-positive tuft cells in the gastric cardia can contribute to BE development.


Conflict of interest statement

The authors declare no competing interests.

Figures

Figure 1
Figure 1
Notch activation in Dclk1-positive gastric tuft cells accelerates BE progression. (A) Experimental scheme illustrating timepoints of tamoxifen induction and tissue collection for analysis. (B) Representative H&E pictures of the SCJ of pL2.Dclk1 and pL2.Dclk1.N2IC mice, respectively; scale bars = 200 µm. (C) Histopathologic scoring in pL2.Dclk1.N2IC compared to pL2.Dclk1 controls for metaplasia (6 + 3 n = 23 pL2.Dclk1.N2IC, n = 7 pL2.Dclk1 controls; ordinary two-way ANOVA, p = 0.029) and dysplasia (6 + 3 n = 20 pL2.Dclk1.N2IC, n = 7 pL2.Dclk1 controls; ordinary two-way ANOVA, p = 0.033). (D) Representative macroscopic pictures of the opened stomach of pL2.Dclk1 and pL2.Dclk1.N2IC mice, respectively; scale bars = 0.5 cm. (E) Macroscopic scoring in pL2.Dclk1.N2IC compared to pL2.Dclk1 controls (6 + 3 n = 14 pL2.Dclk1, n = 42 pL2.Dclk1.N2IC mice, ordinary two-way ANOVA, p = 0.0001; 6 + 6 n = 8 pL2.Dclk1, n = 22 pL2.Dclk1.N2IC mice, ordinary two-way ANOVA, p ≤ 0.0001). (F) Histopathologic scoring in pL2.Dclk1.N2IC mice compared to pL2.Dclk1 controls for the number of crypt fissions (6 + 3 n = 7 pL2.Dclk1, n = 19 pL2.Dclk1.N2IC mice, multiple t test, adj. p = 0.019; 6 + 6 n = 6 pL2.Dclk1, n = 9 pL2.Dclk1.N2IC mice, multiple t test, adj. p = 0.035); error bars indicate SEM.
Figure 2
Figure 2
Metaplastic lesions in pL2.Dclk1.N2IC mice are partially derived from Dclk1-positive gastric tuft cells. (A) Representative stainings for Notch2-IC of the SCJ of pL2.Dclk1 and pL2.Dclk1.N2IC mice, respectively; scale bars = 200 µm; insets scale bar = 50 µm. (B) Histopathologic scoring of Notch2-IC stained nuclei in pL2.Dclk1.N2IC tissues compared to pL2.Dclk1 controls (6 + 3 n = 25 pL2.Dclk1.N2IC, n = 11 pL2.Dclk1 controls; ordinary two-way ANOVA, p ≤ 0.0001; 6 + 6 n = 20 pL2.Dclk1.N2IC, n = 7 pL2.Dclk1 controls; ordinary two-way ANOVA, p = 0.046). (C) Survival analysis of pL2.Dclk1.N2IC compared to pL2.Dclk1 controls shows significant decrease of median overall survival in pL2.Dclk1.N2IC mice (n = 41 pL2.Dclk1.N2IC; n = 31 pL2.Dclk1 controls; Median survival pL2.Dclk1.N2IC = 3.3 months; Median survival pL2.Dclk1 ≥ 10 months; log-rank (Mantel-Cox) test, Chi square = 25,91, p ≤ 0.0001). (D, E) Histopathologic analysis and scoring in pL2.Dclk1.N2IC tissues compared to pL2.Dclk1 controls for PAS-positive cells at the SCJ (6 + 3 n = 21 pL2.Dclk1.N2IC, n = 6 pL2.Dclk1 controls; ordinary two-way ANOVA, p = 0.025; 6 + 6 n = 9 pL2.Dclk1.N2IC, n = 2 pL2.Dclk1 controls) and mucous producing cells (6 + 3 n = 21 pL2.Dclk1.N2IC, n = 6 pL2.Dclk1 controls; 6 + 6 n = 6 pL2.Dclk1.N2IC, n = 4 pL2.Dclk1 controls, ordinary two-way ANOVA, p = 0.049); scale bars = 200 µm; error bars indicate SEM.
Figure 3
Figure 3
Genetic ablation of the Notch 2 receptor in Dclk1-positive gastric tuft cells decelerates BE progression. (A) Experimental scheme illustrating timepoints of Tamoxifen induction and tissue collection for analysis. (B) Representative stainings for Notch2-IC of the SCJ of pL2.Dclk1 and pL2.Dclk1.N2fl mice, respectively; scale bars = 200 µm; insets scale bar = 50 µm; for pL2.Dclk1, at 6 + 3 and 6 + 6 the same pictures are shown as in Fig. 2A for comparison to pL2.Dclk1.N2fl tissues. (C) Histopathologic scoring of Notch2-IC stained nuclei in pL2.Dclk1.N2fl tissues compared to pL2.Dclk1 controls (6 + 3 n = 10 pL2.Dclk1.N2fl, n = 11 pL2.Dclk1 controls; 6 + 6 n = 15 pL2.Dclk1.N2fl, n = 7 pL2.Dclk1 controls; 6 + 9 n = 12 pL2.Dclk1.N2fl, n = 14 pL2.Dclk1 controls, ordinary two-way ANOVA, p = 0.014). (D, E) Histopathologic analysis and scoring in pL2.Dclk1.N2fl tissues compared to pL2.Dclk1 controls for PAS-positive cells at the SCJ (6 + 3 n = 6 pL2.Dclk1.N2fl, n = 6 pL2.Dclk1 controls, ordinary two-way ANOVA, p = 0.017; 6 + 6 n = 9 pL2.Dclk1.N2fl, n = 2 pL2.Dclk1 controls; 6 + 9 n = 5 pL2.Dclk1.N2fl, n = 7 pL2.Dclk1 controls, ordinary two-way ANOVA, p = 0.0009) and mucous producing cells (6 + 3 n = 5 pL2.Dclk1.N2fl, n = 6 pL2.Dclk1 controls, ordinary two-way ANOVA, p = 0.0057; 6 + 6 n = 9 pL2.Dclk1.N2fl, n = 4 pL2.Dclk1 controls; 6 + 9 n = 7 pL2.Dclk1.N2fl, n = 7 pL2.Dclk1 controls); scale bars = 200 µm; insets scale bar = 50 µm; error bars indicate SEM.
Figure 4
Figure 4
Notch signaling confers epithelial-intrinsic modulations of organoid growth and differentiation. (A) Representative brightfield pictures of cardia organoids of pL2.Dclk1, pL2.Dclk1.N2fl and pL2.Dclk1.N2IC mice, respectively; scale bars = 100 µm. (B) Organoid survival and size showed significantly increased in organoids from pL2.Dclk1.N2IC mice (measurements n = 6 pL2.Dclk1, n = 5 pL2.Dclk1.N2fl, n = 4 pL2.Dclk1.N2IC, Kruskal–Wallis test, pL2.Dclk1 vs. pL2.Dclk1.N2IC p = 0.028), organoid size (2d, measurements n = 47 pL2.Dclk1, n = 15 pL2.Dclk1.N2fl, n = 19 pL2.Dclk1.N2IC; 4d n = 39 pL2.Dclk1, n = 53 pL2.Dclk1.N2fl, n = 12 pL2.Dclk1.N2IC; 7d n = 29 pL2.Dclk1, n = 20 pL2.Dclk1.N2fl, n = 17 pL2.Dclk1.N2IC; ordinary two-way ANOVA, pL2.Dclk1 vs. pL2.Dclk1.N2IC p = 0.001, pL2.Dclk1.N2fl vs. pL2.Dclk1.N2IC p = 0.007), while organoid wall thickness significantly increased in organoids from pL2.Dclk1.N2fl mice (2d, measurements n = 47 pL2.Dclk1, n = 15 pL2.Dclk1.N2fl, n = 19 pL2.Dclk1.N2IC; 4d n = 39 pL2.Dclk1, n = 48 pL2.Dclk1.N2fl, n = 12 pL2.Dclk1.N2IC; 7d n = 30 pL2.Dclk1, n = 23 pL2.Dclk1.N2fl, n = 18 pL2.Dclk1.N2IC; ordinary two-way ANOVA, pL2.Dclk1 vs. pL2.Dclk1.N2fl p = 0.0011). (C) Representative brightfield pictures of pL2.Dclk1 cardia organoids undergoing the indicated treatments; scale bars = 100 µm. Organoid size was significantly reduced following treatment with DAPT (3d measurements n = 44 pL2.Dclk1, n = 38 pL2.Dclk1 DMSO, n = 19 pL2.Dclk1 DAPT, ordinary two-way ANOVA, pL2.Dclk1 vs. pL2.Dclk1 DAPT p = 0.041, pL2.Dclk1 DMSO vs. pL2.Dclk1 DAPT p = 0.015; 6d n = 98 pL2.Dclk1, n = 22 pL2.Dclk1 DMSO, n = 17 pL2.Dclk1 DAPT, ordinary two-way ANOVA, pL2.Dclk1 vs. pL2.Dclk1 DAPT p = 0.0005, pL2.Dclk1 DMSO vs. pL2.Dclk1 DAPT p = 0.0031); error bars indicate SEM.
Figure 5
Figure 5
Notch activation in Dclk1-positive crypt epithelial cells induces upregulation of oncogenic signaling. (A) Analysis of HALLMARK gene sets (OneVsRest) of the indicated genotypes, scale bar indicates log2-fold changes of genes (Z-Scores; positive lgFC indicates higher gene expression in the respective group). (B) Grouped analyses of the indicated genotypes for changes in hallmark pathway gene sets, NES = normalized enrichment score, FDR = false discovery rate (red indicating increased, blue indicating decreased).

Similar articles

Cited by

References

    1. Spechler SJ, Souza RF. Barrett's esophagus. N. Engl. J. Med. 2014;371:836–845. doi: 10.1056/NEJMra1314704. - DOI - PubMed
    1. Nakagawa H, et al. The targeting of the cyclin D1 oncogene by an Epstein-Barr virus promoter in transgenic mice causes dysplasia in the tongue, esophagus and forestomach. Oncogene. 1997;14:1185–1190. doi: 10.1038/sj.onc.1200937. - DOI - PubMed
    1. Quante M, et al. Bile acid and inflammation activate gastric cardia stem cells in a mouse model of Barrett-like metaplasia. Cancer Cell. 2012;21:36–51. doi: 10.1016/j.ccr.2011.12.004. - DOI - PMC - PubMed
    1. Van Es JH, et al. Notch/gamma-secretase inhibition turns proliferative cells in intestinal crypts and adenomas into goblet cells. Nature. 2005;435:959–963. doi: 10.1038/nature03659. - DOI - PubMed
    1. Kim TH, Shivdasani RA. Notch signaling in stomach epithelial stem cell homeostasis. J. Exp. Med. 2011;208:677–688. doi: 10.1084/jem.20101737. - DOI - PMC - PubMed

Publication types

MeSH terms

Supplementary concepts