Clinical Trial
. 2021 Apr 5;218(4):e20201637.
doi: 10.1084/jem.20201637.

A TRPA1 inhibitor suppresses neurogenic inflammation and airway contraction for asthma treatment

Affiliations
Clinical Trial

A TRPA1 inhibitor suppresses neurogenic inflammation and airway contraction for asthma treatment

Alessia Balestrini et al. J Exp Med. .

Abstract

Despite the development of effective therapies, a substantial proportion of asthmatics continue to have uncontrolled symptoms, airflow limitation, and exacerbations. Transient receptor potential cation channel member A1 (TRPA1) agonists are elevated in human asthmatic airways, and in rodents, TRPA1 is involved in the induction of airway inflammation and hyperreactivity. Here, the discovery and early clinical development of GDC-0334, a highly potent, selective, and orally bioavailable TRPA1 antagonist, is described. GDC-0334 inhibited TRPA1 function on airway smooth muscle and sensory neurons, decreasing edema, dermal blood flow (DBF), cough, and allergic airway inflammation in several preclinical species. In a healthy volunteer Phase 1 study, treatment with GDC-0334 reduced TRPA1 agonist-induced DBF, pain, and itch, demonstrating GDC-0334 target engagement in humans. These data provide therapeutic rationale for evaluating TRPA1 inhibition as a clinical therapy for asthma.


Figures

None
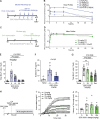
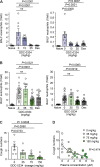
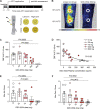
Graphical abstract
Figure S1.
Figure S1.
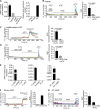
Calcium influx and TRPA1 gene expression in human, mouse, rat, and guinea pig primary cells. (A) Relative TRPA1 mRNA amounts were measured by Taqman Real-Time PCR assay in primary HASMCs, HLFs, HAECs, air-liquid interface of normal HAECs (ALI-NHAECs), and human lung endothelial cells (HLECs) from healthy volunteers. Results are normalized to the reference gene GAPDH. (B–D) Functional calcium imaging responses to the TRPA1 agonist AITC cultured with or without GDC-0334 from HASMCs (B), undifferentiated (Undiff) HAECs (C), and HLFs (D). Graphs to the right of the traces represent normalized AUC (two-tailed unpaired t test). Data are expressed as the mean ± SD. (E) Relative Trpa1 mRNA amounts were measured by Taqman Real-Time PCR assay from primary mouse DRGs (m-DRGs), mouse lung fibroblast (m-LFs), mouse ASM cells (m-ASMCs), undifferentiated mouse airway epithelial cells (m-AECs), rat DRGs (R-DRGs), ASM cells (R-ASMCs) and lung fibroblasts (R-LFs), and guinea pig DRGs (GP-DRGs), and guinea pig ASM cells (GP-ASMCs). Results are normalized to the reference gene b-actin or Gapdh. (F) Functional calcium imaging responses to the TRPA1 agonist AITC cultured from m-ASMCs. Ionomycin treatment was used as positive control for calcium influx. Graph to the right of the traces represents normalized AUC (two-tailed unpaired t test). Data are expressed as the mean ± SD. (G) Functional calcium imaging responses to the TRPA1 agonist AITC cultured in guinea pig ASMCs. Graph to the right of the traces represents normalized AUC. Data are expressed as the mean ± SD.
Figure 1.
Figure 1.
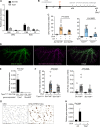
Expression pattern and functionality of neuronal and nonneuronal TRPA1 in the lungs across species. (A) Calcium influx responses to AITC in the presence or absence of GDC-0334, from HASMCs, HLFs, and HAECs. Graphs represent normalized AUC (two-tailed unpaired t test). Five biological replicates were performed. A total of 75–120 cells/biological replicates were analyzed. Data are expressed as the mean ± SD. (B and C) Summary of TRPA1 expression and calcium influx in primary cells from human and preclinical species. (D–F) Analysis of leukocyte infiltration in the BALF of OVA-challenged or unchallenged mice from Scn10a-Dtr+ (D), Trpa1+/+ or Trpa1−/− (E), and Trpa1flox/flox Slc17a6cre+or Trpa1flox/flox Slc17a6cre− (F) mice. Data are expressed as the mean ± SEM; n ≥ 8 animals per group. A comparison for each pair was performed using one-way ANOVA or two-tailed t test. (G and H) TRPA1 immunostaining of Trpa1+/+ or Trpa1−/− mice. Scale bars = 100 µm. (G) Nodose ganglia and vagus nerve. The insets depict a higher magnification of the axons of nodose neurons. Scale bar = 10 µm. (H) Lung sections of naive and OVA-challenged mice. AEC, airway epithelial cell; ASMC, Airway smooth muscle cell; LF, lung fibroblast.
Figure S2.
Figure S2.
TRPA1 neuronal and nonneuronal contributions to OVA-induced airway inflammation in mice. (A) Trpa1 and Nav1.8 gene expression in nodose ganglion (NDS) and DRG after ablation of Nav1.8-expressing sensory neurons with DT. Error bars represent SEM; n = 3 animals per group. (B) Schematic outline of OVA challenge and DT treatment. (C) Analysis of leukocyte infiltration in the BALF of OVA-challenged mice. Eosinophil (EOS) cell counts from mice ablated of Nav1.8-expressing sensory neurons with DT (Scn10a-DTR+) or not (Scn10a-DTR) and Trpa1+/+ versus Trpa1−/− mice. Error bars represent SEM; n ≥ 8 animals per group. A comparison for each pair was performed using one-way ANOVA. (D) Whole-mount staining for β-III tubulin (green) and tdTomato (Tdt; pink) fluorescence in a flattened lung left lobe from a Vglut2 Cre mouse. Scale bar = 500 µm. (E) Total RNA extracted from primary mouse nodose ganglion of Trpa1flox/flox Slc17a6cre+ and Trpa1flox/flox Slc17a6cre−. Relative Trpa1 mRNA amounts were measured by Taqman Real-Time PCR assay. Results are normalized to the reference gene b-actin. Expression of Muc5AC gene was used as negative control. Error bars represent SEM; n ≥ 3 animals per group. A comparison for each pair was performed using two-tailed t test. (F) Analysis of leukocyte infiltration in the BALF of OVA-challenged mice: eosinophil (left) and neutrophil (right) cell counts from mice depleted or not of neuronal TRPA1 (Trpa1flox/flox Slc17a6cre+ or TrpaA1flox/flox Slc17a6cre−, respectively). Error bars represent SEM; n ≥ 8 animals per group. A comparison for each pair was performed using two-tailed t test. (G) Representative images of TRPA1 immunostaining show intense staining in doxycycline (dox)-induced mouse TRPA1-expressing CHO cells (CHO-mTRPA1+dox) and nodose ganglion from mouse Trpa1+/+. No staining is detected in the absence of doxycycline (CHO) used as negative control. Scale bar = 100 µm. (H) Increased lung IL5 transcription in Trpa1+/+ OVA-challenged mice treated was determined by Taqman quantitative PCR. In the same samples, no Trpa1 gene expression was detected. B-actin transcript levels were used for normalization as endogenous control. Animal groups OVA− (naive): n = 7; OVA+: n = 8. Error bars represent SEM; animal groups OVA− (naive): n = 7; OVA+: n = 8. A comparison for each pair was performed using two-tailed t test.
Figure 2.
Figure 2.
In vitro and in vivo binding properties of GDC-0334 are consistent with a potent, specific, and orally bioavailable TRPA1 inhibitor. (A) Structure of GDC-0334. (B) Cross-species TRPA1 potencies of GDC-0334 as measured in CHO cell line–based fluorometric imaging plate reader Ca2+ assays. (C) Inhibitory dose–response curves of TRPA1 antagonists (Table S1 B) on HASMC contraction assay. (D) Physicochemical and in vitro ADME properties of GDC-0334. (E) Cross-species IV/oral (PO) PK parameters of GDC-0334. CL, clearance; CLhep, hepatic clearance of drug; IV, intravenous; VSS, volume of distribution; F, bioavailability.
Figure 3.
Figure 3.
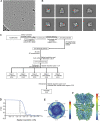
CryoEM reveals binding of GDC-0334 to the human TRPA1 transmembrane domain. (A) The cryoEM map of human TRPA1 in complex with GDC-0334 in an isosurface rendering. TRPA1 protomers are colored red, green, pale yellow, and blue; GDC-0334 is in bright yellow. Map features without assigned atomic structures are colored purple. Gray bars indicate the approximate locations of the membrane boundaries. (B) Side chains involved in contacts with GDC-0334 are shown in stick representation. The cryoEM map surrounding the ligand is shown in a transparent isosurface representation.
Figure S3.
Figure S3.
CryoEM structure determination of human TRPA1–GDC-0334. (A) Representative micrograph. (B) Representative class averages. (C) Single-particle image processing workflow. (D) Fourier Shell Correlation (FSC) between two half datasets yields a global resolution estimate of ∼3.6 Å. No spatial frequencies beyond 1/4.8 Å−1 were used at any point during refinement. CTF, contrast transfer function. (E) Heat map representation of the distribution of assigned particle orientations shows a bias toward side views (near the periphery of the plot). (F) Isosurface rendering of the three-dimensional map with surface coloring according to the local resolution estimated by windowed FSCs (Cardone et al., 2013).
Figure 4.
Figure 4.
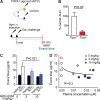
GDC-0334 suppresses AITC-induced edema in vivo in rat. (A) Experimental outline of vascular permeability (measured by NIRF [B] or Evans blue [C]) after AITC or vehicle application. (B) Normalized AUC from 5–20 min after AITC application. (B and C) Data are expressed as the mean ± SD; n = 4–6 animals per group; two-tailed unpaired t test. (D) GDC-0334 plasma concentration and vascular permeability correlation. n = 4 or 5/group. Curve fitting was obtained by a four-parameter nonlinear regression. Dex, dexamethasone.
Figure S4.
Figure S4.
GDC-0334 in vivo PK profiles and effect on OVA-induced asthma model in rats and guinea pigs and guinea pig model of cough. (A) Design of rat OVA asthma model. Brown Norway rats were sensitized or not (naive group) and challenged with OVA. Animals received either GDC-0334 or vehicle via oral delivery 3 h before OVA challenge. 24 h after the final OVA challenge (32 d after initial OVA sensitization), BALF was analyzed by FACS for eosinophils and neutrophils. (B) Plasma concentrations of GDC-0334 following 3, 10, 35, or 70 mg/kg oral administration to rats. The black line indicates IC90 value for GDC-0334 as determined in the Ca2+ influx cell-based assay and corrected for plasma protein binding. Mean and SD of three to six animals per group are shown. (C) Design of guinea pig OVA asthma model. Animals received either GDC-0334 or vehicle via oral delivery 3 h before OVA challenge. An unimmunized, unchallenged group was also included (naive). BALF was collected 24 h after the challenge for analysis of eosinophils and neutrophils. In both, A and B dexamethasone (Dex) was used as positive control. (D) Plasma concentrations of GDC-0334 following a single 35- or 70-mg/kg oral administration to guinea pigs. The black line indicates IC90 value for GDC-0334 as determined in the Ca2+ influx cell-based assay and corrected for plasma protein binding. Mean and SD of three to six animals per group are shown. (E and G) Analysis of total cell infiltration in the BALF of OVA-challenged rats (E) and guinea pigs (F). Error bars represent SEM; n = 4–6 animals per group. Comparison for each pair was performed using one-way ANOVA. (F) Analysis of SP level in BALF of naive and OVA-challenged rats (vehicle and GDC-0334 treated). Error bars represent SEM; n = 5–8 animals per group. Comparison for each pair was performed using one-way ANOVA. (H) Experimental outline of the cough model. Guinea pigs were dosed with GDC-0334 3 h before treatment with 25 mM aerosolized CA. 5 min after CA treatment, the number of coughs was continuously assessed over a period of 30 min. (I) Accumulated cough numbers in individual animals in response to CA in guinea pigs pretreated with GDC-0334 at dosages of 0, 35, 75, and 150 mg/kg. Data are expressed as the mean ± SEM. (J) Effect of oral gavage of vehicle (Veh) and indicated doses of GDC-0334 on cough latency (first cough after initiation of aerosol exposure of CA). Error bars represent SEM; n = 5–8 animals per group. PO, oral; QD, once a day.
Figure 5.
Figure 5.
GDC-0334 is efficacious in rat and guinea pig in vivo models of airway allergic inflammation and cough. (A and B) Total eosinophil and neutrophil cell counts from BALF of naive or OVA-challenged rats (A) or guinea pigs (B) pretreated with GDC-0334. Data are expressed as the mean ± SEM; n = 5–30 animals per group. Comparison for each pair was performed using one-way ANOVA. (C) CA-evoked cough in guinea pigs pretreated with GDC-0334. Data are expressed as the mean ± SEM; n = 7/group. Comparison for each pair was performed using one-way ANOVA. (D) Graph representing the correlation of the GDC-0334 dosage and its antitussive effects in guinea pigs. n = 6/group. Curve fitting was obtained by a three-parameter nonlinear regression.
Figure 6.
Figure 6.
GDC-0334 is a potent inhibitor of AITC-induced DBF in vivo in rats and guinea pigs. (A) Experimental outline of LSCI for B–H. (B) Representative flux signal 5 min after AITC or vehicle application in Trpa1+/+ and Trpa1−/− rats; normalized DBF AUC from 1–5 min after AITC application. The dashed line indicates 0%. Data are expressed as the mean ± SEM; n = 6 animals per group; two-tailed unpaired t test. (C) Representative flux signal 5 min after AITC application in a rat dosed with vehicle GDC-0334. Scale bar = 5 mm. (D) Dose-dependent reduction in normalized AUC in rats pretreated with GDC-0334 following AITC challenge (one-way ANOVA; P < 0.0001; F = 30.9; Tukey post hoc tests). Data expressed as the mean ± SEM; n = 6 animals per group. (E) GDC-0334 plasma and DBF correlation. Mean ± SEM; n = 6/group. Curve fitting was obtained by a three-parameter nonlinear regression. (F) Representative flux signals AITC application in guinea pigs treated with vehicle or 45 mg/kg GDC-0334. Scale bar = 10 mm. (G) GDC-0334 dose dependently reduced normalized AUC from 1 to 5 min after AITC application (one-way ANOVA; P = 0.026; F = 4.032; Tukey post hoc tests). Data expressed as the mean ± SEM; n = 4 or 5 animals per group. (H) Correlation of GDC-0334 plasma concentrations and AUC levels. n = 5/group. Curve fitting was obtained by a three-parameter nonlinear regression. a.u., arbitrary unit.
Figure S5.
Figure S5.
GDC-0334 reduces AITC-induced perfusion and nocifensive behavior in rats and itch and pain scores in humans. (A) Time course of flux signals for rats Trpa1+/+ (black curve) and Trpa1−/− (red curve). Arrow indicates the time of AITC treatment. Mean (bold line) ± 95% CI (shaded area); n = 6 animals per group. (B) Time course of flux signals for rats dosed with 0 (red), 3 (green), or 10 mg/kg (blue) GDC-0334. Arrow indicates the time of AITC treatment. Mean (bold line) ± 95% confidence interval (CI; shaded area); n = 6 animals per group. (C) Time course of mean fold change in the DBF signal relative to baseline following application of 15% AITC for each GDC-0334 dosing human cohort: n = 7 (0 mg), 6 (25 mg), 6 (75 mg), 6 (200 mg), and 5 (600 mg); data shown as mean ± SEM; repeated-measures ANOVA was used for statistical analysis. (D) Nocifensive behavior in rats pretreated with indicated doses of GDC-0334. Rats display flinching and hind paw–directed licking and biting (i.e., nocifensive behavior) upon intraplantar injection of AITC that is suppressed by GDC-0334 pretreatment in a dose-dependent manner. Data shown as mean ± SEM; repeated-measures ANOVA was used for statistical analysis. (E and F) Time course of itch (E) and pain (F) scores following topical application of AITC. n = 7 (0 mg), 6 (25 mg), 6 (75 mg), 6 (200 mg), and 5 (600 mg). Data are expressed as the mean ± SEM; repeated-measures ANOVA was used for statistical analysis.
Figure 7.
Figure 7.
GDC-0334 target engagement in humans. (A) Schematic of experimental design. (B) Representative flux signals from the same person when an AITC skin challenge was conducted on screen day (no drug) or after dosing with GDC-0334. Images were taken 5 min after AITC application. (C) Comparison of AITC-induced DBF AUC from 0 to 10 min in subjects dosed with placebo or GDC-0334. Data shown as mean ± SEM; n = 7 (0 mg), 6 (25 mg), 6 (75 mg), 6 (200 mg), or 5 (600 mg). Dunnett’s multiple comparison test used for statistical analysis to compare each GDC-0334 dose group with 0 mg. (D) Plasma concentrations relative to DBF AUC 0–10 min. n = 5 or 6/group. ρ (R2) determined by [inhibitor] versus response (three parameters) nonlinear regression. The dashed line indicates an AUC of 0. (E) Comparison of max itch induced by AITC in subjects dosed with placebo or GDC-0334. Data shown as mean ± SEM; n = 7 (0 mg), 6 (25 mg), 6 (75 mg), 6 (200 mg), or 5 (600 mg); Dunnett’s multiple comparison test. (F) Comparison of maximum pain induced by AITC in subjects dosed with placebo (0 mg) or GDC-0334. Data shown as mean ± SEM; n = 7 (0 mg), 6 (25 mg), 6 (75 mg), 6 (200 mg), or 5 (600 mg); Dunnett’s multiple comparison test.

Comment in

Similar articles

Cited by

References

    1. Andrè, E., Campi B., Materazzi S., Trevisani M., Amadesi S., Massi D., Creminon C., Vaksman N., Nassini R., Civelli M., et al. . 2008. Cigarette smoke-induced neurogenic inflammation is mediated by alpha,beta-unsaturated aldehydes and the TRPA1 receptor in rodents. J. Clin. Invest. 118:2574–2582. - PMC - PubMed
    1. Aubdool, A.A., Kodji X., Abdul-Kader N., Heads R., Fernandes E.S., Bevan S., and Brain S.D.. 2016. TRPA1 activation leads to neurogenic vasodilatation: involvement of reactive oxygen nitrogen species in addition to CGRP and NO. Br. J. Pharmacol. 173:2419–2433. 10.1111/bph.13519 - DOI - PMC - PubMed
    1. Bai, T.R., Zhou D., Weir T., Walker B., Hegele R., Hayashi S., McKay K., Bondy G.P., and Fong T.. 1995. Substance P (NK1)- and neurokinin A (NK2)-receptor gene expression in inflammatory airway diseases. Am. J. Physiol. 269:L309–L317. 10.1152/ajplung.1995.269.3.L309 - DOI - PubMed
    1. Baral, P., Umans B.D., Li L., Wallrapp A., Bist M., Kirschbaum T., Wei Y., Zhou Y., Kuchroo V.K., Burkett P.R., et al. . 2018. Nociceptor sensory neurons suppress neutrophil and γδ T cell responses in bacterial lung infections and lethal pneumonia. Nat. Med. 24:417–426. 10.1038/nm.4501 - DOI - PMC - PubMed
    1. Bautista, D.M., Pellegrino M., and Tsunozaki M.. 2013. TRPA1: A gatekeeper for inflammation. Annu. Rev. Physiol. 75:181–200. 10.1146/annurev-physiol-030212-183811 - DOI - PMC - PubMed

Publication types

MeSH terms