. 2021 Feb 17;12(1):1085.
doi: 10.1038/s41467-021-21181-9.

Reentrant liquid condensate phase of proteins is stabilized by hydrophobic and non-ionic interactions

Affiliations

Reentrant liquid condensate phase of proteins is stabilized by hydrophobic and non-ionic interactions

Georg Krainer et al. Nat Commun. .

Abstract

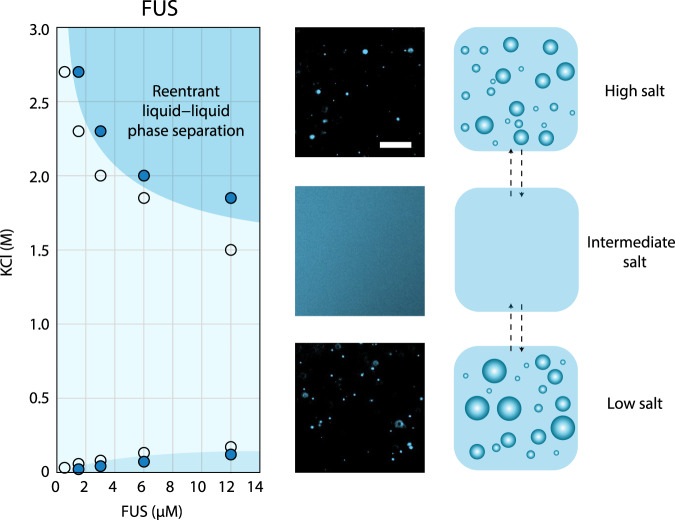
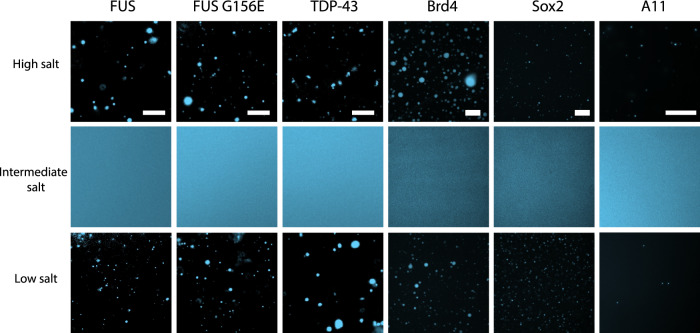
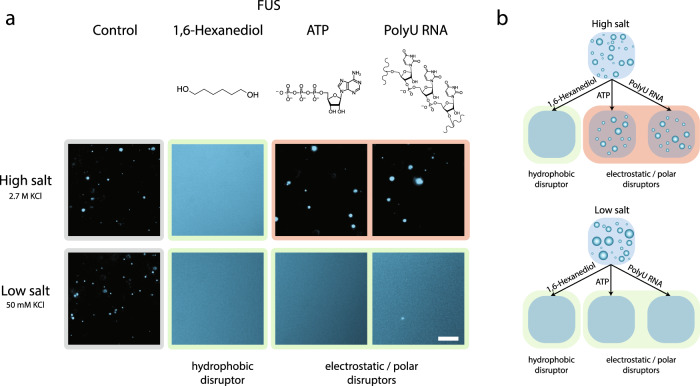
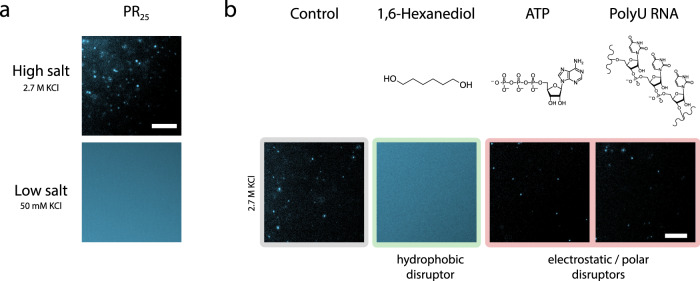
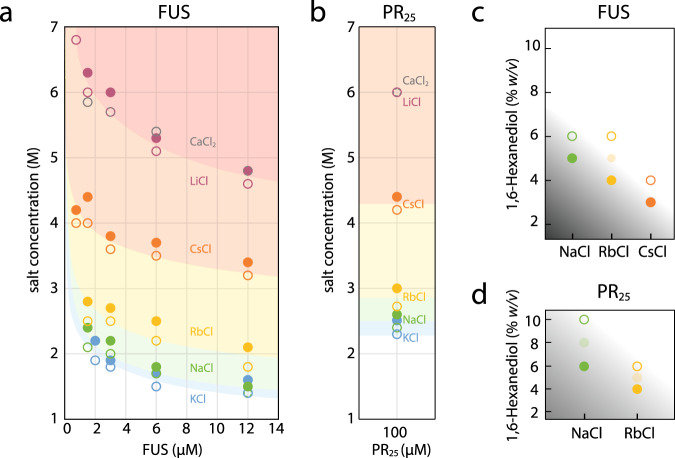
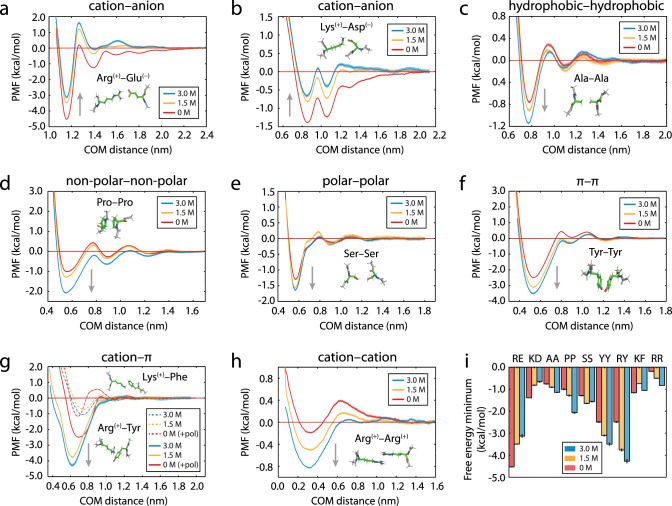
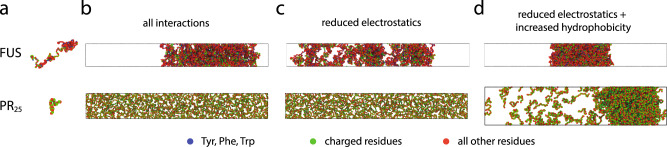
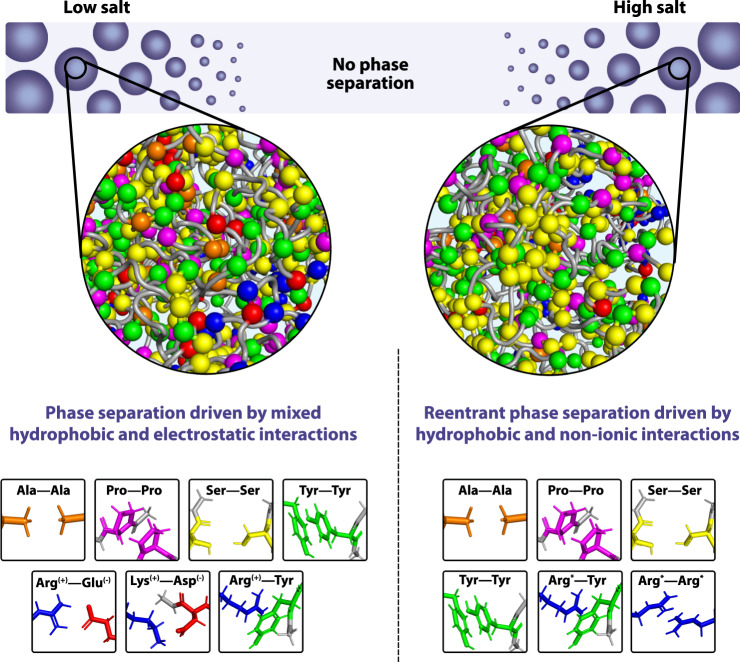
Liquid-liquid phase separation of proteins underpins the formation of membraneless compartments in living cells. Elucidating the molecular driving forces underlying protein phase transitions is therefore a key objective for understanding biological function and malfunction. Here we show that cellular proteins, which form condensates at low salt concentrations, including FUS, TDP-43, Brd4, Sox2, and Annexin A11, can reenter a phase-separated regime at high salt concentrations. By bringing together experiments and simulations, we demonstrate that this reentrant phase transition in the high-salt regime is driven by hydrophobic and non-ionic interactions, and is mechanistically distinct from the low-salt regime, where condensates are additionally stabilized by electrostatic forces. Our work thus sheds light on the cooperation of hydrophobic and non-ionic interactions as general driving forces in the condensation process, with important implications for aberrant function, druggability, and material properties of biomolecular condensates.


Conflict of interest statement

The authors declare no competing interests.

Figures

Fig. 1
Fig. 1. Reentrant phase separation of FUS at high salt.
Phase diagram (left), representative images (center), and schematic (right) of FUS phase separation in the presence of increasing concentrations of KCl. In the phase diagram, markers filled with blue indicate concentrations where phase separation was observed in fluorescence images. Open markers indicate concentrations tested where phase separation did not occur. Darker blue regions are guides for the eyes indicating regions where phase separation of FUS occurs, and light blue is the region where no phase separation occurs. The reentrant phase separation regime is indicated. Fluorescent images of FUS (6 μM, EGFP labeled) were taken at 50 mM (low salt), 500 mM (intermediate salt), and 2.7 M KCl (high salt) in 50 mM Tris-HCl (pH 7.2). Scale bar is 20 µm. Each data image (center panel) is representative of the observed behavior from at least three test replicates of the respective protein/salt conditions.
Fig. 2
Fig. 2. Salt-mediated reentrant phase separation of FUS, FUS G156E, TDP-43, Brd4, Sox2, and A11.
Representative images of FUS, FUS G156E, TDP-43 at 50 mM (low salt), 500 mM (intermediate salt), and 2.7 M KCl (high salt) in 50 mM Tris-HCl (pH 7.2); Brd4 and Sox2 at 50 mM (low salt), 500 mM (intermediate salt), and 2.15 M KCl (high salt); Brd4 buffer: 5 mM Tris (pH 7.5), 0.2 mM EDTA, 0.5% glycerol; Sox2 buffer: 5 mM Bis-Tris-Propane (pH 7.5), 0.5% glycerol; and A11 at 22.5 mM (low salt), 225 mM (intermediate salt), and 500 mM NaCl (high salt) in 20 mM HEPES (pH 7.0). For fluorescence imaging, both FUS variants and TDP-43 were tagged with EGFP and studied at a protein concentration of 6 μM; Brd4 and Sox2 were tagged with monoGFP and studied at protein concentrations of 6 µM and 12.4 µM, respectively; A11 was labeled with AlexaFluor647 and studied at a protein concentration of 15 μM. Scale bars are 20 µm in all images. Each data image (center panel) is representative of the observed behavior from at least three test replicates of the respective protein/salt conditions.
Fig. 3
Fig. 3. Dissolution assay of FUS condensates in the high- and low-salt regime using hydrophobic and electrostatic/polar disruptors.
a Representative images of FUS condensates upon addition of 1,6-hexanediol, ATP, and PolyU RNA are shown. Total protein concentration was 4.5 µM and final additive concentrations were 10% 1,6-hexanediol, 1.25 mg/mL PolyU RNA, 12.5 mM ATP in 50 mM Tris-HCl (pH 7.2) at 50 mM (low salt) and 2.7 M KCl (high salt). Conditions at which the disrupters dissolved the condensates are highlighted in green and those where condensates remained intact are highlighted in red. Scale bar is 20 μm. The images are representative of the observed reproducible behavior from at least three test replicates of the respective protein/salt conditions. b Schematic representation of the ability for electrostatic/polar disruptor molecules ATP and PolyU RNA to dissolve condensates in the low-salt regime but not in the high-salt regime, and for the hydrophobic disruptor 1,6-hexanediol to dissolve condensates in both regimes.
Fig. 4
Fig. 4. Phase separation and disruptor-mediated dissolution behavior of the PR25 peptide at high- and low-salt concentrations.
a Representative images of PR25 at 50 mM (low salt) and 2.7 M KCl (high salt) in 50 mM Tris-HCl (pH 7.2). The unlabeled peptide was mixed with a small amount of the same peptide labeled with AlexaFluor546; total peptide concentration was 72 μM. b Dissolution assay of PR25 condensates in the high-salt regime using hydrophobic (1,6-hexanediol) and electrostatic/polar disruptors (ATP and PolyU RNA). Final peptide concentration was 54 μM PR25 and final additive concentrations were 10% 1,6-hexanediol, 1.25 mg/mL PolyU RNA, 12.5 mM ATP in 2.7 M KCl, 50 mM Tris-HCl (pH 7.2). Conditions at which the disruptors dissolved the condensates are highlighted in green and those where condensates remained intact are highlighted in red. Only 1,6-hexanediol dissolves PR25 condensates at high salt. Scale bars in all images are 20 μm. In both panels, the images are representative of the observed reproducible behavior from at least three test replicates of the respective protein/salt conditions.
Fig. 5
Fig. 5. Hofmeister effect in the high-salt phase separation behavior of FUS and PR25.
a Phase diagram for FUS as a function of salt concentration of various salts of the Hofmeister series. Open circles indicate cases where phase separation did not occur, closed circles indicate where phase separation did occur. Each curve depicts the apparent phase boundary for the particular salt named next to it and is only meant as a guide for the eyes. Even at the saturation concentration of CaCl2 (gray), the hydrophobic effect is weakened to the extent such that phase separation cannot occur, indicated by the presence of open circles and absence of closed ones in the phase diagram. b Phase behavior of PR25 as a function of ionic strength of various salts. The trend is consistent with panel a. c Comparison of the amount of 1,6-hexanediol required to dissolve FUS condensates in solutions of various salts along with the Hofmeister series. In each solution, the final salt concentration was 4 M, and the final FUS concentration was 2 μM. Partially shaded circles represent conditions where the number of condensates was visibly reduced, but the condensates were not fully dissolved. d Comparison of the amount of 1,6-hexanediol required to dissolve PR25 as a function of salts along the Hofmeister series. The final salt concentration at each point was 4 M and the PR25 concentration was 100 μM.
Fig. 6
Fig. 6. Effect of salt (0 M, 1.5 M, 3 M NaCl) on the potential of mean force (PMF) between selected amino acid pairs in explicit solvent and NaCl ions as a function of the center-of-mass (COM) distance.
a Cation–anion (with π–π contributions), b cation–anion (without π–π contributions), c hydrophobic–hydrophobic, d non-polar–non-polar, e polar–polar, f π–π, g hybrid cation–π/π–π (Arg–Tyr, solid lines) and cation–π (Lys–Phe, dashed lines) (+pol denotes refitted Tyr/Phe parameters were employed; as described in the text and Supplementary Information), h Cation–cation (with π–π contribution). The second well in (b) emerges from the interaction of Asp with an additional H atom in the Lys sidechain, which is displaced by ~1.7 Å from the two H atoms that contribute to the first well. To evaluate (g), a model for the polarized cation–π systems was developed (see “Methods”). The gray arrows in each panel highlight the general shift direction of the PMF minimum as salt concentration is raised. Upward arrows show the weakening of cation–anion interactions upon increasing salt. Downward arrows show strengthening of nonionic interactions and of hybrid cation–π/π–π and cation–cation interactions when both amino acids in the pair have π–orbitals. Statistical errors, mean ± s.d., are shown as bands; obtained by bootstrapping the results from n = 3 independent simulations. i Variation in the free-energy minimum (obtained from the profiles in ah, mean ± s.d.) with salt. One-letter amino acid codes are used to identify each pair interaction. Source data are provided as a Source Data file.
Fig. 7
Fig. 7. Dependence of LLPS on electrostatic versus hydrophobic forces for FUS and PR25 from direct coexistence simulations using a sequence-dependent protein coarse-grained model.
a Illustration of the coarse-grained models for the different proteins with one bead representing each amino acid. Amino acids are colored according to their chemical identity (aromatics in blue, charged residues in green, all other residues in red; color code shown at the bottom). Snapshots for simulations with b all interactions, c reduced electrostatics, and d reduced electrostatics + increased hydrophobicity for FUS (24 proteins) and PR25 (400 peptides). Snapshots were rendered using Ovito.
Fig. 8
Fig. 8. Schematic illustration of the different molecular forces that stabilize condensates in the low-salt versus the high-salt reentrant regime.
While phase separation in the low-salt regime is driven by both electrostatic and hydrophobic interactions, the condensation process in the reentrant high-salt regime is governed by hydrophobic and nonionic interactions. Note: The asterisks (*) for Arg*–Try and Arg*–Arg* indicate that at high salt, charges are screened, and interactions become predominantly hydrophobic (i.e., π–π interactions).

Similar articles

Cited by

References

    1. Hyman AA, Weber CA, Jülicher F. Liquid-liquid phase separation in biology. Annu. Rev. Cell Dev. Biol. 2014;30:39–58. doi: 10.1146/annurev-cellbio-100913-013325. - DOI - PubMed
    1. Banani SF, Lee HO, Hyman AA, Rosen MK. Biomolecular condensates: organizers of cellular biochemistry. Nat. Rev. Mol. Cell Biol. 2017;18:285–298. doi: 10.1038/nrm.2017.7. - DOI - PMC - PubMed
    1. Shin Y, Brangwynne CP. Liquid phase condensation in cell physiology and disease. Science. 2017;357:eaaf4382. doi: 10.1126/science.aaf4382. - DOI - PubMed
    1. Welsh TJ, Shen Y, Levin A, Knowles TPJ. Mechanobiology of protein droplets: force arises from disorder. Cell. 2018;175:1457–1459. doi: 10.1016/j.cell.2018.11.020. - DOI - PubMed
    1. Klosin A, et al. Phase separation provides a mechanism to reduce noise in cells. Science. 2020;367:464–468. doi: 10.1126/science.aav6691. - DOI - PubMed

Publication types