. 2021 Feb 9;12(1):898.
doi: 10.1038/s41467-021-21145-z.

p53 dynamics vary between tissues and are linked with radiation sensitivity

Affiliations

p53 dynamics vary between tissues and are linked with radiation sensitivity

Jacob Stewart-Ornstein et al. Nat Commun. .

Abstract

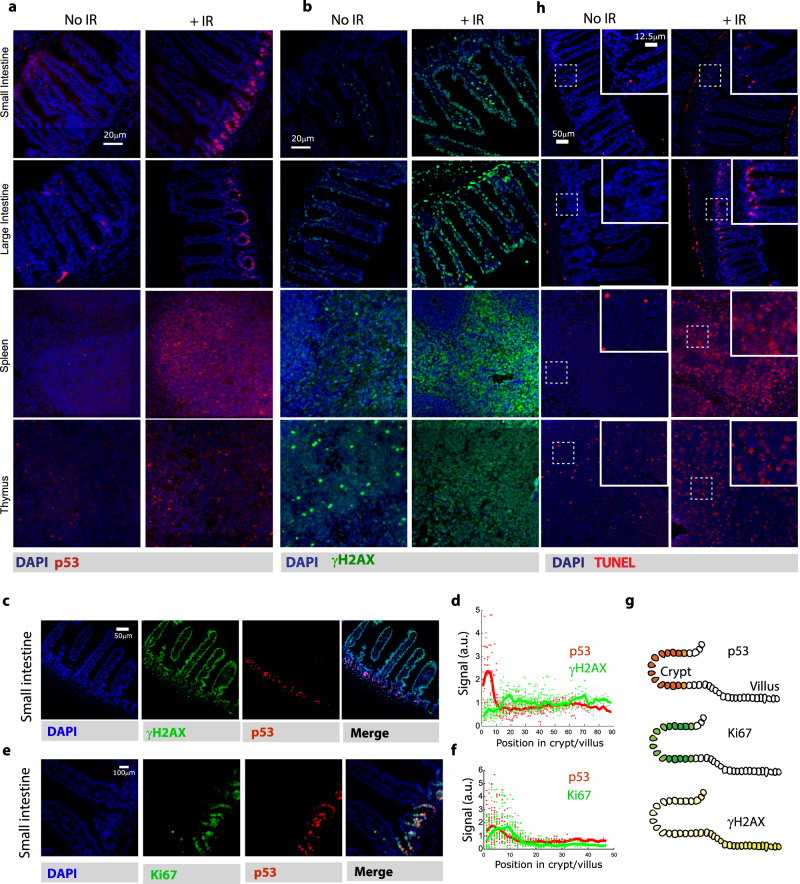
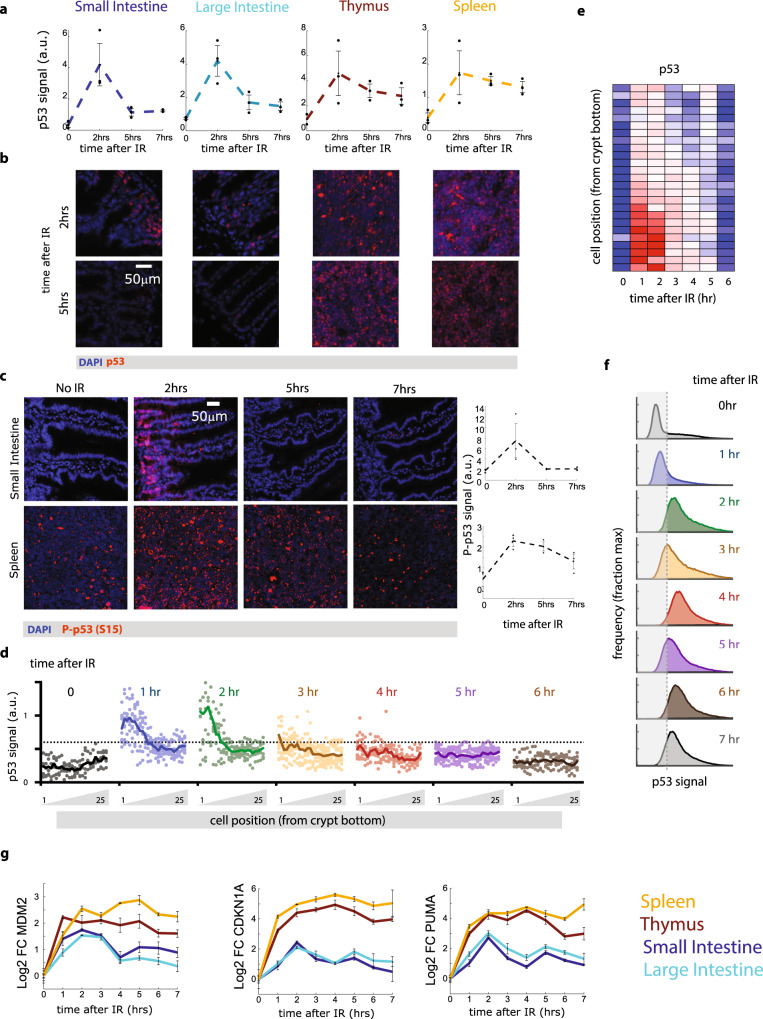
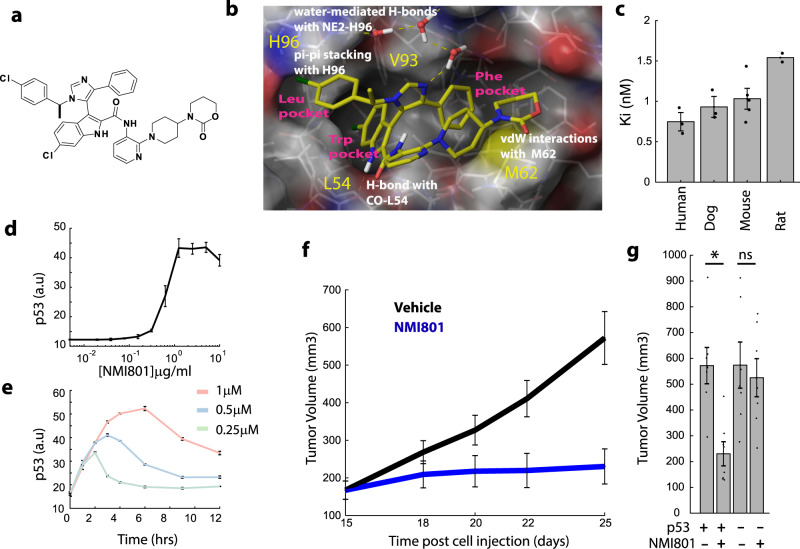
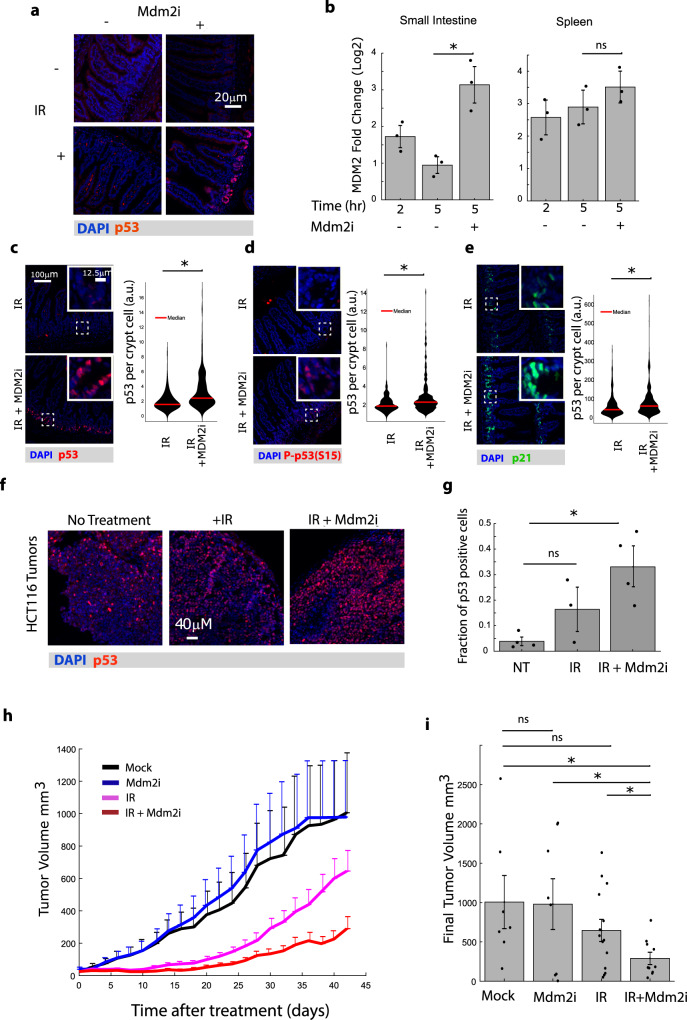
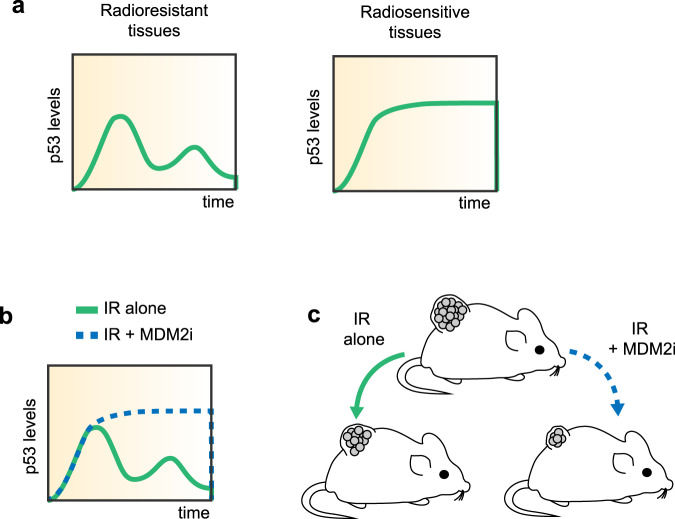
Radiation sensitivity varies greatly between tissues. The transcription factor p53 mediates the response to radiation; however, the abundance of p53 protein does not correlate well with the extent of radiosensitivity across tissues. Given recent studies showing that the temporal dynamics of p53 influence the fate of cultured cells in response to irradiation, we set out to determine the dynamic behavior of p53 and its impact on radiation sensitivity in vivo. We find that radiosensitive tissues show prolonged p53 signaling after radiation, while more resistant tissues show transient p53 activation. Sustaining p53 using a small molecule (NMI801) that inhibits Mdm2, a negative regulator of p53, reduced viability in cell culture and suppressed tumor growth. Our work proposes a mechanism for the control of radiation sensitivity and suggests tools to alter the dynamics of p53 to enhance tumor clearance. Similar approaches can be used to enhance killing of cancer cells or reduce toxicity in normal tissues following genotoxic therapies.


Conflict of interest statement

The authors declare no competing interests.

Figures

Fig. 1
Fig. 1. p53 is induced in irradiated tissues.
Mice were subjected or not to total body irradiation (IR) and after 2 h the indicated tissues were analyzed by a p53 immunofluorescence, b γ-H2AX immunofluorescence. Representative images from three (a) or two (b) independent experiments are shown. c, e Co-staining of p53 and γ-H2AX (c) or Ki67 (e) in the small intestine 2 h after irradiation. d, f Data from c and e, respectively, plotted as a function of cell position from the crypt base. Bold line shows running average; dots represent individual cells (n = 461 cells (d) and 615 cells (f)). g A diagram of crypt structure and summary of staining results in the small intestine. h TUNEL staining for indicted tissues in untreated mice or 5 h after ionizing radiation. Experiments were performed in duplicates.
Fig. 2
Fig. 2. p53 dynamics vary across tissues.
a Average p53 immunofluorescence intensity in the indicated tissues as a function of time after irradiation (IR, n = 3 samples per tissue, except for the thymus, in which n = 2 at t = 0; error bars are SEM. Dots indicate individual samples). b Representative images from three independent experiments of p53 immunofluorescence at 2 h or 5 h after irradiation. c Representative images and quantification of p53-phosphoS15 immunofluorescence in the small intestine and spleen as a function of time (n = 3 samples per tissue; Error bars are SEM. Dots indicate individual samples). d Quantification of p53 intensity across the crypt of the small intestine in mice treated with IR and analyzed at the indicated time points (n = 125,225,175,275,200,225 cells per time point). e Heat map (blue = low, red = high) of the average p53 intensity from a as a function of time and cellular position within the crypt. f Histograms of p53 immunofluorescence intensity in spleen cells at the indicated time points following irradiation (distributions calculated from >200 cells per time point). g qPCR-based quantification of the fold change (FC) in mRNA levels of p53 target genes MDM2, CDKN1A (p21), and PUMA in the indicated tissues as a function of time. Experiments were done in duplicates.
Fig. 3
Fig. 3. A novel Mdm2 inhibitor, NMI801, efficiently stabilizes p53 in mouse tissues and tumor xenograft models.
a Chemical structure of NMI801. b X-ray structure of NMI801 bound to the p53-binding pocket of Mdm2, at 2.1 Å resolution. H-bonds are indicated by dashed lines. The Mdm2 sub-pockets binding the p53 residues Leu 26, Trp 23, and Phe 19 are labeled Leu- Trp- and Phe-pocket, respectively. The coordinates have been deposited in the PDB databank (PDB access code = 6I29). c Ki of NMI801 for inhibiting p53-Mdm2 complex formation from a FRET competition assay using Cy5 labeled p53 peptide and full length Mdm2 from Human, Dog, Rat, and Mouse (n = 3 for human, dog; n = 5 for mouse; n = 2 for rat; error bars are SEM; points indicate individual measurements; mean is shown in bar plots). d Quantification of p53 levels by immunofluorescence in HEPA1C1C7 mouse cells 3 h after adding the indicated doses of NMI801 (n = 4 imaging fields; error bars are SEM). e Quantification of p53 levels by immunofluorescence in HEPA1C1C7 mouse cells at the indicated times after adding 0.25, 0.5, or 1 μM NMI801 (n = 4 imaging fields; error bars are SEM). f, g Xenograft tumors of HCT116 were engrafted for 15 days to an average size of ~150 mm3. Mice were then treated with vehicle or NMI801 daily (200 mg/kg). f Tumor volume was measured at the indicated times after NMI801 treatment. g Final tumor volume in p53 wild-type or null mice treated with vehicle or NMI801 (n = 8 mice/condition; error bars are SEM; dots indicate individual data points; *pval = 0.000356, two-sided t-test, no multiple comparison adjustment).
Fig. 4
Fig. 4. Combination of radiation and Mdm2 inhibitor (Mdm2i) sustains p53 activity in tissues and tumors resulting in reduced tumor progression.
a Staining of p53 in the small intestine 5 h following the indicated treatments. Mdm2i was added 2 h after radiation (IR). Representative images from two independent experiments are shown. b p53 transcriptional activity in small intestine and spleen as measured by Mdm2 mRNA levels at the indicated time-points following treatment with Mdm2i. (n = 3 mice; error bars are SEM; *pval = 0.0071; two-sided t-test). ce Representative images of staining for p53 (c), p53-phosphoS15 (d), and p53 target gene p21 (e) in the small intestines treated with IR alone or IR + Mdm2i as described in a. n = 3 mice, 15 crypts/mouse, *indicates significant, pval = 1.7 × 10−21 (c), 6.4 × 10−9 (d), and 5 × 10−5 (e) (two-sided t-test). f HCT116 tumors were engrafted for 21 days to an average size of 70 mm3 and then treated with radiation followed by vehicle or Mdm2i 2 h post radiation. Tumors were stained for p53 5 h after radiation treatment. Experiment was performed on 3–4 tumors/condition. g Quantification of data from f (n = 3–4 tumors per condition; dots indicate individual measurements; error bars are SEM; *pval = 0.0053; two-sided t-test). h Tumor sizes at the indicated time points in mice treated with or without radiation and then treated with or without Mdm2i 2 h post radiation (error bars are SEM). i Final tumor sizes from data in h. (* indicates significant, 0.0096, 0.0130, 0.0261; one-sided t-test). Dots represent individual tumors (n = 7–14 tumors/condition; error bars are SEM). No multiple test correction was used on the statistics in this figure.
Fig. 5
Fig. 5. Schematic of the proposed mechanism for the control of radiation sensitivity of tissues and tumors via p53 dynamics.
a Radioresistant tissues, such as the small and large intestines, show transient induction of p53 and oscillatory behavior of its activity and target genes, while the more sensitive tissues, such as the spleen and thymus show sustained levels of p53 after irradiation (IR). bc Combination of radiation (IR) with the Mdm2 inhibitor NMI1801 (Mdm2i) alters p53 dynamics (b) and suppresses tumor growth (c).

Similar articles

Cited by

References

    1. Uhlen M, et al. A pathology atlas of the human cancer transcriptome. Science. 2017;357:eaan2507. doi: 10.1126/science.aan2507. - DOI - PubMed
    1. Vousden KH, Prives C. Blinded by the light: the growing complexity of p53. Cell. 2012;137:413–431. doi: 10.1016/j.cell.2009.04.037. - DOI - PubMed
    1. Lowe SW, Schmitt EM, Smith SW, Osborne BA, Jacks T. p53 is required for radiation-induced apoptosis in mouse thymocytes. Nature. 1993;362:847–849. doi: 10.1038/362847a0. - DOI - PubMed
    1. Bernstein A, Lee JM. p53 mutations increase resistance to ionizing radiation. PNAS. 1993;90:5742–5746. doi: 10.1073/pnas.90.11.5229. - DOI - PMC - PubMed
    1. Patt H. Factors in the radiosensitivity of mammalian cells. Ann. N. Y. Acad. Sci. 1955;59:649–664. doi: 10.1111/j.1749-6632.1955.tb45976.x. - DOI - PubMed

Publication types

MeSH terms