. 2021 May;6(5):682-696.
doi: 10.1038/s41564-020-00860-1. Epub 2021 Feb 8.

Regulation of host and virus genes by neuronal miR-138 favours herpes simplex virus 1 latency

Affiliations

Regulation of host and virus genes by neuronal miR-138 favours herpes simplex virus 1 latency

Boqiang Sun et al. Nat Microbiol. 2021 May.

Abstract

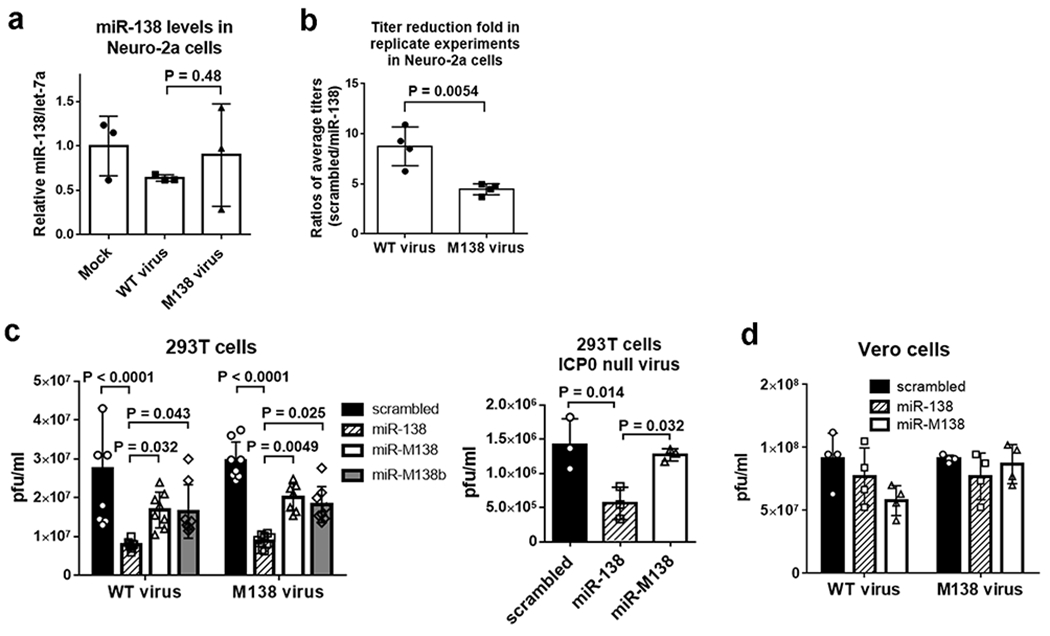
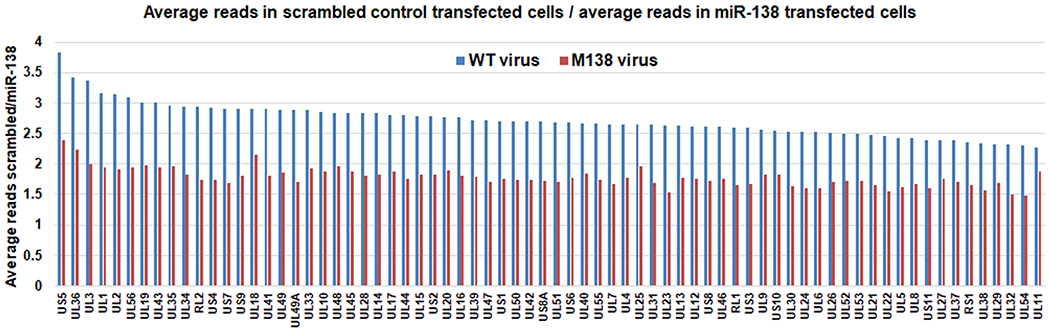
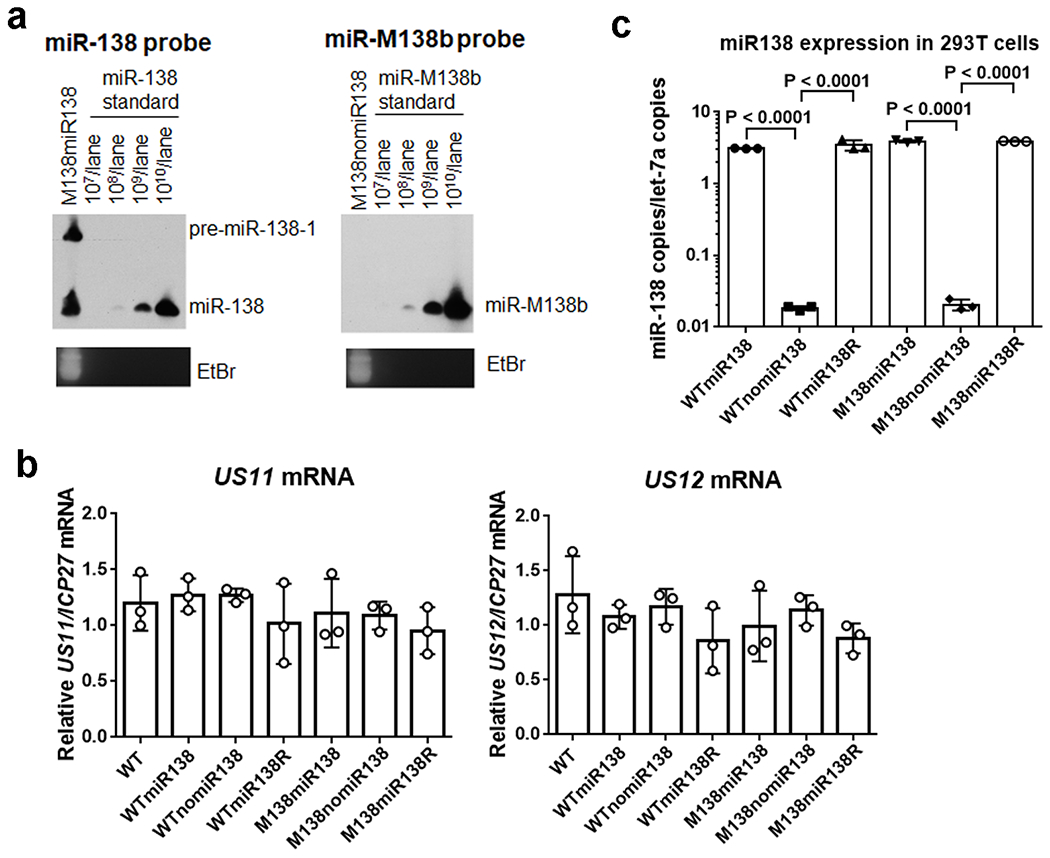
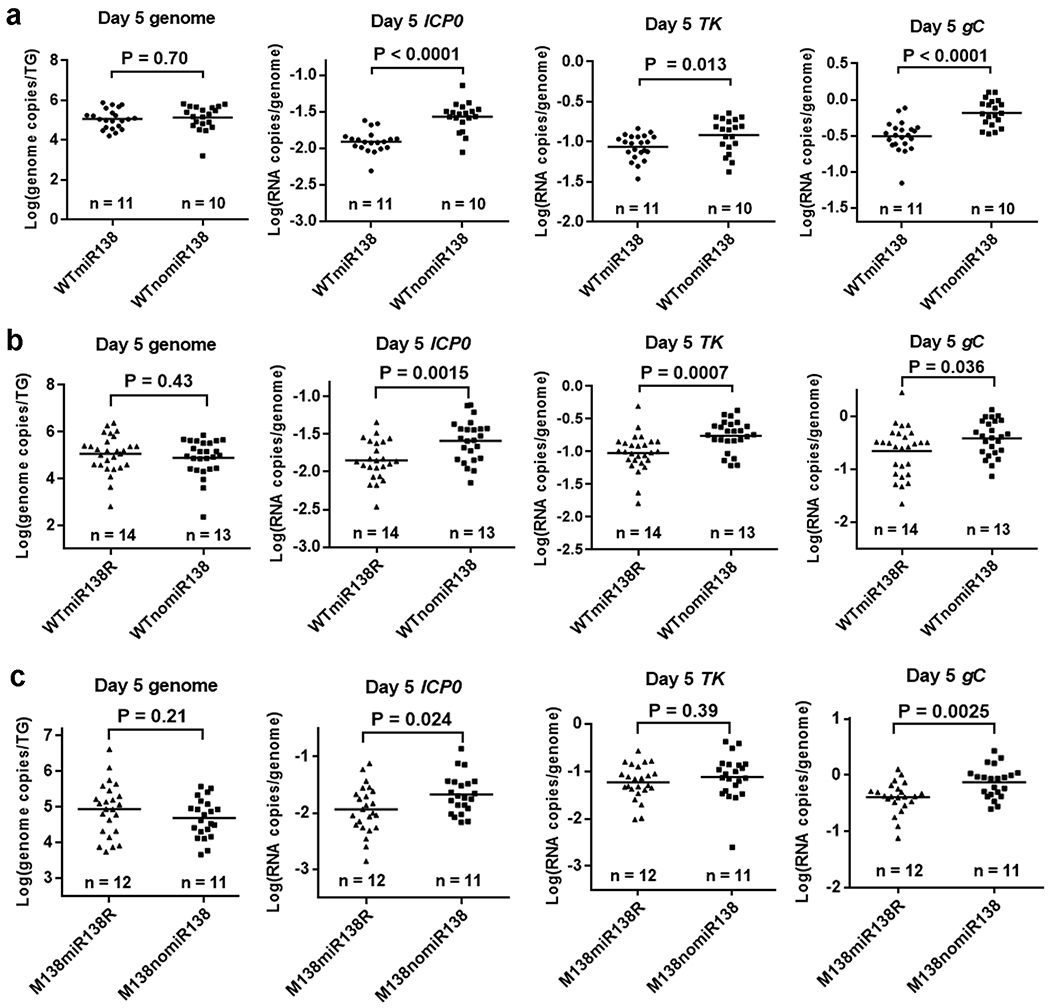
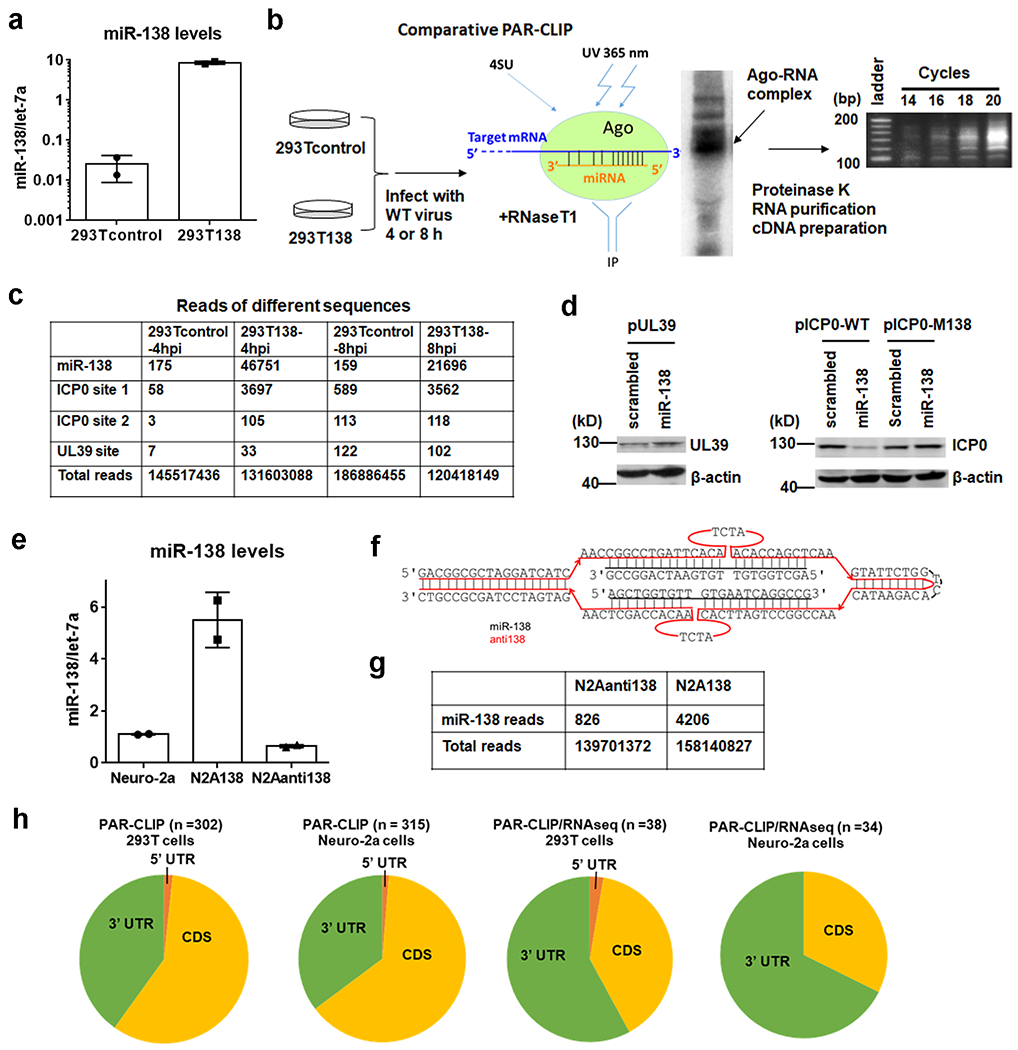
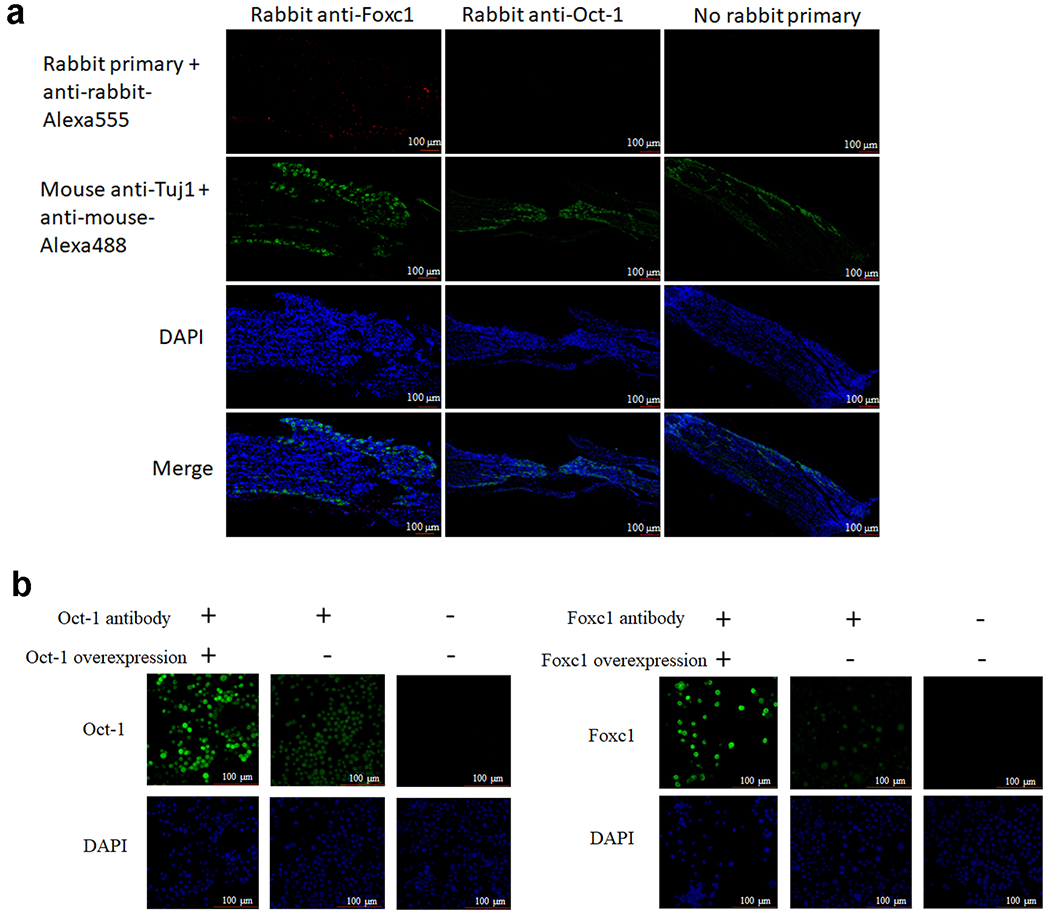
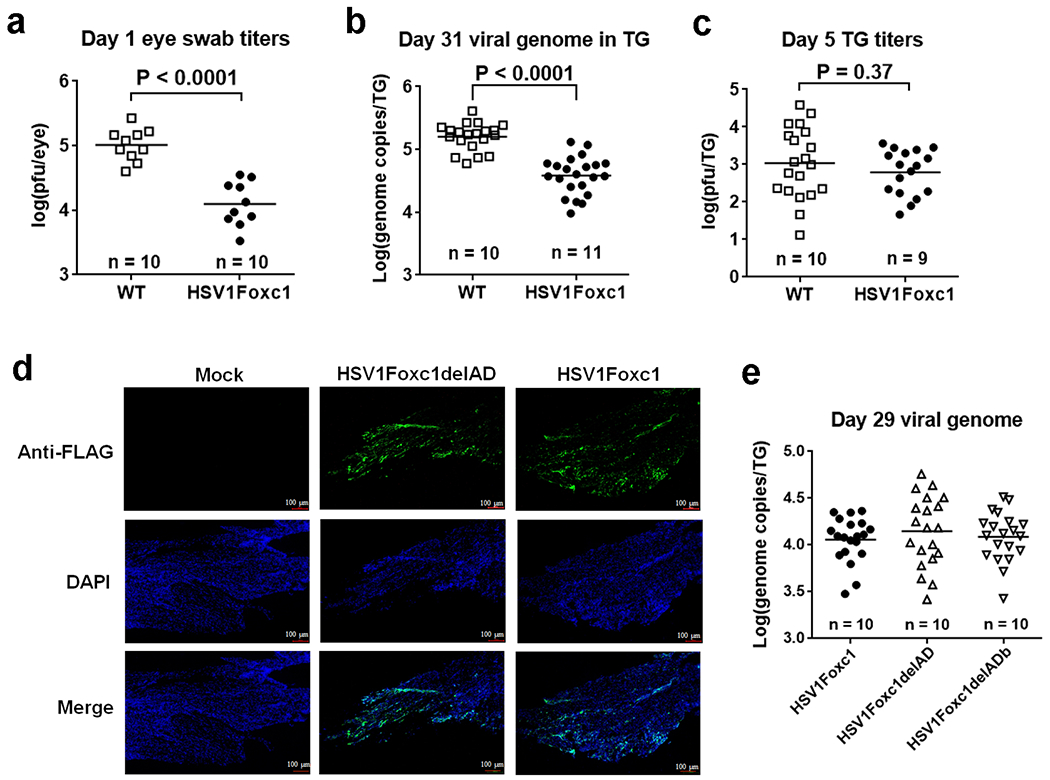
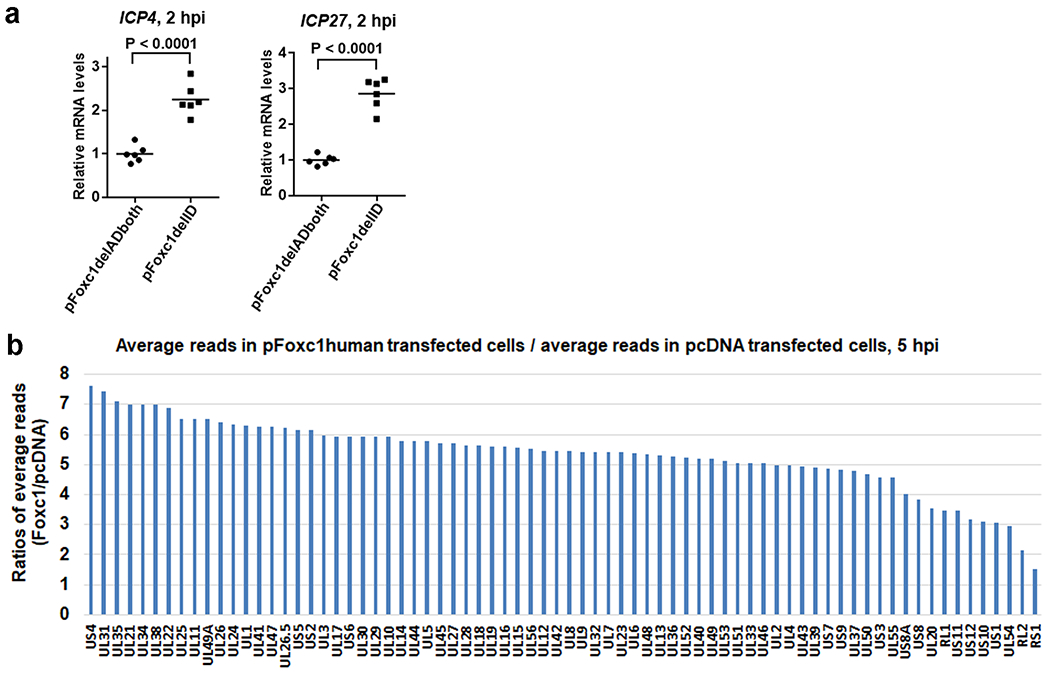
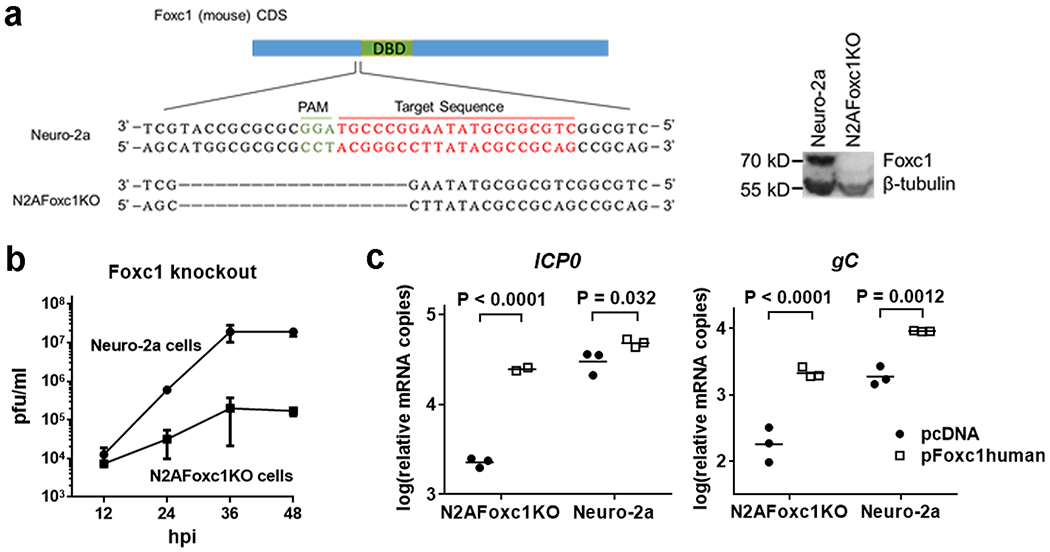
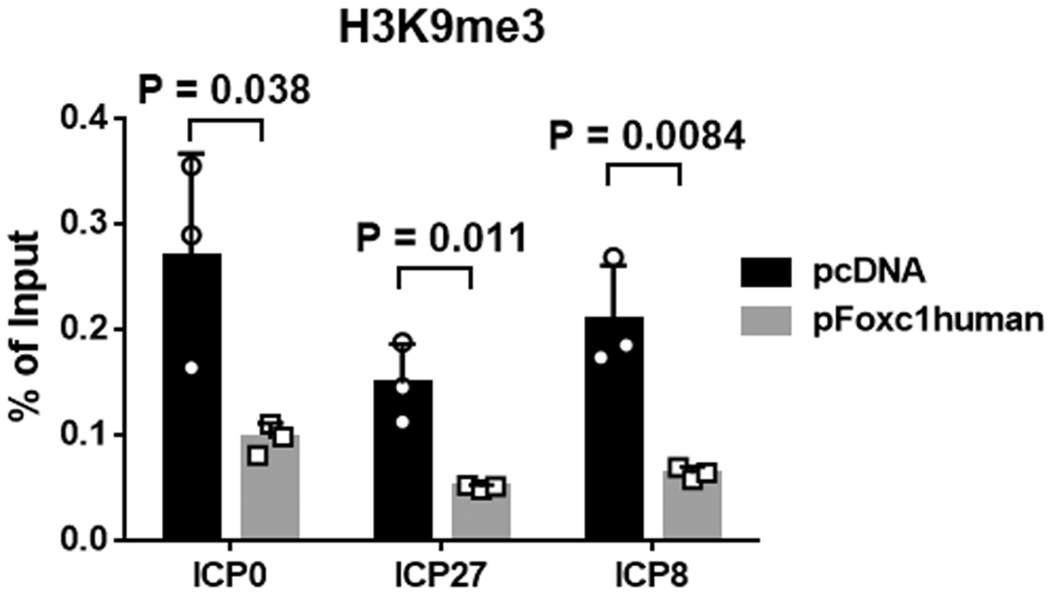
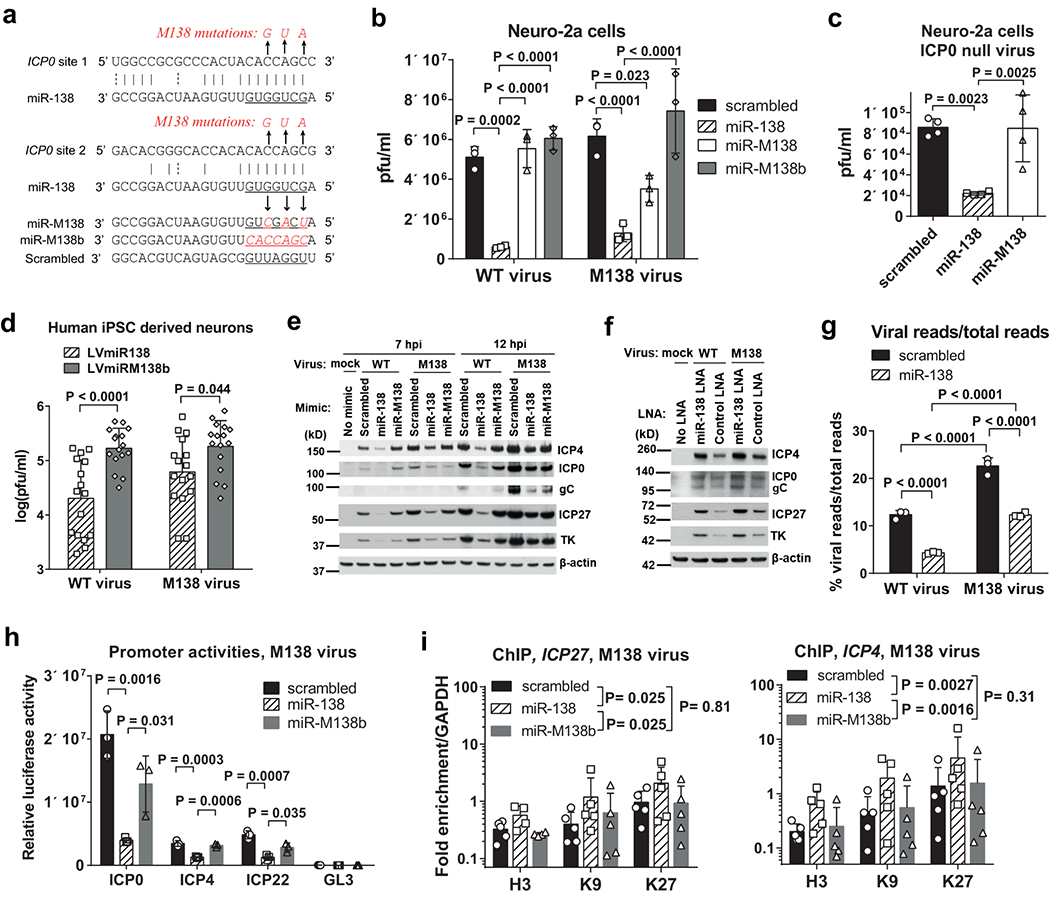
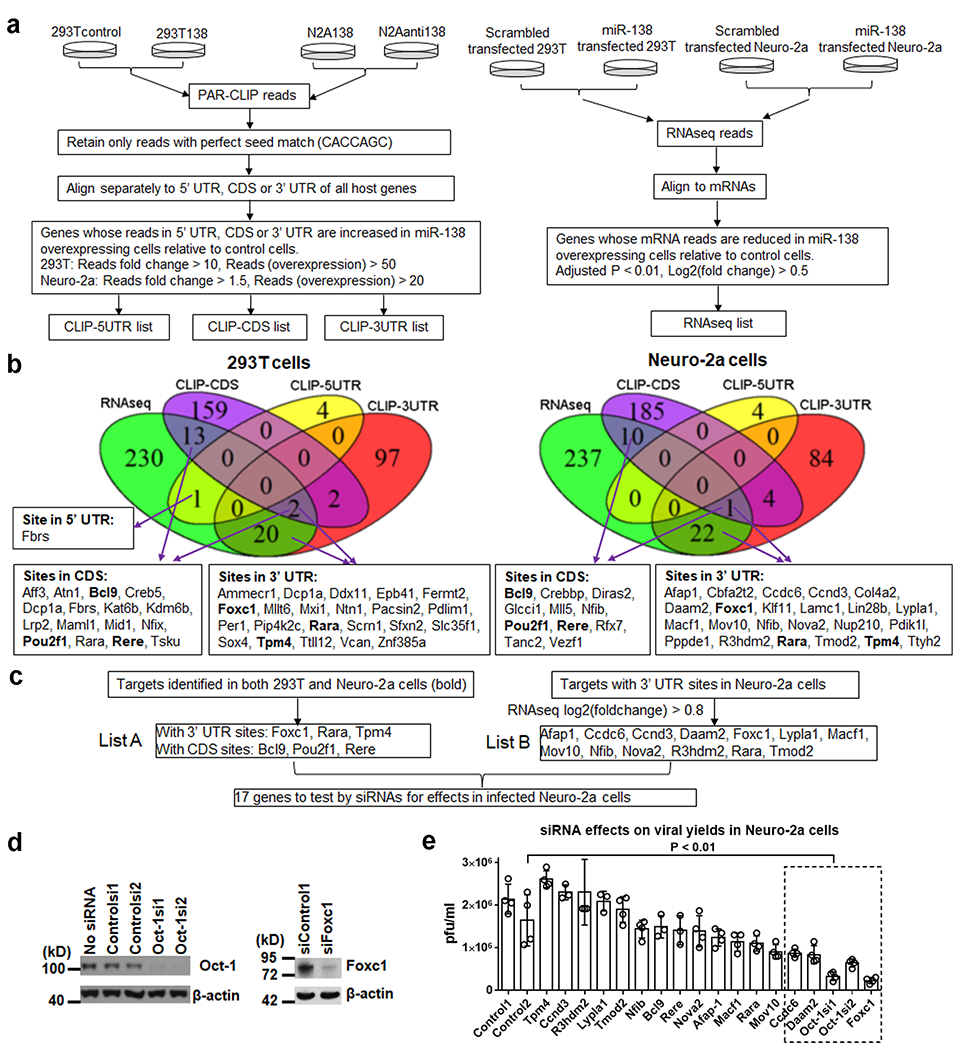
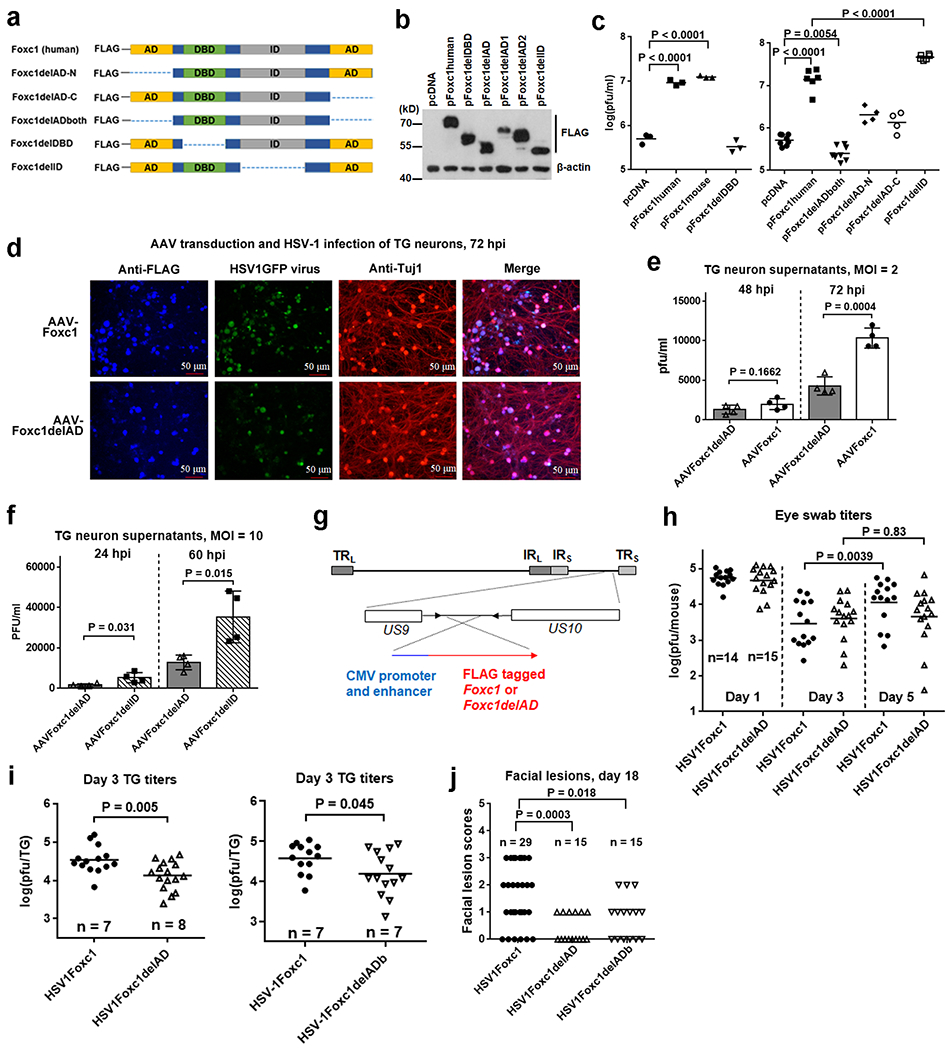
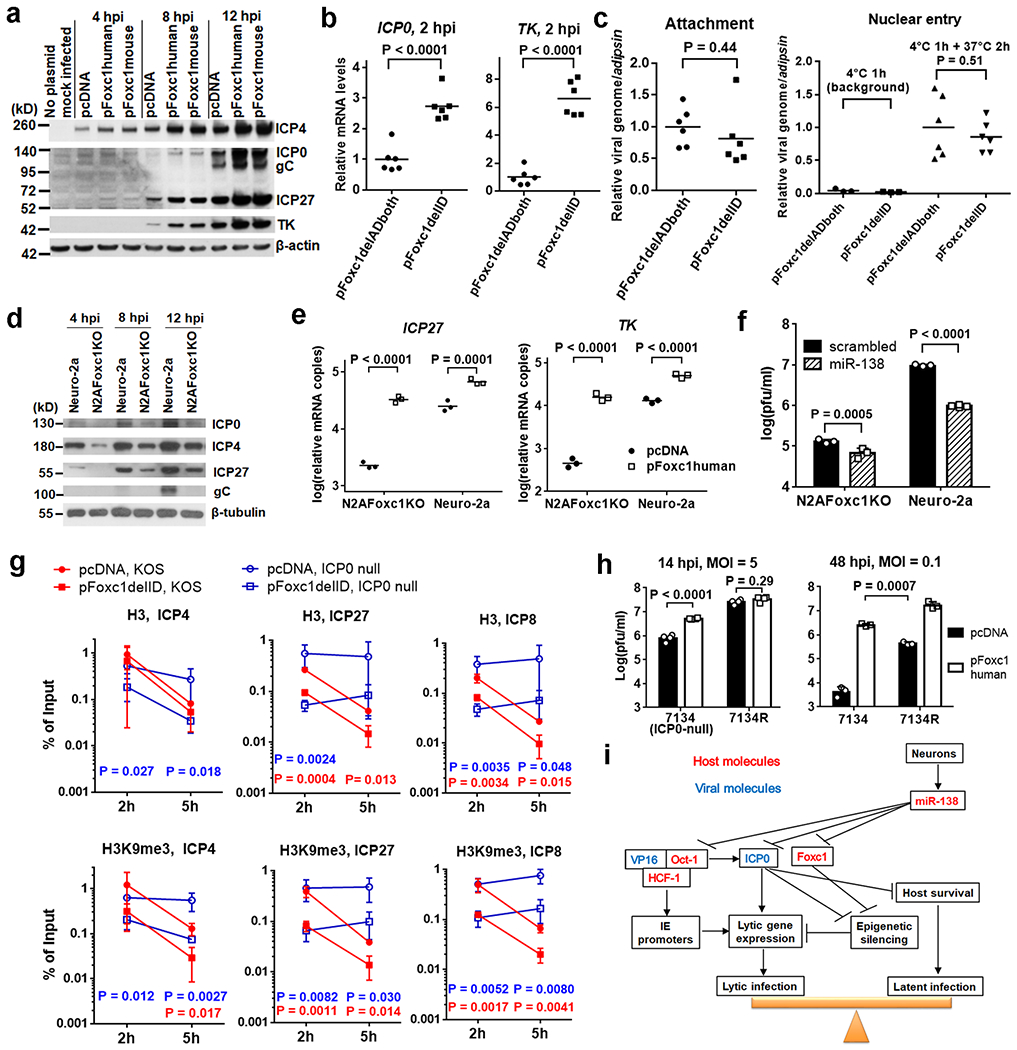
MicroRNA miR-138, which is highly expressed in neurons, represses herpes simplex virus 1 (HSV-1) lytic cycle genes by targeting viral ICP0 messenger RNA, thereby promoting viral latency in mice. We found that overexpressed miR-138 also represses lytic processes independently of ICP0 in murine and human neuronal cells; therefore, we investigated whether miR-138 has targets besides ICP0. Using genome-wide RNA sequencing/photoactivatable ribonucleoside-enhanced crosslinking and immunoprecipitation followed by short interfering RNA knockdown of candidate targets, we identified the host Oct-1 and Foxc1 messenger mRNAs as miR-138's targets, whose gene products are transcription factors important for HSV-1 replication in neuronal cells. OCT-1 has a known role in the initiation of HSV transcription. Overexpression of FOXC1, which was not known to affect HSV-1, promoted HSV-1 replication in murine neurons and ganglia. CRISPR-Cas9 knockout of FOXC1 reduced viral replication, lytic gene expression and miR-138 repression in murine neuronal cells. FOXC1 also collaborated with ICP0 to decrease heterochromatin on viral genes and compensated for the defect of an ICP0-null virus. In summary, miR-138 targets ICP0, Oct-1 and Foxc1 to repress HSV-1 lytic cycle genes and promote epigenetic gene silencing, which together enable favourable conditions for latent infection.


Conflict of interest statement

Conflict of Interest

A.H.M.N. and G.M.C. are inventors on patents filed by the Presidents and Fellows of Harvard College. Full disclosure of G.M.C. is available on http://arep.med.harvard.edu/gmc/tech.html. A.H.M.N. and G.M.C. are co-founders and have equity in GC Therapeutics, Inc. Other authors declare that they have no conflict of interest.

Figures

Extended Data Fig. 1.
Extended Data Fig. 1.. Additional data about effects of miR-138 on HSV-1 replication.
a, Neuro-2a cells were mock-infected or infected with the indicated virus (MOI = 5) for 16 h before qRT-PCR analysis of miR-138 and let-7a levels. b, In 4 independent experiments performed as in Fig. 1b, the ratios of the average titers from scrambled transfected cells over those from miR-138 transfected cells were calculated separately for WT and M138 viruses and plotted. c, 293T cells were transfected with 40 nM miRNA mimic for 16 h, and then infected with WT or M138 virus (left graph), or 7134 (ICP0-null) virus (right graph) for 48 h (MOI = 0.1) before viral titer measurements. d, Same as c, except that Vero cells were infected (MOI = 0.01) and no significant difference was detected between miR-138 and either of the two controls. For b, n = 4 independent experiments. For c, data are combined from 4 independent replicate experiments, each with 4 biologically independent samples per condition (The data from each experiment were first normalized to the value from the LVmiRM138b-WT virus group before being combined), so n = 16 biologically independent samples per condition. For other panels, n = 3 (a, c right), 4 (d) or 8 (c left) biologically independent samples per condition. For all panels, data are presented as mean values ± S.D. and were analyzed by unpaired, two tailed t tests (a, b), two-way (c left, d) or one-way (c right) ANOVA with Bonferroni’s multiple comparisons tests.
Extended Data Fig. 2.
Extended Data Fig. 2.. Global effects of miR-138 on viral gene expression.
Same experiment as Fig. 1f, but effects on individual viral transcripts are plotted. Blue and red bars represent data for WT and M138 virus, respectively. n = 3 biologically independent samples per condition. Each bar represents the read count mean value for the indicated transcript from scrambled mimic transfected cells (after being normalized to total reads of the sample) divided by that from miR-138 mimic transfected cells.
Extended Data Fig. 3.
Extended Data Fig. 3.. Expression of miR-138, US11 and US12 from recombinant viruses.
a, 293T cells were infected with M138miR138 or M138nomiR138 virus (MOI = 5). At 8 hpi, the cells were harvested for RNA purification and Northern blot hybridization. RNA from M138miR138 infected cells was run alongside a dilution series of synthetic miR-138 in the gel and hybridized with a miR-138 probe (left panel). RNA from M138nomiR138 infected cells was run alongside a dilution series of synthetic miR-M138b in the gel and hybridized with a miR-M138b probe (right panel). The integrity of RNA from both samples was verified by ethidium bromide staining, which is shown below the Northern blot images for a set of bands ~80 bases. This experiment was performed once. b, Vero cells were infected with the viruses indicated at the bottom at an MOI of 5 and harvested at 8 hpi for qRT-PCR analysis of US11 and US12 mRNA levels normalized to ICP27 mRNA levels. c, miR-138 expression from 293T cells infected by the indicated viruses (MOI = 5, 8 hpi) as measured by qRT-PCR. For b and c, n = 3 biologically independent samples and data are presented as mean values ± S.D. Untransformed (b) or log-transformed (c) data were analyzed by one-way ANOVA with Bonferroni’s multiple comparisons tests.
Extended Data Fig. 4.
Extended Data Fig. 4.. Additional in vivo data about miR-138 expressing and control recombinant viruses.
a, Viral DNA and RNA levels in TG infected with WTmiR138 and WTnomiR138 at 5 dpi. The DNA or RNA molecules measured are labeled at the top of each graph. Viruses are indicated at the bottom. Each point represents a value from one TG, and the horizontal lines represent the geometric means. The displayed n numbers represent the numbers of mice used per condition. Data were analyzed by two-tailed, unpaired t tests. b, Same as a, but WTmiR138R and WTnomiR138 are compared. c, Same as a, but M138miR138R and M138nomiR138 are compared.
Extended Data Fig. 5.
Extended Data Fig. 5.. PAR-CLIP experiments identified viral and host targets of miR-138.
a, miR-138 expression in 293Tcontrol and 293T138 cells. b, PAR-CLIP procedure for detecting viral targets of miR-138 with, from left to right, a schematic showing the samples, a cartoon showing the crosslinking procedure, a representative autoradiograph of an SDS polyacrylamide gel showing a band corresponding to the Ago-RNA complex, the subsequent steps, and an agarose gel showing PCR amplification of the cDNA library. The experiment was performed once. c, Read counts of the indicated sequences from the indicated samples. d, 293T cells were co-transfected with 20 nM miRNA mimic and 100 ng/ml plasmid for 48 h before Western blot analysis of FLAG-tagged UL39 using an anti-FLAG antibody and analysis of ICP0 using an ICP0 antibody. This experiment was repeated once with similar results. e, miR-138 levelsin Neuro-2a, N2A138 and N2Aanti138 cells. f, Diagram showing the “anti138” sequence expressed in N2Aanti138 cells. The sequence has a “tough decoy” secondary structure. Red and black horizontal lines represent anti138 and miR-138, respectively. Curved lines above and below the main structure represent bulges (extra nucleotides not bound to miR-138) designed to prevent cleavage. g, miR-138 and total read counts in the N2A138 and N2Aanti138 cells in a PAR-CLIP experiment. h, Fraction of 5’ UTR, CDS or 3’ UTR sites in total sites identified by the single PAR-CLIP approach (panels 1 and 2) or the combined PAR-CLIP/RNAseq approach (panels 3 and 4) in 293T (panels 1 and 3) and Neuro-2a cells (panels 2 and 4). Relative to the single PAR-CLIP approach, the combined approach identified significantly higher fractions of targets with 3’ UTR sites (P = 0.034 and 0.0006 for 293T and Neuro-2a cells, respectively by Fisher’s exact tests). For a and e, n = 3 biologically independent samples and data are presented as mean values ± S.D.
Extended Data Fig. 6.
Extended Data Fig. 6.. Low expression of Oct-1 and Foxc1 in mouse TG.
a, Fixed TG cryo-sections were stained using an anti-Foxc1 or anti-Oct-1 rabbit primary antibody (red) or without a rabbit primary antibody (control), stained with a mouse anti-Tuj1 antibody (green), and stained with DAPI (blue). Similar results were obtained for Oct-1 using a different Oct-1 antibody (data not shown). This experiment was repeated twice with similar results. b, Neuro-2a cells were mock-transfected or transfected with 200 ng/ml Oct-1 or Foxc1 expressing plasmid for 48 h. The cells were then fixed and stained with an anti-Oct-1 or anti-Foxc1 antibody (green) or without a primary antibody, and stained with DAPI (blue). This experiment was repeated once with similar results.
Extended Data Fig. 7.
Extended Data Fig. 7.. Additional results with HSV1Foxc1 and HSV1Foxc1delAD viruses.
a, Mice were infected on the cornea with 2 x 10⁵ pfu/eye of the indicated viruses. Viral titers in eye swabs collected at 1 dpi were determined. b, Following infection as in a, TG were harvested at 31 dpi and analyzed for viral genome levels normalized to mouse adipsin gene levels by qPCR. c, Following infection as in a, TG were harvested at 5 dpi and viral titers in TG were determined. d, Following mock infection (left) or infection of mice at the cornea with 2 x 10⁵ pfu/eye of HSV1Foxc1delAD (middle) or HSV1Foxc1 (right), fixed TG cryo-sections were stained by DAPI (blue) and an anti-FLAG antibody (green) that can detect FLAG-tagged Foxc1 and Foxc1delAD proteins. This experiment was performed once. e, After corneal inoculation with 2 x 10⁵ pfu/eye of the indicated viruses, mouse TG were harvested at 29 dpi and analyzed for viral genome levels normalized to mouse adipsin gene levels by qPCR. No significant difference was detected in e. For all panels, the n numbers represent the numbers of mice used per condition. The horizontal lines represent geometrical means. Data were analyzed by two-tailed, unpaired t tests (a, b, c) or one-way ANOVA with Bonferroni’s multiple comparisons tests (e) with the P values indicated.
Extended Data Fig. 8.
Extended Data Fig. 8.. Global effects of Foxc1 on viral gene expression.
a, Additional data for Fig. 6b. Neuro-2a cells were transfected with 200 ng/ml plasmid for 40 h. KOS was then added (MOI = 2). The cells were incubated at 4°C for 1 h to allow attachment, washed by PBS and incubated at 37°C for 2 h before qRT-PCR analysis for the transcript indicated at the top normalized to host GAPDH levels. n = 6 biologically independent samples. The horizontal lines represent mean values. Data were analyzed by two-tailed, unpaired t tests. b, Neuro-2a cells were transfected with 200 ng/ml pcDNA or pFoxc1human for 40 h and infected with KOS for 5 h at an MOI of 1 before RNAseq analysis. n = 3 biologically independent samples. Each bar represents the mean read count for the indicated transcript from pFoxc1human transfected cells (after being normalized by total reads from that sample) divided by that from pcDNA transfected cells.
Extended Data Fig. 9.
Extended Data Fig. 9.. Foxc1 is important for HSV-1 replication and gene expression.
a, Left, Foxc1 CDS is depicted as a blue box with the DBD in green. Expanded below is the region of deletion in N2AFoxc1KO cells, showing sequences in WT and KO cell lines. The PAM sequence required for guide RNA target recognition is shown in green and the target sequence in red. Right, expression of Foxc1 relative to β-tubulin (loading control) in Neuro-2a and N2AFoxc1KO cells was analyzed by Western blots. This experiment was repeated twice with similar results. b, Neuro-2a and N2AFoxc1KO cells were infected with KOS (MOI = 0.5) for the indicated times. Mean viral titers ± S.D. are shown. c, Additional data for Fig. 6e. N2AFoxc1KO or Neuro-2a cells were transfected with 400 ng/ml pcDNA or pFoxc1human. 40 h later, the cells were infected with KOS for 5 h at an MOI of 1 before qRT-PCR analyses of the transcript indicated at the top. Horizontal lines represent geometrical means. Data were analyzed by two-way ANOVA with Bonferroni’s multiple comparisons tests. For b and c, n = 3 biological independent samples per condition.
Extended Data Fig. 10.
Extended Data Fig. 10.. Foxc1 reduced heterochromatin associated with viral genes.
Neuro-2a cells were transfected with 500 ng/ml pcDNA or pFoxc1human, as indicated, for 40 h and infected with KOS for 2 h (MOI = 2) before ChIP-qPCR analysis for association of H3K9me3 with the genes indicated at the bottom. n = 3 biologically independent samples. Mean values ± S.D. are shown. Data were analyzed by two-way ANOVA with Bonferroni’s multiple comparisons tests.
Fig. 1.
Fig. 1.. ICP0 independent suppression of viral replication by miR-138 in Neuro-2a cells.
a, Sequences of miR-138, its target sites in the ICP0 3’ UTR, the M138 mutations, and synthetic miRNA mimics. Underlined are seed regions. Arrows point to nucleotide substitutions. b, Neuro-2a cells were transfected with 10 nM miRNA mimic for 16 h, then infected at a multiplicity of infection (MOI) of 1 for 48 h before viral titer measurements. c, Same as b, except that 40 nM miRNA mimic was transfected and cells were infected with 7134 virus (MOI = 5). d, Human neurons differentiated from iPSCs were transduced with a lentivirus expressing miR-138 (LVmiR138) or one with the miR-138 seed region mutated to that of miR-M138b (LVmiRM138b), then infected with WT or M138 virus (MOI of 1) for 48 h before viral titer measurements. Data were combined from 4 independent replicate experiments, each with 4 biologically independent samples per condition (The data from each experiment were first normalized to the value from the LVmiRM138b-WT virus group before being combined), so n = 16 biologically independent samples per condition. e, Neuro-2a cells were transfected with 40 nM miRNA mimic for 16 h, then infected (MOI = 5) for 7 or 12 h before Western blot analysis. This experiment was repeated once with similar results. f, Neuro-2a cells were transfected with 40 nM LNA for 8 h, then infected (MOI = 3) for 16 h before Western blot analysis. This experiment was repeated three times with similar results. g, Neuro-2a cells were transfected with 40 nM miRNA mimic for 24 h, then infected (MOI = 10) for 16 h before RNAseq analysis. h, Neuro-2a cells were co-transfected with 100 ng/ml luciferase plasmid and 16 nM miRNA mimic for 24 h, then infected (MOI = 1) with M138 virus for 6 h before measurements of luciferase activity. i, Neuro-2a cells were transfected with 60 nM miRNA mimic for 24 h, then infected with M138 virus (MOI = 5) for 6 h before ChIP-qPCR analysis of total histone H3 (H3), H3K9me3 (K9) and H3K27me3 (K27) at ICP27 and ICP4 promoters. Log transformations of means from each of 2 experiments (a total of 5 biologically independent samples) were analyzed by two-way repeated measures ANOVA with Holm-Sidak’s multiple comparisons tests for main effects of the miRNA treatment factor. For other panels, n = 3 (b, g, h) or 4 (c) biologically independent samples per condition and data were analyzed by one-way (c, h) or two-way (b, g) ANOVA with Bonferroni’s multiple comparisons tests. Data are presented as mean values ± standard deviations (S.D.).
Fig. 2.
Fig. 2.. miR-138 reduces viral gene expression in acutely infected mouse TG.
a, Genomic location of inserted miR-138 expressing sequences. The HSV-1 genome is depicted as a horizontal line at the top with long (TRL and IRL) and short (IRS and TRS) repeat sequences shown as gray boxes. Below, the insertion location is expanded, with bars representing CDS and arrows representing mRNAs. The inserted sequences are further expanded to show miR-138 and miR-M138b sequences (seed regions underlined) that correspond to the recombinant viruses shown to the left. The order of virus derivation is indicated by arrows connecting the virus names. b, miR-138 expression (relative to let-7a expression) from Neuro-2a cells infected by the indicated recombinant viruses (8 hpi, MOI = 10) as measured by qRT-PCR. n = 3 biologically independent samples per condition. Data are presented as mean values ± S.D. c, Viral titers in eye swabs at 1 dpi following corneal inoculation of mice with 2 x 10⁵ pfu/eye of the indicated viruses. d, Viral transcript levels (as measured by qRT-PCR) normalized to viral genome levels (as determined by qPCR) in TG at 5 dpi with the indicated viruses. For c and d, each point represents a value from one mouse (c) or TG (d), the horizontal lines represent the geometric means, and the numbers of mice used (n) are displayed above the horizontal axies. For b, c and d, data were analyzed by one-way ANOVA with Bonferroni’s multiple comparisons.
Fig. 3
Fig. 3. Host targets of miR-138 identified using PAR-CLIP/RNAseq/siRNA screening.
a, Outline of the procedures used to perform and analyze PAR-CLIP and RNAseq. b, Top, Venn diagrams generated using the lists obtained in a. The 4 boxes just below the Venn diagrams show the lists of genes found in both the RNAseq list and the CLIP-CDS, CLIP-5UTR or CLIP-3UTR list. Purple arrows point from the locations of the genes in the Venn diagram to those in the boxes. Genes found in both 293T and Neuro-2a cells are shown in bold letters. c, Criteria for further selection of genes for siRNA experiments. d, Neuro-2a cells were transfected with 80 nM of the indicated siRNA and harvested at 48 hpi for Western blot analysis of Oct-1 (left), Foxc1 (right), and β-actin (both). These experiments were repeated once with similar results. e, Neuro-2a cells were transfected with 80 nM of the siRNAs against the indicated genes for 48 h, then infected with WT virus (MOI = 0.1) for 48 h before viral titer measurements. n = 3 or 4 biologically independent samples per condition. Data are presented as mean values ± S.D. The box with dashed lines indicate siRNAs that reduced viral titers significantly relative to Control2 siRNA (P < 0.01, one-way ANOVA with Bonferroni’s multiple comparisons tests).
Fig. 4.
Fig. 4.. Repression of Oct-1 and Foxc1 expression by miR-138.
a, miR-138 binding sites in Oct-1 CDS. The horizontal line represents Oct-1 mRNA. The thick green arrow represents Oct-1 CDS. The two small orange boxes represent miR-138 binding sites, whose sequences and how they pair with miR-138 (seed region underlined) are shown. b, 40 nM miRNA mimic and 100 ng/ml Oct-1 expressing plasmid were co-transfected into 293T cells for 30 h before Western blot analysis. This experiments was repeated twice with similar results. c, Same as b, but using plasmids expressing WT human Oct-1 or its variants with mutations at site1 (M1), site2 (M2) or both sites (M12). This experiment was repeated once with similar results. d, Foxc1 mRNA and luciferase constructs are illustrated with the pink horizontal bar representing Foxc1 mRNA and the embedded green arrow representing Foxc1 CDS. The two small orange boxes represent miR-138 binding sites, whose sequences and how they pair with miR-138 (seed region underlined) are shown. Blue X’s indicate mutated sites. e, Left and middle, 293T cells were co-transfected with 40 nM miRNA mimic and 100 ng/ml plasmid and harvested at 48 h for assay of luciferase activity. Right, 293T cells were co-transfected with 20 nM of miR-138 mimic, 20 nM of miR-138 or control LNA and 40 ng/ml luciferase plasmid with human or mouse Foxc1 3’ UTR before being harvested at 48 h for assay of luciferase activity. RLU, relative luciferase unit. Data were analyzed by two-tailed, unpaired t tests. f, 293T or Neuro-2a cells were transfected with 80 nM miRNA mimic or 20 nM LNA and harvested for Western blot analysis at 72 h after transfection. Dilutions of lysates of non-transfected cells are indicated as none, none/3, etc. This experiment was repeated once with similar results. g, Oct-1 and Foxc1 mRNA levels in Neuro-2a cells and neurons purified from mouse TG were analyzed by qRT-PCR. For e and g, n = 3 biologically independent samples per condition and data are presented as mean values ± S.D.
Fig. 5.
Fig. 5.. Foxc1 promotes HSV-1 replication in neuronal cells and mouse TG.
a, Schematics of full-length human Foxc1 and its deletion mutants. The positions of the activation domains (ADs), DNA-binding domain (DBD) and inhibitory domain (ID) are shown. b, Neuro-2a cells were transfected with 200 ng/ml plasmid for 24 h before Western blot analysis. This experiment was repeated once with similar results. c, Neuro-2a cells were transfected with 200 ng/ml plasmid for 24 h, then infected with KOS (MOI = 0.1) for 48 h before viral titer measurements. d, Neurons were isolated from mouse TG, cultured and transduced with the indicated AAV for 5 days before infection with HSV1GFP (MOI = 2). At 72 hpi, they were fixed and stained with anti-FLAG antibody to detect FLAG-tagged Foxc1 and Foxc1delAD proteins (blue) and with anti-Tuj1 (red) antibodies. This experiment was repeated twice with similar results. e, In the experiment described in d, supernatants were collected for viral titer measurements. f, Same as e except that an MOI of 10, different AAVs and time points were used, as indicated. g, Schematic of recombinant viruses showing the location of insertion. h, After corneal inoculation of mice with 4 x 10⁴ pfu/eye, eye swab viral titers were measured. i, Following inoculation as in h, mouse TG collected at 3 dpi were analyzed for viral titers. j, Eighteen days after inoculation with 2 x 10⁵ pfu/eye, the severity of mouse facial lesions was scored: 0, no lesion; 1, slight lesions in small areas; 2, nearly half of the face covered by lesions; 3, most of the face covered by lesions. Data were analyzed by two-tailed, paired (h) or unpaired (i) t tests, or one-way (c, j) or two-way (e, f) ANOVA with Bonferroni’s multiple comparisons tests. For c, e and f, each point represents a biologically independent sample (n = 3 to 8). For h, i and j, each point represents one mouse (h, j) or TG (i). The numbers of mice used are indicated as n numbers. For e and f, data are presented as mean values ± S.D. For c, h and I, horizontal lines represent geometric means.
Fig. 6.
Fig. 6.. Foxc1 effects on HSV-1 gene expression and heterochromatin in Neuro-2a cells.
a, Neuro-2a cells were transfected with 200 ng/ml plasmid for 24 h, then infected with KOS (MOI = 5) before Western blot analysis. b, Neuro-2a cells were transfected with 200 ng/ml plasmid for 40 h, then incubated with KOS (MOI = 2) at 4°C for 1 h to allow attachment, followed by incubation at 37°C for 2 h before qRT-PCR analysis of RNA levels. c, For analysis of attachment (left), after transfection and attachment as in b, cells were washed before qPCR analysis of viral genome. For analysis of nuclear entry (right), following incubation at 37°C for 2 h (or immediately following attachment to determine the background), nuclear fractions were isolated and analyzed by qPCR for viral genome. d, Neuro-2a or N2AFoxc1KO cells were infected with KOS (MOI = 5) before Western blot analysis. e, N2AFoxc1KO or Neuro-2a cells were transfected with 400 ng/ml plasmid, then infected with KOS for 5 h (MOI = 1) before qRT-PCR analyses. f, Neuro-2a or N2AFoxc1KO cells were transfected with 20 nM miRNA mimic, and infected with KOS (MOI = 0.5) for 48 h before titer measurements. g, Neuro-2a cells were transfected with 500 ng/ml of plasmid for 40 h and infected with KOS or 7134 virus (MOI = 2) before ChIP-qPCR analysis for histone H3 and H3K9me3 at the indicated promoters. Log transformed data were analyzed by multiple t tests with correction for multiple comparisons using the Holm-Sidek method. When differences between pcDNA and pFoxc1delID are significant, P values are displayed under the points being compared (red for KOS and blue for 7134). h, Neuro-2a cells were transfected with 200 ng/ml plasmid, then infected for 14 h (MOI = 5, left) or 48 h (MOI = 0.1, right) before viral titer analyses. For all panels, x = 6 (b, c) or 3 (e, f, g, h) biologically independent samples. Horizontal lines or centers of error bars represent mean values. Error bars represent S.D. Data were analyzed by two-tailed, unpaired t tests (b, c) or two-way ANOVA with Bonferroni’s multiple comparisons tests (e, f, h). i, Model of regulation of the lytic-latent switch by the neuron-specific miR-138.

Similar articles

Cited by

References

    1. Bartel DP Metazoan microRNAs. Cell 173, 20–51 (2018). - PMC - PubMed
    1. Ebert MS & Sharp PA Roles for microRNAs in conferring robustness to biological processes. Cell 149, 515–524 (2012). - PMC - PubMed
    1. Guo YE & Steitz JA Virus meets host microRNA: the destroyer, the booster, the hijacker. Mol Cell Biol 34, 3780–3787 (2014). - PMC - PubMed
    1. Bruscella P et al. Viruses and miRNAs: More Friends than Foes. Front Microbiol 8, 824 (2017). - PMC - PubMed
    1. Girardi E, Lopez P & Pfeffer S On the Importance of Host MicroRNAs During Viral Infection. Front Genet 9, 439 (2018). - PMC - PubMed

Publication types

MeSH terms