. 2021 Apr;20(4):726-738.
doi: 10.1158/1535-7163.MCT-20-0505. Epub 2021 Feb 3.

Lipidome-based Targeting of STAT3-driven Breast Cancer Cells Using Poly-l-glutamic Acid-coated Layer-by-Layer Nanoparticles

Affiliations

Lipidome-based Targeting of STAT3-driven Breast Cancer Cells Using Poly-l-glutamic Acid-coated Layer-by-Layer Nanoparticles

Isidora Tošić et al. Mol Cancer Ther. 2021 Apr.

Abstract

The oncogenic transcription factor STAT3 is aberrantly activated in 70% of breast cancers, including nearly all triple-negative breast cancers (TNBCs). Because STAT3 is difficult to target directly, we considered whether metabolic changes driven by activated STAT3 could provide a therapeutic opportunity. We found that STAT3 prominently modulated several lipid classes, with most profound effects on N-acyl taurine and arachidonic acid, both of which are involved in plasma membrane remodeling. To exploit these metabolic changes therapeutically, we screened a library of layer-by-layer (LbL) nanoparticles (NPs) differing in the surface layer that modulates interactivity with the cell membrane. We found that poly-l-glutamic acid (PLE)-coated NPs bind to STAT3-transformed breast cancer cells with 50% greater efficiency than to nontransformed cells, and the heightened PLE-NP binding to TNBC cells was attenuated by STAT3 inhibition. This effect was also observed in densely packed three-dimensional breast cancer organoids. As STAT3-transformed cells show greater resistance to cytotoxic agents, we evaluated whether enhanced targeted delivery via PLE-NPs would provide a therapeutic advantage. We found that cisplatin-loaded PLE-NPs induced apoptosis of STAT3-driven cells at lower doses compared with both unencapsulated cisplatin and cisplatin-loaded nontargeted NPs. In addition, because radiation is commonly used in breast cancer treatment, and may alter cellular lipid distribution, we analyzed its effect on PLE-NP-cell binding. Irradiation of cells enhanced the STAT3-targeting properties of PLE-NPs in a dose-dependent manner, suggesting potential synergies between these therapeutic modalities. These findings suggest that cellular lipid changes driven by activated STAT3 may be exploited therapeutically using unique LbL NPs.


Conflict of interest statement

Conflicts of interest: The authors declare no potential conflicts of interest.

Figures

Figure 1.
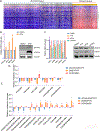
Figure 1.. STAT3 is activated in breast cancers and modulates lipid profiles in breast cancer cells.
A. mRNA expression of STAT3 target genes is presented using microarray data of normal tissue (GSE3526, n=353) and breast cancer tissue (GSE5460, n=129). The heatmap was generated using GSEA software. B. MCF-10A cells were incubated with DOX (or DMSO control) for 24 hours to induce STAT3C and (C) MDA-MB-468 cells were incubated with 10 µM PYR for 24 hours (or DMSO control) or transfected with siRNA to STAT3#3 (or non-targeting siRNA control) to inhibit STAT3 activity. Then the mRNA expression of endogenous STAT3 target genes was analyzed by qRT-PCR (left, n=4), and STAT3 protein expression and phosphorylation were detected by immunoblot analysis (right). D, E. STAT3 was inhibited in MDA-MB-468 cells using siSTAT3 (or non-targeting siRNA control) or PYR (or DMSO control), and STAT3C was induced in MCF-10A cells using DOX (or DMSO control) (n=5). Then a total of 220 lipid metabolites were analyzed by LC-MS/MS. Changes in negatively (D) and positively (E) charged metabolites are shown as the fold change between active and inactive STAT3. *, p value < 0.05. 1. Nervous system (185); 2. Pituitary gland (8); 3. Spinal cord (8); 4. Bone marrow (5); 5. Lymph nodes (4); 6. Oral mucosa (4); 7. Tongue (8); 8. Salivary gland (4); 9. Esophagus (4); 10. Gastric (11); 11. Colon (3); 12. Liver (4); 13. Spleen (4); 14. Adipose tissue (10); 15. Thyroid gland (4); 16. Pharynx (4); 17. Tonsils (3); 18. Trachea (3); 19. Bronchus (3); 20. Lung (3); 21. Heart (7); 22. Coronary artery (3); 23. Saphenous vein (3); 24. Adrenal gland (4); 25. Kidney (8); 26. Urethra (3); 27. Cervix (4); 28. Endometrium (4); 29. Myometrium (5); 30. Ovary (4); 31. Vagina (4); 32. Vulva (4); 33. Breast (3); 34. Nipple (4); 35. Prostate (3); 36. Testes (3); 37. Skeletal muscle (5). C16:0 – palmitic acid; C18:0 – stearic acid; C18:1 – oleic acid; C20:4 – arachidonic acid; NAT – N-acyl taurine; PIe – phosphatidylinositol; TAG – triacylglycerol; LPCe - lysophosphatidylcholine ether; SM – sphingomyelin; PSe – phosphatidylserine; MAGe - monoacylglycerol ether. “e” at the end of a fatty acid symbol indicates an ether linkage.
Figure 2.
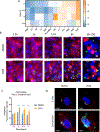
Figure 2.. LbL nanoparticle library screen.
A–C. MCF-10A cells were incubated with DOX (or DMSO control) for 24 hours, after which they were stained and treated with a library of 12 NPs differing in the coating of the outer layer (n=2). NP-cell association was quantified using CellProfiler A. Heatmap of nanoparticle-cell association comparing the ratio in STAT3-transformed and non-transformed cells. B. Representative images of PLE-NP treated cells at indicated time points (n=2). C. Quantification of PLE-NPs co-localized with the cell membrane. D. Deconvolution microscopy of PLE-NP interaction with MCF-10A cells following 24 hour NP treatment, as shown by Z slice and Z projection. B, D. The membrane and nuclei were stained using Wheat Germ Agglutinin (red) and Hoechst stain (blue), respectively. Nanoparticle fluorescence is shown in green (B) or cyan (D). DXS – dextran sulfate; HA – hyaluronic acid; PLD – poly-L-aspartic acid; Fuc – fucoidan; SBC - sulfated beta-cyclodextrin; HF - heparin sulfate folate conjugate; PAA - polyacrylic acid; PLE – poly-L-glutamic acid; PLE-PEG - poly-L-glutamic block-polyethylene glycol; 1:1, 1:3 and 3:1 – indicated ratio blend of hyaluronic acid and poly-L-aspartic acid.
Figure 3.
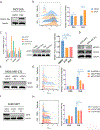
Figure 3.. PLE-NPs preferentially target STAT3-driven breast cancer cells.
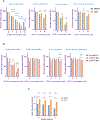
A. MCF-10A cells were treated with DOX (or DMSO control) to induce STAT3C, and protein expression was confirmed with the indicated immunoblots. B. Following treatment with the indicated NPs or controls, representative flow cytometry histograms are shown for the distribution of fluorescence (left) and quantification of median fluorescence intensity (right) (n=3). C. MCF-10A cells were pre-incubated for 4.5 hours with the STAT3 inhibitors pyrimethamine or ruxolitinib (or DMSO control), then STAT3C was induced with DOX (or DMSO control). The effects of the STAT3 pharmacological inhibitors were confirmed by qRT-PCR (left) and immunoblot analysis (center). Cells were then incubated with PLE-NP, and analyzed by flow cytometry (right). NP association with STAT3-transformed cells was normalized to the mean values of the non-transformed counterparts for each treatment (n=4). D. Immunoblot analysis of TNBC cell lines SUM159PT and MDA-MB-231 show constitutive phosphorylation of STAT3 on Y705. MDA-MB-231 (E) and SUM159PT (F) cells were transfected with two different siSTAT3 (or non-targeting siRNA control), and the effect on STAT3 expression was determined by immunoblot. Cells were then treated with PLE-NP, non-targeting DXS-NP (or vehicle (H2O) control), and analyzed by flow cytometry. Representative histograms of PLE-NP, DXS-NP and vehicle control fluorescence in MDA-MB-231 (G) and SUM159PT cells (H) are shown (left) and median fluorescent intensity was quantitated (right; n=3).
Figure 4.
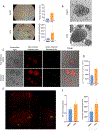
Figure 4.. Characterization of PLE-NP accumulation in three-dimensional cell organoids.
A,B. MCF-10A three-dimensional organoids were cultivated for 10 days with DMSO control (top) or DOX (bottom) to induce STAT3C expression. A. Organoid growth was imaged using optical microscopy and single organoid areas (top) and integrated densities (bottom) were quantified in ImageJ. B. Density of organoid cellular growth was recorded with confocal microscopy. C. Cells were cultured to form three-dimensional organoids in DMSO- or DOX-containing media for three days. Then they were treated with PLE-NPs and stained with Lox1 hypoxia stain for an additional 24 hours, then analyzed with confocal microscopy. Representative images of two independent experiments are shown (for DMSO, n=52; for DOX, n=70). D. Quantification of Lox1 hypoxia staining by ImageJ. E. XYZ projection of the PLE-NP distribution in DOX-induced MCF-10A organoid. F. The accumulation of the nanoparticles across the organoids was quantified using ImageJ and is presented as mean fluorescence per organoid ±SEM (left) and mean fluorescence per organoid volume ±SEM (right).
Figure 5.
Figure 5.. CDDP-loaded PLE-NPs show enhanced cytotoxic effects on STAT3-driven breast cancer cells.
Percent of viable MCF-10A (A) and SUM159PT cells (B) following treatment with CDDP-loaded PLE-NP, DXS-NP, non-coated liposomes, or free CDDP. A. Following STAT3C induction with DOX (or DMSO control), MCF-10A cells were treated for 2h with CDDP-loaded PLE-NPs, 4 hours with CDDP-loaded DXS- or non-coated NPs, or 24 hours with free CDDP. B. SUM159PT cells were transfected with two different siRNAs targeting STAT3 (or non-targeting siRNA control), then incubated for 24 hours with the indicated treatments. Cell survival was analyzed by flow cytometry using Annexin V/DAPI staining (n=3). C. MCF-10A cells were treated with DOX or DMSO, then irradiated with the indicated dose of gamma irradiation, and treated with PLE-NPs (or vehicle (H2O) control) (n=4). NP-cell association was analyzed by flow cytometry, and the percent difference in NP-cell binding between non-transformed and STAT3-transformed cells is indicated for each of the radiation doses.
Figure 6.
Figure 6.. Expression of enzymes involved in taurine and AA metabolism correlate with STAT3 transcriptional activity in primary breast cancers.
Gene set enrichment analysis was performed on the GSE5460 breast cancer microarray dataset. 129 breast cancer samples were sorted according to (A) CTH, (B) CDO1, (C) COX2 (PTGS2), and (D) 5-LOX (ALOX5) mRNA expression. The 30 samples with the highest and lowest mRNA expression for each gene were analyzed for expression of a STAT3 gene expression signature. Statistical significance is presented as normalized p-value and normalized enrichment score (NES).

Similar articles

Cited by

References

    1. Siegel RL, Miller KD, Jemal A. Cancer statistics, 2019. CA Cancer J Clin 2019;69(1):7–34. - PubMed
    1. Waks AG, Winer EP. Breast Cancer Treatment. JAMA 2019;321(3):316. - PubMed
    1. Ruddy KJ, Ganz PA. Treatment of Nonmetastatic Breast Cancer. JAMA 2019;321(17):1716–7 - PubMed
    1. Egusquiaguirre SP, Liu S, Tošić I, Jiang K, Walker SR, Nicolais M, et al. CDK5RAP3 is a co-factor for the oncogenic transcription factor STAT3. Neoplasia 2020;22(1):47–59 - PMC - PubMed
    1. Marotta LLC, Almendro V, Marusyk A, Shipitsin M, Schemme J, Walker SR, et al. The JAK2/STAT3 signaling pathway is required for growth of CD44+CD24– stem cell–like breast cancer cells in human tumors. J Clin Invest 2011;121(7):2723–35. - PMC - PubMed

Publication types

MeSH terms